#- Candlestick Patterns
Explore tagged Tumblr posts
Visit Tumblr Blog
Explore Tumblr blogs with no restrictions, modern design and the best experience.
Last Seen Tumblr Blogs


Fun Fact
Users from the US are the majority of Tumblr visitors.
Text
Bullish Marubozu: An Important Signal for Uptrend
Among candlestick patterns in market analysis, the Bullish Marubozu candlestick is a bullish indicator that is simple to understand and very effective. Unlike other candlesticks, which may show shadows or wicks, the Bullish Marubozu is unique in its simplicity—it has no shadows.
What Is the Bullish Marubozu?
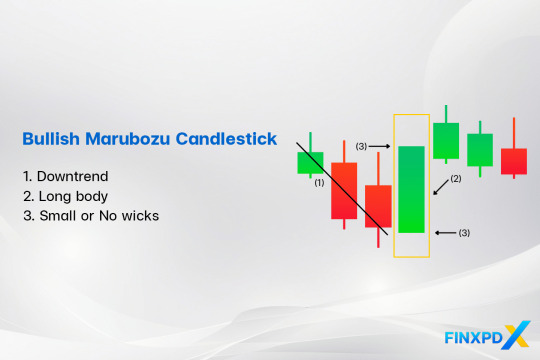
The Bullish Marubozu candlestick is a bullish candlestick pattern that shows strong buying pressure throughout the trading session. It has a long white or green body with no shadows or wicks, meaning the price opened at its lowest and closed at its highest point.
The name “White Marubozu” is another name for a Bullish Marubozu candlestick that combines its appearance and Japanese origins. “White” refers to the bullish candle color, and “Marubozu,” meaning “bald” in Japanese, describes its lack of wicks.
Characteristics of the Bullish Marubozu Candlestick
Bullish Marubozu: Features a long, solid green body with little to no wicks.
Full Bullish Marubozu: No wicks at all, showing the strongest bullish control throughout the session.
Open Bullish Marubozu: No lower wick but a small upper wick, indicating a strong upward move with slight selling pressure at the end.
Close Bullish Marubozu: A small lower wick but no upper wick, reflecting strong buying with a slightly higher open.
Read more: FinxpdX
Download PDF: 35 Powerful Candlestick Patterns
#investing#finance#investment#financial#stocks#forex#forextrading#forex market#candlestick#candlestick patterns#Marubozu#bullish#forex indicators
4 notes
·
View notes
Text
The Japanese Candlestick Charting Technique
The Japanese candlestick charting technique second edition book was written by Steve Nison. He wrote the book to understand the candlestick patterns and analyze the market.
Steve Nison structures the book from basics to advanced strategies
This Second Edition book contains:
More about intraday markets
More focus on active trading for swing, and day traders
New tactics for getting maximum use from intraday charts
New Western techniques in combination with candles
A greater focus on capital preservation.
4 notes
·
View notes
Text
Candlestick Charting: A Tale of Tradition and Innovation from Japan
Candlestick charting's rich origins in Japan reveal timeless insights into market sentiment. Embrace the past's wisdom as we navigate today's markets, confident that understanding emotions will illuminate brighter trading paths! 🚀📈 #FinancialWisdom
Candlestick charting, a vital tool for traders globally, originated in 18th-century Japan amid a feudal society and a thriving rice market. Developed by legendary trader Munehisa Homma, it visualised price movements using candlesticks, revealing market psychology and predicting trends. Steve Nison’s introduction of candlestick charting to the West in the 1980s revolutionised technical analysis.…

View On WordPress
#Bullish and Bearish Patterns#Candlestick Patterns#Feudal Japan#Financial Education#Japan#Market Psychology#Modern Trading#Price Action#Risk management#Technical Analysis
4 notes
·
View notes
Text
Mastering Candlestick Patterns: The Ultimate Guide
Candlestick patterns, also known as candle patterns, are one of the most widely used tools in technical analysis. They help traders and investors understand price movements and predict market trends with greater accuracy. A single candlestick on a chart shows the opening, closing, high, and low prices for a specific time period. By studying the shapes and arrangements of these candles, market participants can identify whether buyers or sellers are dominating and anticipate potential reversals or continuations in price.

For example, the Bullish Engulfing Pattern is a classic candlestick pattern that signals a potential upward reversal. It occurs when a small red candle (showing price decline) is followed by a large green candle that completely engulfs the previous red candle. This suggests that buyers have taken control after a period of selling pressure. Traders often consider this as a signal to enter long positions.
On the other hand, the Doji candle is a neutral pattern that reflects indecision in the market. In a Doji, the opening and closing prices are almost the same, creating a cross-shaped candle. This often appears at the top or bottom of trends and indicates that the market could reverse direction. For instance, if a Doji forms after a long uptrend, traders might prepare for a possible bearish reversal.
Another important candle pattern is the Hammer, which is characterized by a small body and a long lower shadow. The Hammer usually forms at the bottom of a downtrend and suggests that sellers pushed prices lower during the session, but buyers regained strength and pushed prices back up near the opening level. This reversal signal is widely used in both stock and crypto trading.
Candlestick patterns are even more powerful when combined with other technical tools such as moving averages or support and resistance levels. For example, a Bullish Engulfing pattern forming near a key support zone can be a strong buy signal. However, traders should remember that no candle pattern guarantees success. It is important to wait for confirmation before making trading decisions.
In summary, candlestick patterns provide visual insights into market psychology. From simple single-candle formations like Doji and Hammer to complex multi-candle structures like Morning Star and Evening Star, these patterns offer traders valuable clues about potential price movements. By learning to recognize and interpret these candle patterns, investors can improve their timing and make more informed trading decisions.
0 notes
Text
From Hammer to Harami: Using StockCharts to Crack the Candlestick Code | The Mindful Investor
About the author: David KellerCMT is President and Chief Strategist at Sierra Alpha Research LLC, where he helps active investors make better decisions using behavioral finance and technical analysis. Dave is a CNBC Contributor, and he recaps market activity and interviews leading experts on his “Market Misbehavior” YouTube channel. A former President of the CMT Association, Dave is also a member…
#bullish engulfing#Candlestick#candlestick patterns#Charts#chartschool#code#Crack#doji#ETFs#financial charts#hammer#Harami#investing#investor#Mindful#scanning#sharpcharts#shooting star#stockcharts#stockcharts tools#Stocks#technical analysis
0 notes
Text
youtube
Master Candlestick Patterns like a pro
This video promotes a free candlestick course by Definedge Gurukul. The course covers candlestick history, formation, types, patterns, and how to backtest and apply them in the market. Users can get free access to the course and one month of Definedge's 'zone' platform by opening a Demat account.
1 note
·
View note
Text
Mastering Market Moves: Candlestick Patterns in Forex Trading with Linkearn Hub

Candlestick patterns are essential tools in forex trading, offering visual insights into market sentiment and potential price movements. These patterns—like doji, engulfing, and hammer—help traders predict reversals or continuations in trends, enabling smarter entry and exit decisions. At Linkearn Hub, we empower traders with expert guidance and real-time analysis to decode these patterns effectively. By integrating candlestick analysis with solid risk management, traders can enhance their strategies and confidence in volatile markets. Join Linkearn Hub and transform the way you trade.
0 notes
Text
How to Trade the Bearish Engulfing Pattern: Complete Guide with Strategies and Examples
Candlestick patterns are powerful tools in the arsenal of a technical trader. Among the most reliable reversal patterns is the Bearish Engulfing Pattern—a strong signal that can hint at the start of a downward trend. In this guide, we’ll explain how to identify this pattern, why it works, and most importantly, how to trade it effectively with multiple strategies and examples. 📌 What is a Bearish…
#Bearish candle formation#Bearish engulfing candlestick pattern explained#Bearish Engulfing Pattern#Bearish engulfing pattern trading strategy#Bearish reversal pattern#Bearish trend confirmation#Can you trade bearish engulfing in forex?#Candlestick pattern for bearish reversal#candlestick patterns#Confirmation signals for bearish engulfing#EMA confluence with candlestick patterns#Engulfing candle trading rules#Entry and exit with candlestick patterns#Forex bearish engulfing strategy#How to confirm a bearish engulfing signal?#How to trade the bearish engulfing pattern#Is the bearish engulfing pattern reliable?#learn technical analysis#Multi-timeframe candlestick pattern strategy#Price action trading setup#Reversal Candlestick Patterns#Risk management for pattern trading#stock markets#Stock trading with bearish engulfing pattern#support and resistance levels#Swing trading with bearish engulfing#technical analysis#Trading bearish engulfing with moving averages#Trading Strategies#Using bearish engulfing with RSI
0 notes
Text
0 notes
Text
Top 8 Must-Know Chart Patterns in Technical Analysis | NTA®
Discover the 8 essential chart patterns every trader should master. Enhance your trading strategy with insights into market trends and price action analysis.
0 notes
Text
youtube
⚡ Comprendre tous les patterns de bougies japonaises en 5 minutes Vous voulez lire les marchés comme un pro ? Apprenez à interpréter les bougies japonaises, un outil essentiel en analyse technique.
📌 Dans cette vidéo, vous apprendrez : ✅ Comment intuitivement cmprendre les patterns de retournement et de continuation les plus connus ✅ Comment les repérer facilement sur vos graphiques sans les connaître ✅ Comment utiliser les time frames pour améliorer vos entrées
Une formation express pour mieux trader, dès aujourd’hui !
#stock market#indicateurs trading#bougies japonaises#signaux trading#day trading#swing trading#crypto trading#tendance haussière#tendance baissière#astuces trading#price action trading#stratégie de trading#trading efficace#retournement bourse#price action#méthode trading visuelle#chandeliers japonais#patterns trading#analyse technique#apprendre trading#signaux de bougies#bougies japonaises trading#bougie engulfing#hammer#candlestick patterns#Youtube
1 note
·
View note
Text
youtube
Ultimate Candlestick Patterns Trading Course
#Candlestick#Candlestick Patterns#trade#daytrader#daytrading#technical analysis#money#anti capitalism#capitalism#wall street#wall#wall street journal#investment#stocks#stock market#penny#Stereophile#penny stocks#investor#lamborghini#millionaire lifestyle#millionaire#billionaire#greed#luxury#rich#poor#learn#Youtube
0 notes
Text
Candlesticks are a visual representation of price fluctuation.
Each candle reflects the psychology of buyers and sellers.
Due to the constant interaction between buyers and sellers, certain patterns are formed on the chart — and by understanding these patterns, we can make strong buying or selling decisions.
A candlestick represents the opening, closing, highest and lowest prices within a certain period of time.
0 notes
Text
Unlocking the Power of TradingView: The Best Charting Platform for Traders
A sleek and modern TradingView dashboard displaying real-time charts, candlestick patterns, and powerful technical indicators like RSI and MACD. Are you looking for a powerful, easy-to-use charting tool to enhance your trading? Whether you’re a beginner or an experienced trader, TradingView is one of the best platforms for technical analysis, market insights, and strategy building. And here’s…
#Affiliate Marketing#Automated trading#Candlestick patterns#Crypto trading#Day trading#Forex trading#Investing#MACD#Market analysis#Online trading#passive income#RSI#Stock market#Swing trading#Technical analysis#Trading alerts#Trading bots#Trading platform#Trading signals#Trading strategies#Trading tools#TradingView#TradingView charts#TradingView indicators#TradingView plans#TradingView pricing#TradingView review
0 notes
Text
youtube
4 Types of Inside Bar Candlestick Patterns: Explained with RZONE Scanner
This video, presented by Brijesh Bhatia, dives into four distinct types of Inside Bar patterns, a common technical analysis pattern [00:09]. Beyond the basic and double Inside Bars you might already know, the video introduces two less common but highly insightful patterns: Multi Inside Bar and Coiling Inside Bar [00:25].
0 notes
Text
Unlock your full potential by delving into the world of trading without any cost. Our app is tailored to equip you with the knowledge and skills needed to navigate the complexities of the market, fostering financial independence through informed trading decisions.
Our aim is to make high-quality financial education accessible to everyone for free while ensuring both absolute beginners and trading beasts both have new knowledge to unlock.
With this candlestick patterns app you will go from a stock market noob to an expert day trader at the speed of sound using 5 powerful tools to help you learn Candlestick Patterns, Technical Analysis & Fundamental Analysis with ease.
• Expertly Written Lessons, To Help You Learn With Ease
• A Candlestick Simulator To Help You Practice
• A Profile Page To Make It Easier To Track Your Progress
• Quizzes & Tests To Help You Test Your Knowledge
• A Settings Page To Help You Customize Your Full App Experience
With these 5 POWERFUL features you could quickly and easily become a stock market expert and start making money on the stock market.
Candlestick patterns are used by professionals all the time to help them predict the markets and help them make money, So why shouldn't you use those tools as well?
Just a friendly heads-up: Trading can be a rollercoaster ride, with its ups and downs, and there's a chance you could lose some, or even all, of your capital invested. Everything you learn in the candlestick patterns app is here to enlighten and educate, not to serve as financial advice or an investment recommendation. So, enjoy the journey, but remember to buckle up!
Download ‘Learn Candlestick Patterns’ To Start Learning Now!
0 notes