#LargeMidcap
Explore tagged Tumblr posts
Visit Tumblr Blog
Explore Tumblr blogs with no restrictions, modern design and the best experience.
Last Seen Tumblr Blogs


Fun Fact
Tumblr Inc. is funded by 13 investors.
Text
A beginners guide to Mutual Funds Investing!

Investing in mutual funds is an excellent way to start building wealth and achieving your financial goals. Mutual funds offer diversification, professional management, and accessibility for investors of all levels. This guide will walk you through the basics of mutual fund investing as a beginner:
Understanding Mutual Funds:
A mutual fund is a collective investment vehicle that pools money from multiple investors to purchase a diversified portfolio of stocks, bonds, or other securities.
Investors buy shares in the mutual fund, and the fund's value is determined by the performance of the underlying assets.
Types of Mutual Funds:
Equity Funds: These invest primarily in stocks and aim for capital appreciation.
Fixed-Income Funds: These invest in bonds and aim for regular income.
Hybrid Funds: These combine both stocks and bonds to balance risk and return.
Money Market Funds: These invest in short-term, low-risk securities for stability.
Benefits of Mutual Funds:
Diversification: Mutual funds spread risk by holding a variety of assets.
Professional Management: Skilled fund managers make investment decisions.
Liquidity: You can buy or sell mutual fund shares daily.
Affordability: Many funds have low minimum investment requirements.
How to Invest in Mutual Funds:
Choose Your Investment Goal: Determine your financial goals, whether it's long-term wealth accumulation, retirement planning, or a specific objective.
Select the Right Type of Fund: Match your investment goal with the appropriate fund type (e.g., equity for growth, fixed-income for income).
Research and Compare Funds: Look for factors like past performance, fees, manager track record, and the fund's investment strategy.
Open an Account: You can invest in mutual funds through brokerage accounts, retirement accounts (e.g., IRAs), or directly through a fund company.
Invest Your Money: Decide how much to invest and make your initial investment. You can also set up automatic contributions for regular investing.
Monitor Your Investment: Keep track of your mutual fund's performance and make adjustments as needed to align with your goals.
Understanding Costs:
Expense Ratio: This is the annual fee expressed as a percentage of assets under management (AUM). Lower expense ratios are generally preferable.
Load vs. No-Load Funds: Some funds charge a sales commission (load), while others do not (no-load). No-load funds are typically more cost-effective.
Risk Management:
Mutual funds carry risk, and the level of risk depends on the type of fund you choose. Assess your risk tolerance and diversify your investments accordingly.
Long-Term Perspective:
Mutual funds are best suited for long-term goals. Avoid frequent buying and selling, as it can lead to higher costs and lower returns.
Tax Considerations:
Understand the tax implications of your investments, such as capital gains and dividends, especially if you invest in taxable accounts.
Seek Professional Advice:
If you're unsure about which funds to invest in or need personalized advice, consider consulting a financial advisor.
Stay Informed:
Keep learning about investing and monitor your portfolio regularly to ensure it aligns with your financial goals and risk tolerance.
Remember that mutual fund investing involves risks, and past performance is not indicative of future results. Diversification can help spread risk, but it does not guarantee profits or protect against losses. Be patient, and stick to your investment plan to achieve your long-term financial objectives.
You just have TO manage your savings & invest TO grow your money!

#MutualFund#MutualFunds#IndexFund#ESGFund#Globalfund#ValueFund#FocussedFund#LaregeCap#MidCap#LargeMidcap#SmallCap#Multicap#ELSS#ETF#SEBI#NSE#BSEIndia#SectoralFund#ThematicFund
0 notes
Text
Nifty 50 Stock: How to Track the Nifty 50 Top Gainer Daily
Nifty 50 Stock Masterclass: Track the Nifty 50 Top Gainer with Proven Market Techniques
Discover how to identify the Nifty 50 top gainer using charts, volume, and indicators. Track Nifty 50 Stock trends for smarter, data-driven market decisions. India’s capital markets have entered an age of intelligent investing. With advanced analytics and real-time data access now available to even retail traders, the game has shifted from speculation to strategic interpretation. At the heart of this transformation lies the Nifty 50 Stock index — a mirror of India’s large-cap corporate sector and a barometer of economic momentum.
Every day, one standout performer emerges: the Nifty 50 top gainer. This stock records the highest percentage gain among its 49 peers and signals something deeper than just a spike in price. It often reveals broader themes like sectoral rotation, institutional buying, or macroeconomic optimism.
In this advanced guide, we’ll unpack how to identify, analyze, and leverage the Nifty 50 top gainer using professional-grade methods. Whether you’re an intraday trader, swing investor, or long-term SIP enthusiast, understanding how a Nifty 50 Stock moves — and leads — can dramatically improve your decision-making.
The Core of Indian Equity: Understanding the Nifty 50 Stock Ecosystem
Before diving into indicators and platforms, let’s understand where Nifty 50 Stock fits in the broader market structure:
Nifty 50: The flagship index tracking the top 50 companies by free-float market cap and liquidity on the NSE.
Nifty Next 50: The next 50 largest companies — many of which eventually graduate to the Nifty 50.
Nifty 100 / 200 / 500 / Total Market: Progressive inclusivity across market caps, offering broader exposure.
Specialized indices: Nifty Midcap 100, Nifty Microcap 250, Nifty500 Equal-Cap, Nifty LargeMidcap 250, and others track segment-specific movements.
Understanding these indices helps you observe overlaps — a Nifty 50 top gainer that also features in Nifty 100 or Nifty500 Equal-Cap signals multi-layered buying pressure and cross-index institutional interest.
Why the Nifty 50 Top Gainer Deserves Daily Attention
Tracking the day’s leader within the Nifty 50 Stock universe can offer insights beyond the obvious. That daily movement could be driven by:
A stellar earnings report
Upbeat GDP or inflation data
Sector-wide upgrades
Government reforms or subsidies
Strategic buying by mutual funds, FIIs, or index ETFs
If a stock leads for several sessions in a row, it's often a strong candidate for accumulation. Many of these leaders also see upgrades in weightage within the Nifty 50, further accelerating their visibility and inflow.
Moreover, when the Nifty 50 top gainer triggers movement in related indices like Nifty LargeMidcap 250 or Nifty Midcap Select, you’re seeing real trend propagation.
How to Find the Nifty 50 Top Gainer Using Real-Time Tools
1. Start with Live Data Platforms
NSEIndia.com: Official and most accurate
TradingView: Best for customizable charts
Moneycontrol, Investing.com: Easy-to-use mobile dashboards
Chartink: Great for custom screeners
Steps:
Visit Nifty 50 index page
Sort stocks by % gain (from previous close)
The highest % gainer is the leader for the day
This is your Nifty 50 top gainer, the stock showing the most bullish price action in the short term.
2. Confirm the Move with Volume and Breadth
A real breakout is confirmed not just by price but by volume:
Check if the volume is 2–3 times higher than the 20-day average
Use volume indicators like VWAP, OBV, or Volume Oscillator
Look for accumulation patterns (e.g., higher lows + rising volume)
A price move backed by volume often reflects institutional activity — key to sustained trends in Nifty 50 Stock performance.
3. Validate with Technical Indicators
The right indicators help differentiate noise from opportunity:
RSI (Relative Strength Index): >60 signals trend strength; >80 may suggest overbought
MACD: Look for bullish crossover
VWAP: If price trades above VWAP through the session, strength is validated
ADX: ADX >25 confirms strong directional movement
Pro tip: Set alerts on TradingView when your selected Nifty 50 Stock crosses critical technical thresholds.
4. Moving Averages Provide Trend Context
A strong trend is often confirmed by the moving average structure:
20-day MA: short-term pulse
50-day MA: mid-term trend
200-day MA: long-term signal
Golden Cross (50 MA crossing above 200 MA) = Bullish confirmation
Watch for:
Breakout above all three moving averages
Support retests at 20/50-day MA
Volume confirmation on crossovers
If today’s Nifty 50 top gainer is trading above all key MAs, it’s likely in an established uptrend.
5. Assess Sectoral Momentum
Often, the top gainer belongs to a sector-wide rally. If a PSU bank leads, for example, cross-reference:
Nifty Bank
Nifty PSU Bank
Nifty Financial Services
Sector-specific mutual fund NAVs
Are peers in Nifty Midcap 100 or Nifty Smallcap 250 also gaining? If yes, the move is likely macro-driven — offering multiple trade setups.
6. Perform Multi-Timeframe Analysis
Strong gainers break resistance across:
Hourly charts (short-term confirmation)
Daily charts (trend structure)
Weekly charts (macro breakout potential)
Multi-timeframe alignment boosts trade reliability. When a Nifty 50 Stock rallies across intraday, daily, and weekly charts — especially with volume and news catalysts — it’s often at the start of a longer rally.
7. Cross-Check with Broader Index Participation
Stocks that are also part of:
Nifty Total Market
Nifty500 Multicap
Nifty500 Equal-Cap
Nifty Midcap Select
…enjoy broader mutual fund and ETF inflows. This increases demand, coverage, and ultimately sustainability.
When a Nifty 50 top gainer also leads in other indices, you’re seeing a cross-index breakout — a bullish signal rarely ignored by institutions.
8. Track FII/DII Activity and News Flow
Check sources like:
NSE Bulk/Block Deal Reports
Trendlyne
ET Markets, Bloomberg, CNBC TV18
If a top gainer is part of a bulk deal, a fund house report, or receives a target upgrade from top brokerages, momentum often sustains for days.
Pair this with volume, RSI, and moving averages, and you get a high-probability trade setup around the Nifty 50 Stock.
Why Nifty 50 Top Gainers Can Define the Next Market Leaders
The daily leaderboard isn't just for intraday traders. A Nifty 50 Stock that consistently tops the chart over weeks or months:
Attracts more weight in ETFs
Gains analyst upgrades
Garners rising institutional holding
These stocks often become foundational holdings in portfolios, SIPs, and thematic ETFs. Many started as momentum plays but turned into long-term wealth creators.
How to Integrate Nifty 50 Top Gainer Insights into Your Portfolio
Don’t just watch top gainers — integrate them:
Build a “Repeat Gainers” watchlist
Identify sector themes behind the leader (e.g., EV, infra, banking)
Create ETF/smart-beta strategies (e.g., include leaders from Nifty LargeMidcap 250 or Nifty500 Equal-Cap)
Use for SIP research in direct equity or thematic funds
If a Nifty 50 top gainer reappears over multiple days with cross-index support, it's a candidate for accumulation.
Conclusion: Master the Market by Following the Leaders
In a market flooded with opinions, tracking daily market leaders — specifically the Nifty 50 top gainer — offers clarity. It shows you where money is flowing, which sectors are heating up, and which Nifty 50 Stock is at the front of institutional radars.
Use technicals, volume, multi-timeframe charts, and cross-index support to filter the noise. And when you combine these tools daily, you don’t just react to the market — you anticipate it.
Whether for trading, swing positions, or long-term investments, watching the Nifty 50 Stock leaderboard daily might just be the smartest habit you adopt this year.
#Nifty 50#Nifty Next 50#Nifty 100#Nifty 200#Nifty 500#Nifty Midcap 50#Nifty Midcap 100#Nifty Midcap 150#Nifty Smallcap 50#Nifty Smallcap 100#Nifty Smallcap 250#Nifty Midsmallcap 400#Nifty500 Multicap#Nifty LargeMidcap 250#Nifty Midcap Select#Nifty Total Market#Nifty Microcap 250#Nifty500 Equal-Cap#Nifty 50 stocks#Nifty 50 top gainers#Nifty index#NSE indices#NSE stocks#India stock market#NSE stock list#Nifty stock list#top Nifty stocks#Nifty 50 stock#Nifty 50 top gainer#Nifty 50 companies
0 notes
Text
Mutual fund performances — Oct 2023 across various categories
Top #LargeCap #mutualfunds that underperformed the #Nifty100 index, which fell by-2.68% in Oct 23. #Mahindra Manulife-3.8% Taurus Largecap #Equity #Fund-3.68% #Tata LargeCap Fund-3.37% #MiraeAsset LargeCap Fund-3.34% #NipponIndia LargeCap Fund-3% SBI #BlueChip Fund-2.97%
Top #LargeCap #mutualfunds that outperformed the #Nifty100 index, which fell by-2.68% in Oct 23
ITI LargeCap Fund -1.84% BOI AXA Bluechip Fund -1.86% WhiteOak Capital LargeCap Fund -2.08% Axis Bluechip Fund -2.11% ICICI Prudential Bluechip Fund -2.12% JM LargeCap Fund -2.19%
Top #LargeMidcap #mutualfunds that underperformed the #Nifty 250 index, which fell by -3.23% in Oct 23.
Tata Large&MidCap -3.84% Navi Large&Midcap -3.78% Aditya Birla Sun Life Equity Advantage -3.73% Mirae Asset Emerging Bluechip -3.49% Baroda BNP Paribas Large&MidCap -3.42%
Top #LargeMidcap #mutualfunds that outperformed the #Nifty 250 index, which fell by -3.23% in Oct 23.
Invesco India Growth Opportunities -0.86% Axis Growth Opportunities -1.95% Franklin India Equity Advantage -2.32% Edelweiss Large&MidCap -2.34% Union #Largecap #MidCap -2.37%
Top #Midcap #mutualfunds that underperformed the #NiftyMidcap 150 index, which fell by -3.78% in Oct 23.
Mirae Asset Midcap Fund -4.16% Aditya Birla Sun Life Midcap Fund -3.83% ICICI Prudential MidCap Fund -3.76% JM Midcap Fund -3.45% DSP Midcap Fund -3.32%
Top #Midcap #mutualfunds that outperformed the #NiftyMidcap 150 index, which fell by -3.78% in Oct 23.
Motilal Oswal Midcap Fund -0.88% HSBC MidCap Fund -1.39% Canara Robeco MidCap #mf -1.59% Kotak Emerging Equity -1.96% WhiteOak Capital MidCap -2% Edelweiss Mid Cap -2.13%
Top #Flexicap #mutualfunds that underperformed the #Nifty500 index,which fell by-2.77% in Oct 23.
AdityaBirlaSunLife FlexiCap Fund -3.62% 360ONE Flexicap Fund -3.51% Quant Flexicap Fund -3.45% Taurus FlexiCap Fund -3.41% DSP FlexiCap Fund -3.35% MiraeAsset FlexiCap Fund -3.35%
Top #Flexicap #mutualfunds that outperformed the #Nifty500 index,which fell by -2.77% in Oct 23
MotilalOswal FlexiCap Fund +0.2% ParagParikh FlexiCap Fund +0% BajajFinserv FlexiCap Fund -0.5% NJ FlexiCap Fund -0.5% InvescoIndia FlexiCap Fund -1% WhiteOakCapital FlexiCap -1.4%
Top 5 #smallcap #mutualfunds that underperformed the #NiftySmallcap 250 index, which fell by-1.68% in Oct 23.
Kotak SmallCap Fund -3.1% Quant SmallCap Fund -2.9% AdityaBirlaSunLife Smallcap Fund -2.52% ICICI Prudential Smallcap Fund -2.48% SBI SmallCap Fund -2.44%
Top #smallcap #mutualfunds that outperformed the #NiftySmallcap 250 index, which fell by-1.68% in Oct 23.
Invesco India Smallcap Fund+1.17% Union SmallCap Fund+0.58% BankofIndia SmallCap Fund+0.57% Axis SmallCap Fund-0.35% ITI SmallCap Fund-0.54% NipponIndia SmallCap Fund-1.3%
1 note
·
View note
Photo

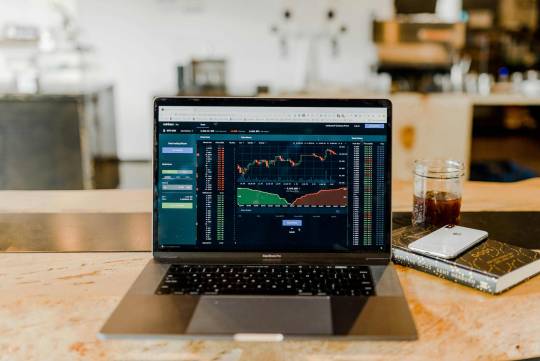
Daily Equity Report As on 17Jul2020 Daily Equity Report As on 17Jul2020 Index Movement -Daywise (%) 17-Jul 16-Jul 15-Jul 14-Jul 13-Jul 10-Jul 09-Jul Nifty 50 1.51 1.15 0.10 -1.81 0.32 -0.42 1.01 Auto 1.73 1.22 0.22 -2.38 0.62 -0.63 0.37 Bank 1.71 1.20 -0.24 -3.16 -1.38 -2.22 1.43 Commodities 2.68 0.25 -0.68 -1.67 0.77 -0.52 0.76 Energy 4.20 0.26 -1.91 -1.71 0.93 0.53 0.46 Financial Services 1.94 0.87 -0.34 -2.45 -1.54 -1.89 1.58 FMCG 0.82 0.13 0.67 -0.90 1.28 0.49 -0.33 IT -0.62 2.83 5.24 -1.13 1.63 0.19 0.14 Pharma 0.87 1.68 0.55 0.48 0.34 0.85 0.39 LargeMidcap 250 1.35 0.71 -0.17 -1.39 0.06 -0.53 0.50 MidSmallcap 400 1.21 0.25 -0.26 -1.16 -0.14 -0.57 0.37 Smallcap 250 1.32 -0.07 -0.07 -1.30 -0.01 -0.33 0.83 Sector Winners and Losers(Change in Market Cap) LargeCap MidCap SmallCap Refineries 5,878,034 Telecommunications-Service 265,099 Pharmaceuticals 276,834 Banks-Private-Sector 2,807,734 Banks-Public-Sector 265,081 Miscellaneous 157,099 Personal-Care 1,374,227 Banks-Private-Sector 159,014 Media-Entertainment 143,495 Oil-Drilling-And-Exploration 865,138 Diversified 155,389 Chemicals 79,632 Diversified 661,546 Miscellaneous 138,615 Finance-General 74,910 Breweries-Distilleries -30,156 Plantations-Tea-Coffee -18,594 Hotels -7,234 Aluminium -87,596 Lubricants -20,277 Hospitals-Medical-Services -16,075 Retail -112,065 Paints-Varnishes -26,138 Computers-Software-Medium-Small -22,718 Food Processing -167,727 Computers-Software-Medium-Small -63,754 Textiles-Weaving -25,471 Computers-Software -1,810,822 Computers-Software -74,339 Sugar -29,012 Stocks Winners and Losers LargeCap Price Change(%) MidCap Price Change(%) SmallCap Price Change(%) BPCL 12.67 IDEA 13.38 TEXRAIL 19.96 HAL 11.19 TATAPOWER 5.57 HEG 14.46 HINDPETRO 6.77 NMDC 5.05 HIL 13.14 MUTHOOTFIN 6.30 SYNGENE 5.02 VIVIDHA 11.11 ONGC 5.52 VOLTAS 4.82 TRF 10.00 SBICARD 5.01 UNIONBANK 4.68 IOLCP 9.99 CADILAHC 4.57 IOB 4.41 EVEREADY 9.98 INFRATEL 4.26 CONCOR 4.36 PANACEABIO 9.98 GAIL 4.24 APOLLOHOSP 4.36 TRIL 9.95 TITAN 3.80 EMAMILTD 4.33 HATHWAY 9.94 HCLTECH -0.73 OFSS -1.81 ROLLT -5.00 DRREDDY -0.80 GLAXO -1.87 TIMESGTY -5.23 INFY -0.86 TATACOMM -1.89 EASTSILK -5.26 DMART -0.86 MOTILALOFS -2.10 HGINFRA -6.01 LTI -1.19 BBTC -2.11 TARMAT -6.01 TCS -1.52 THERMAX -2.34 APOLSINHOT -6.41 BRITANNIA -1.81 ISEC -3.16 KAUSHALYA -6.67 HINDALCO -2.35 MPHASIS -3.29 SANGAMIND -9.34 ALKEM -2.47 LTTS -4.24 KUANTUM -9.94 Stocks Delivery Spurt compared to 10 Days Average MidCap Max of Price Change Delivery Change(%) SmallCap Max of Price Change Delivery Change(%) BBTC 8.78 314.76 PAISALO 19.07 657.62 SYNGENE 2.34 301.11 RUCHI 5.00 617.37 NATCOPHARM 0.38 287.94 ALOKINDS -4.97 607.68 JUBLFOOD -3.84 282.24 AHLWEST -1.04 576.72 PNB -5.53 262.06 KUANTUM 17.55 543.36 CREDITACC -1.23 241.58 POLYMED 12.39 528.89 SUNDARMFIN -4.81 192.37 INSPIRISYS 19.96 508.34 PHOENIXLTD 2.33 190.80 PTL 2.63 468.88 KANSAINER -1.00 187.31 KICL -0.46 435.82 MGL -4.16 184.80 GUFICBIO 2.16 422.59 Options World - Participant wise OI Change Date Client DII FII Pro FII + Pro Combined 17/07/2020 51738 0 30219 -81957 30219 16/07/2020 -85727 993 -34858 119592 -33865 15/07/2020 -126065 1641 32591 91833 34232 14/07/2020 6098 -1888 -4515 305 -6403 13/07/2020 -12730 -721 28754 -15303 28033 10/07/2020 163873 -25 -29487 -134361 -29512 09/07/2020 -145260 20 -10609 155849 -10589 08/07/2020 105121 -1580 -3132 -100409 -4712 07/07/2020 26936 3629 -19137 -11428 -15508 06/07/2020 -65548 41 19856 45651 19897 03/07/2020 -47492 -2130 -3534 53156 -5664 02/07/2020 179160 2362 4373 -185895 6735 Top Nifty Call Writing this week Strike 17-Jul 16-Jul 15-Jul 14-Jul 13-Jul 11200 1252800 508275 181275 92550 256200 10800 298725 397950 705300 1608150 150600 10600 59175 165975 49425 967500 7350 10750 24750 2114025 444450 860925 2700 10700 6000 327375 177375 2269200 6525 Top Nifty Put Writing this week Strike 17-Jul 16-Jul 15-Jul 14-Jul 13-Jul 10700 1886475 1615500 145125 75 742950 10800 1579425 76275 76200 75 522975 10600 526050 1690875 391275 99975 104025 10650 310050 1482525 186525 6525 312600 10550 167100 1350675 92700 111525 287625 NSE Advane Decline Put-Call Ratio Advance Decline Ratio Index Put OI 83,267,735 NSE All 969 458 2.12 Index Call OI 50,744,465 LargeCap 73 18 4.06 1.64 MidCap 97 35 2.77 SmallCap 816 405 2.01
0 notes
Text
Exploring Nifty Equity Indices
Exploring Nifty Equity Indices
Detailed Explanation of Nifty 50, Nifty Next 50 & 11 More Nifty Indices Introduction
Nifty50 and Sensex are the most popular, also widely tracked and traded indices in the Indian stock markets. However, these are not the only two. There are many more Nifty Indices. In this article, we are exploring the Nifty equity indices in broad based index category in detail.
Exploring Nifty Equity…
View On WordPress
#broad-based benchmark indices#nifty#nifty 100#Nifty 200#Nifty 50#Nifty 500#Nifty Equity Indices#Nifty Indices#NIFTY LargeMidcap 250#Nifty Midcap 100#Nifty Midcap 150#Nifty Midcap 50#NIFTY MidSmallcap 400#Nifty Next 50#Nifty Smallcap 250
0 notes
Text
#Nifty 50#Nifty Next 50#Nifty 100#Nifty 200#Nifty 500#Nifty Midcap 50#Nifty Midcap 100#Nifty Midcap 150#Nifty Smallcap 50#Nifty Smallcap 100#Nifty Smallcap 250#Nifty Midsmallcap 400#Nifty500 Multicap#Nifty LargeMidcap 250#Nifty Midcap Select#Nifty Total Market#Nifty Microcap 250#Nifty500 Equal-Cap#Nifty 50 stocks#Nifty 50 top gainers#Nifty index#NSE indices#NSE stocks#India stock market#NSE stock list#Nifty stock list#top Nifty stocks#Nifty 50 stock#Nifty 50 top gainer#Nifty 50 companies
0 notes
Text
#Nifty 50#Nifty Next 50#Nifty 100#Nifty 200#Nifty 500#Nifty Midcap 50#Nifty Midcap 100#Nifty Midcap 150#Nifty Smallcap 50#Nifty Smallcap 100#Nifty Smallcap 250#Nifty Midsmallcap 400#Nifty500 Multicap#Nifty LargeMidcap 250#Nifty Midcap Select#Nifty Total Market#Nifty Microcap 250#Nifty500 Equal-Cap#Nifty 50 stocks#Nifty 50 companies#Nifty 50 top gainer#Nifty 50 index#Nifty stocks#Nifty share list#Nifty top stocks#NSE indices#NSE stocks#Indian stock market#Indian indices#stock market India
0 notes
Text
Why Smart Investors Are Eyeing Nifty Next 50 Stocks Now

India’s evolving stock market landscape is more dynamic than ever — and the Nifty Next 50 stocks are quickly becoming the spotlight for investors looking to gain from tomorrow’s large-cap leaders.
📌 What Are Nifty Next 50 Stocks?
The Nifty Next 50 index represents the 50 companies that rank just below the Nifty 50 Stocks in terms of free-float market capitalization within the Nifty 100 universe. These companies are the rising stars — often industry leaders in their own right — poised to graduate into the Nifty 50 as their growth trajectory continues.
This positioning makes Nifty Next 50 stocks extremely attractive for investors who seek a balance between growth and stability. They’re not as mature (and often not as saturated) as Nifty 50 constituents, but they belong to the broader Nifty 100, and many will eventually become the next generation of blue-chip stocks.
🚀 Why Nifty Next 50 Stocks Are the New Sweet Spot
Smart investors are shifting their focus toward Nifty Next 50 companies due to several compelling reasons:
1. Track Record of Outperformance
Over longer time frames, the Nifty Next 50 index has often outperformed the Nifty 50, especially during bull runs. This is largely due to the growth potential of companies that are still in an aggressive expansion phase, unlike the more mature and stable businesses in the Nifty 50.
2. Part of the Nifty 100 – The Best of Both Worlds
Since these stocks are part of the Nifty 100, they benefit from large-cap visibility while offering mid-cap-like returns. Many also feature in Nifty LargeMidcap 250, which further highlights their hybrid nature — large enough for stability, but small enough for explosive growth.
💼 How Nifty Next 50 Fits Within India’s Market Indices
To fully appreciate the opportunity, let’s briefly map the Nifty Next 50 in context with other major Indian indices:
Nifty 50: India’s top 50 companies by market cap.
Nifty 100: Includes Nifty 50 + Nifty Next 50.
Nifty 200: A blend of large and mid-cap companies.
Nifty 500: The broadest representation of Indian equity market performance.
Nifty500 Equal-Cap: Equal-weighted version of the Nifty 500.
Nifty Total Market: Comprehensive coverage of India’s investable equity universe.
Within this broader framework, the Nifty Next 50 serves as a vital bridge — capturing companies that are too large for mid-cap indices but not yet in the top 50.
📈 Sectoral & Strategic Diversification
Unlike the Nifty 50, which is often dominated by banking and financials, the Nifty Next 50 brings in greater sectoral diversity — including consumer goods, pharmaceuticals, retail, energy, and industrials. It overlaps with:
Nifty Midcap 50
Nifty Midcap 100
Nifty Midcap 150
Nifty LargeMidcap 250
Nifty Midcap Select
Nifty Midsmallcap 400
This cross-index representation offers investors exposure to emerging leaders across sectors, without the elevated risks typically associated with small caps.
💹 Growth Potential Without Microcap Risk
For those hesitant to invest in the Nifty Microcap 250 or Nifty Smallcap 250, the Nifty Next 50 serves as an excellent middle ground. These are established businesses with strong fundamentals and proven revenue models — a step above micro and small-cap volatility but with enough runway to offer attractive long-term returns.
Additionally, investors looking to diversify into broader equity coverage, such as through Nifty500 Multicap, often find that Nifty Next 50 stocks are a key part of their core allocations.
🧠 Ideal for ETF, SIP & Passive Investing
With the rise of low-cost ETFs and index funds, retail and institutional investors alike are turning to passive instruments tracking Nifty Next 50. These funds provide:
Access to high-growth potential companies
Diversification across sectors
Rebalancing in line with index updates
Lower fees compared to active funds
For example, a SIP in a Nifty Next 50 ETF can compound significantly over 5–10 years, particularly when market cycles favor mid-to-large cap growth.
🏆 Regular Rebalancing Keeps It Fresh
The index is rebalanced semi-annually, removing laggards and adding rising performers. This built-in discipline ensures the Nifty Next 50 always reflects the next in line for Nifty 50 status.
As companies evolve, some move up to the Nifty 50, while others fall off — but investors benefit from being in a curated, forward-looking basket of stocks that are constantly monitored for relevance.
💥 Performance in Market Cycles
During recovery phases or economic expansions, Nifty Next 50 stocks tend to rally more sharply than their Nifty 50 counterparts. They often bounce back faster due to:
Higher earnings growth
More aggressive business models
Greater sector rotation impact
They also benefit from broader exposure in portfolios that mirror indices like Nifty Midsmallcap 400 or Nifty500 Equal-Cap, further validating their role in multi-cap or balanced strategies.
🔚 Conclusion: Nifty Next 50 Is a Smart Investor’s Gateway
To sum it up:
✅ Nifty Next 50 stocks offer a golden opportunity to tap into future market leaders. ✅ They combine the best of growth and quality, without diving into the high-risk small or microcap segment. ✅ Positioned within the Nifty 100, they are part of India’s core equity universe, yet still underappreciated by the masses. ✅ With ETF options, SIP feasibility, and strong fundamentals, they are tailor-made for long-term investors and strategic portfolio builders.
📌 Bonus Tip:
Keep an eye on index movements — when a Nifty Next 50 stock enters the Nifty 50, it usually triggers institutional buying and potential price re-rating. Anticipating such moves can provide significant alpha.
Are you investing in the future of India’s stock market — or just its past? Explore the Nifty 50 top gainer now and get ahead of the curve.
#Nifty 50#Nifty Next 50#Nifty 100#Nifty 200#Nifty 500#Nifty Midcap 50#Nifty Midcap 100#Nifty Midcap 150#Nifty Smallcap 50#Nifty Smallcap 100#Nifty Smallcap 250#Nifty Midsmallcap 400#Nifty500 Multicap#Nifty LargeMidcap 250#Nifty Midcap Select#Nifty Total Market#Nifty Microcap 250#Nifty500 Equal-Cap#Nifty 50 stocks#Nifty 50 companies#Nifty 50 top gainer#Nifty 50 index#Nifty stocks#Nifty share list#Nifty top stocks#NSE indices#NSE stocks#Indian stock market#Indian indices#stock market India
0 notes
Photo

Daily Equity Report As on 17Jul2020 Daily Equity Report As on 17Jul2020 Index Movement - Last 10 Day Days (%) 17-Jul 16-Jul 15-Jul 14-Jul 13-Jul 10-Jul 09-Jul 08-Jul Nifty 50 1.51 1.15 0.10 -1.81 0.32 -0.42 1.01 -0.87 Auto 1.73 1.22 0.22 -2.38 0.62 -0.63 0.37 -1.95 Bank 1.71 1.20 -0.24 -3.16 -1.38 -2.22 1.43 -0.19 Commodities 2.68 0.25 -0.68 -1.67 0.77 -0.52 0.76 -0.56 Energy 4.20 0.26 -1.91 -1.71 0.93 0.53 0.46 -0.97 Financial Services 1.94 0.87 -0.34 -2.45 -1.54 -1.89 1.58 -0.58 FMCG 0.82 0.13 0.67 -0.90 1.28 0.49 -0.33 0.84 IT -0.62 2.83 5.24 -1.13 1.63 0.19 0.14 -1.72 Pharma 0.87 1.68 0.55 0.48 0.34 0.85 0.39 0.71 LargeMidcap 250 1.35 0.71 -0.17 -1.39 0.06 -0.53 0.50 -0.68 MidSmallcap 400 1.21 0.25 -0.26 -1.16 -0.14 -0.57 0.37 -0.48 Smallcap 250 1.32 -0.07 -0.07 -1.30 -0.01 -0.33 0.83 -0.27 Sector Winners and Losers(Change in Market Cap) LargeCap MidCap SmallCap Refineries 5,878,034 Telecommunications-Service 265,099 Pharmaceuticals 276,834 Banks-Private-Sector 2,807,734 Banks-Public-Sector 265,081 Miscellaneous 157,099 Personal-Care 1,374,227 Banks-Private-Sector 159,014 Media-Entertainment 143,495 Oil-Drilling-And-Exploration 865,138 Diversified 155,389 Chemicals 79,632 Diversified 661,546 Miscellaneous 138,615 Finance-General 74,910 Breweries-Distilleries -30,156 Plantations-Tea-Coffee -18,594 Hotels -7,234 Aluminium -87,596 Lubricants -20,277 Hospitals-Medical-Services -16,075 Retail -112,065 Paints-Varnishes -26,138 Computers-Software-Medium-Small -22,718 Food Processing -167,727 Computers-Software-Medium-Small -63,754 Textiles-Weaving -25,471 Computers-Software -1,810,822 Computers-Software -74,339 Sugar -29,012 Stocks Winners and Losers LargeCap Price Change(%) Change in Mkt Cap MidCap Price Change(%) Change in Mkt Cap SmallCap Price Change(%) Change in Mkt Cap BPCL 12.67 1,082,457 IDEA 13.38 301,722 TEXRAIL 19.96 12,844 HAL 11.19 315,327 TATAPOWER 5.57 70,324 HEG 14.46 40,506 HINDPETRO 6.77 216,383 NMDC 5.05 127,067 HIL 13.14 11,274 MUTHOOTFIN 6.30 285,816 SYNGENE 5.02 81,000 VIVIDHA 11.11 146 ONGC 5.52 528,372 VOLTAS 4.82 87,684 TRF 10.00 814 SBICARD 5.01 338,494 UNIONBANK 4.68 47,919 IOLCP 9.99 33,820 CADILAHC 4.57 168,918 IOB 4.41 56,634 EVEREADY 9.98 7,450 INFRATEL 4.26 149,818 CONCOR 4.36 114,243 PANACEABIO 9.98 10,903 GAIL 4.24 184,916 APOLLOHOSP 4.36 87,092 TRIL 9.95 1,259 TITAN 3.80 324,042 EMAMILTD 4.33 45,847 HATHWAY 9.94 69,919 MCDOWELL-N -0.68 -30,156 CASTROLIND -1.71 -20,277 SPCENET -5.00 -25 HCLTECH -0.73 -124,829 OFSS -1.81 -48,892 ROLLT -5.00 -250 DRREDDY -0.80 -55,498 GLAXO -1.87 -48,958 TIMESGTY -5.23 -108 INFY -0.86 -334,323 TATACOMM -1.89 -36,623 EASTSILK -5.26 -39 DMART -0.86 -112,065 MOTILALOFS -2.10 -21,270 HGINFRA -6.01 -7,918 LTI -1.19 -47,335 BBTC -2.11 -18,594 TARMAT -6.01 -192 TCS -1.52 -1,275,811 THERMAX -2.34 -21,150 APOLSINHOT -6.41 -810 BRITANNIA -1.81 -167,727 ISEC -3.16 -55,408 KAUSHALYA -6.67 -17 HINDALCO -2.35 -87,596 MPHASIS -3.29 -63,203 SANGAMIND -9.34 -2,385 ALKEM -2.47 -75,744 LTTS -4.24 -63,754 KUANTUM -9.94 -641 Stocks Delivery Spurt compared to 10 Days Average LargeCap Price Change(%) Delivery Change(%) MidCap Max of Price Change Delivery Change(%) SmallCap Max of Price Change Delivery Change(%) ICICIPRULI -3.65 171.33 BBTC 8.78 314.76 PAISALO 19.07 657.62 BPCL -0.11 170.92 SYNGENE 2.34 301.11 RUCHI 5.00 617.37 IDEA 4.28 162.97 NATCOPHARM 0.38 287.94 ALOKINDS -4.97 607.68 BIOCON 2.06 159.84 JUBLFOOD -3.84 282.24 AHLWEST -1.04 576.72 INFRATEL -2.56 140.12 PNB -5.53 262.06 KUANTUM 17.55 543.36 DLF 1.20 138.55 CREDITACC -1.23 241.58 POLYMED 12.39 528.89 SUNPHARMA 2.48 134.67 SUNDARMFIN -4.81 192.37 INSPIRISYS 19.96 508.34 POWERGRID 0.61 131.38 PHOENIXLTD 2.33 190.80 PTL 2.63 468.88 TITAN -3.00 130.00 KANSAINER -1.00 187.31 KICL -0.46 435.82 SBIN -1.76 129.51 MGL -4.16 184.80 GUFICBIO 2.16 422.59 Options World - Participant wise OI Change Put-Call Ratio Date Client DII FII Pro FII + Pro Combined Index Put OI 83,267,735 17/07/2020 51738 0 30219 -81957 30219 Index Call OI 50,744,465 16/07/2020 -85727 993 -34858 119592 -33865 1.64 15/07/2020 -126065 1641 32591 91833 34232 14/07/2020 6098 -1888 -4515 305 -6403 13/07/2020 -12730 -721 28754 -15303 28033 10/07/2020 163873 -25 -29487 -134361 -29512 09/07/2020 -145260 20 -10609 155849 -10589 08/07/2020 105121 -1580 -3132 -100409 -4712 07/07/2020 26936 3629 -19137 -11428 -15508 06/07/2020 -65548 41 19856 45651 19897 03/07/2020 -47492 -2130 -3534 53156 -5664 02/07/2020 179160 2362 4373 -185895 6735 Top Nifty Call Writing this week Strike 17-Jul 16-Jul 15-Jul 14-Jul 13-Jul 11200 1252800 508275 181275 92550 256200 10800 298725 397950 705300 1608150 150600 10600 59175 165975 49425 967500 7350 10750 24750 2114025 444450 860925 2700 10700 6000 327375 177375 2269200 6525 Top Nifty Put Writing this week Strike 17-Jul 16-Jul 15-Jul 14-Jul 13-Jul 10700 1886475 1615500 145125 75 742950 10800 1579425 76275 76200 75 522975 10600 526050 1690875 391275 99975 104025 10650 310050 1482525 186525 6525 312600 10550 167100 1350675 92700 111525 287625 NSE Advane Decline Advance Decline Ratio NSE All 969 458 2.12 LargeCap 73 18 4.06 MidCap 97 35 2.77 SmallCap 816 405 2.01
0 notes
Photo
Daily Equity Report As on 10Jul2020 Daily Equity Report As on 10Jul2020 Index Movement - Last 10 Day Days (%) 10-Jul 09-Jul 08-Jul 07-Jul 06-Jul 03-Jul 02-Jul 01-Jul 30-Jun Nifty 50 -0.42 1.01 -0.87 0.33 1.47 0.53 1.17 1.24 -0.1 Auto -0.63 0.37 -1.95 0.39 2.88 0.93 2.81 -0.01 1.1 Bank -2.22 1.43 -0.19 1.93 1.59 -0.46 -0.11 2.84 0.05 Commodities -0.52 0.76 -0.56 -1.36 1.75 0.45 0.83 0.26 -0.2 Energy 0.53 0.46 -0.97 -2.01 1.54 1 1.04 0.54 -1.32 Financial Services -1.89 1.58 -0.58 1.54 1.41 -0.33 0.59 2.66 0.27 FMCG 0.49 -0.33 0.84 -0.42 0.39 0.7 0.28 0.56 0.31 IT 0.19 0.14 -1.72 2.07 1.17 1.08 2.65 -0.15 -0.09 Pharma 0.85 0.39 0.71 -0.23 -0.62 0.2 0.62 -1.02 -1.49 LargeMidcap 250 -0.53 0.5 -0.68 0.43 1.45 0.61 1.09 0.66 -0.19 MidSmallcap 400 -0.57 0.37 -0.48 0.56 1.58 0.55 1.01 0.38 -0.43 Smallcap 250 -0.33 0.83 -0.27 0.69 1.58 0.27 0.86 0.69 -0.75 Nse Advance - Decline Put Call Ratio Pur Call Ratio Index Put OI 72,283,925 1.35 Index Call OI 53,358,610 Sector Performance Large Cap Nse Stocks Best Performing Worst Performing Symbol LTP Change(%) Mkt Cap Ch.
0 notes
Text
Nifty Index Changes - Stock Reshuffle
Nifty Index Changes – Stock Reshuffle
Changes in various Nifty Indices w.e.f. 29th March, 2019
NIFTYor NIFTY 50 index is National Stock Exchange of India’s benchmark, a broad based stock market index for the Indian equity market. Full form of NIFTY is National Stock Exchange Fifty. Many indices saw changes as some small cap stocks became mid cap stocks and vice versa. And some mid cap stocks became large cap stocks and vice versa.…
View On WordPress
#Nifty 100 changes#Nifty 50 changes 2019#Nifty changes#Nifty stock changes#Nifty stock shuffle#NSE index changes
0 notes