#candlestick charts
Explore tagged Tumblr posts
Visit Tumblr Blog
Explore Tumblr blogs with no restrictions, modern design and the best experience.
Last Seen Tumblr Blogs


Fun Fact
In February 2021, Tumblr had 518.6 million blog accounts.
Text
youtube
Mastering Forex Charts: A Beginner's Guide to Candlesticks, Lines, and Bar Patterns
#Forex trading#Forex charts#candlestick charts#line charts#bar charts#trading tutorial#chart analysis#technical analysis#Forex market#bullish patterns#bearish patterns#price movements#market trends#OHLC#trading strategies#chart reading#price action#trading tips#beginner trading#advanced trading#Forex education#PipInfuse#trading insights#market sentiment#trend analysis#trading confidence#Youtube
1 note
·
View note
Text
Unveiling the Mystery of the Abandoned Baby Pattern in Candlestick Charting
Introduction: Candlestick charting has become an indispensable tool for technical analysts in the world of financial markets. These charts provide a visual representation of price movements and patterns, aiding traders and investors in making informed decisions. Among the myriad of candlestick patterns, the Abandoned Baby pattern stands out as a unique and powerful signal. In this blog post,…
View On WordPress
#Abandoned Baby Pattern#candlestick charts#candlestick patterns#Chart Patterns#cryptocurrency trading#Financial Markets#forex trading#Market Analysis#Pattern Recognition#price action#stock market#technical analysis#Trading Psychology#trading signals#Trading Strategies
1 note
·
View note
Text


#handmade#resin#candle holders#candlestick holders#yellow green#chart#chartreuse#neon#neon yellow#yellow#uv reactive#uv glow#uv fluorescent#sharkyswaters
3 notes
·
View notes
Text
What is a Candlestick Chart? Understanding the Evening Star Candlestick Pattern
Introduction: What is a Candlestick Chart?
If you're new to Forex or trading in general, you may have come across the term "candlestick chart." But what is a candlestick chart? A candlestick chart is a graphical representation of price movements over a specific period, commonly used in trading to analyze price action. It consists of individual candlesticks, each representing a time period (such as a minute, hour, or day) and showing the open, high, low, and close prices for that period. Candlestick patterns provide valuable insights into market sentiment and can help traders identify potential trend reversals or continuation patterns.

One such pattern is the Evening Star Candlestick Pattern, a crucial formation that traders use to spot potential bearish reversals in an uptrend. In this guide, we will explain what this pattern looks like, how it works, and how you can use it to make informed trading decisions.
What is the Evening Star Candlestick Pattern?
The Evening Star Candlestick Pattern is a three-candle formation that signals a reversal in an uptrend. It's often considered a strong bearish signal, indicating that the market might be ready to change direction. The pattern is made up of the following candles:
First Candle (Bullish Candle): The first candle in the pattern is a large bullish candlestick, signaling that the market is in an uptrend.
Second Candle (Doji or Small Body Candle): The second candle is typically a small-bodied candlestick, often a Doji, indicating indecision in the market. The open and close prices of the second candle are close to each other, signaling a lack of clear direction.
Third Candle (Bearish Candle): The third candle is a large bearish candlestick, closing below the midpoint of the first candle. This confirms the reversal and suggests that the uptrend is losing momentum.
The Evening Star is considered a reliable pattern when it forms at the top of an uptrend, as it signifies that buyers are losing control and that sellers may be taking over.
How to Use the Evening Star Candlestick Pattern in Trading
To effectively use the Evening Star pattern in your trading, it's essential to look for the following criteria:
Uptrend Prior to the Pattern: The Evening Star should occur after a strong uptrend. It is a reversal pattern, so it’s most effective when the market is in a bullish trend.
Confirmation Candle: The third candle, which is bearish, should close below the midpoint of the first bullish candle. This confirms the pattern and the potential for a trend reversal.
Volume: Increased volume during the formation of the bearish candle can add strength to the pattern. A high volume on the third candle suggests a strong bearish momentum.
Advantages of Using the Evening Star Pattern
Predicts Market Reversals: The Evening Star is a reliable pattern for spotting bearish reversals, especially after an uptrend.
Simplicity: The pattern is easy to identify, making it suitable for both beginners and experienced traders.
Effective in Trend Analysis: Combined with other indicators, such as support and resistance levels, the Evening Star pattern can enhance your market analysis and increase the accuracy of your trades.
Conclusion
Understanding what is a candlestick chart and how to read candlestick patterns is essential for any trader. The Evening Star Candlestick Pattern is a powerful tool for identifying potential trend reversals in the market. By recognizing this pattern and understanding its significance, you can better predict market direction and make more informed trading decisions. Whether you're a beginner or an experienced trader, learning to identify and use the Evening Star pattern can enhance your trading strategy and improve your overall success.
#what is a candlestick chart#how to read candlestick chart#how to read a candle chart#what are candlestick charts used for#candlestick chart examples
0 notes
Text
Head and Shoulders Turned Upside Down – A Bullish Reversal Pattern Explained
Charting patterns come in many forms. Some are complex, others straightforward—but all help traders read market movements. One such pattern is the inverted head and shoulders, a powerful signal that a downtrend may be ending.
Inverse Head and Shoulders Pattern
Also known as:
Inverse Head and Shoulders
Reverse Head and Shoulders
Head and Shoulders Inverted
This pattern can appear in forex, stocks, crypto, and commodities.
#Inverse Head and Shoulders Pattern#Technical Analysis Patterns#Candlestick Chart Patterns#Volume Confirmation in Trading#Forex Chart Patterns
0 notes
Text
Fundamentals of Forex Market (₹999)
Start your journey in currency trading with a comprehensive module covering forex basics, market dynamics, key terminology, and chart reading without getting overwhelmed. Ideal for beginners seeking clarity and direction.
#Best Trading App#Best Trading App in India#Trading Course app#Forex and Crypto Trading App#Forex Trading for Beginners#Price Action Trading Strategy#How to Learn Trading#Free Online Trading Courses#Stock Market Trading Courses#Trading On The Stock Market#Financial Markets In India#How to Learn Stock Market Trading#Currency Exchange Trading#Best Forex Trading Platforms in 2024#Price Action Trading#Open a Forex Trading Account#Basic to Advance Trading#Technical Analysis in Forex Trading#Best Technical Indicator for Trading#Basics of Indian Stock Market#Paper Trading Simulator#Bearish Candlestick Patterns#Best Charting Software in India#Smart Money Concepts (SMC)#Objectives of Fundamental Analysis#Financial Markets in India#Bullish Candlestick Patterns#Double Top Chart Pattern#Free Price Action Trading PDF#Ascending Triangle Pattern
1 note
·
View note
Text
Nifty Forecast Tomorrow: Expert Predictions and Market Trends You Should Know
If you're looking for the most accurate Nifty forecast for tomorrow, you're not alone. Every day, thousands of traders and investors closely follow the Nifty 50 index, aiming to anticipate the next market move and get a step ahead of the volatility. In this post, we break down key technical levels, current sentiment, and expert-backed strategies to help you prepare for the trading session ahead.
📊 What Is the Nifty 50 and Why Its Forecast Matters
The Nifty 50 is India’s flagship stock market index, representing 50 of the largest and most liquid companies listed on the National Stock Exchange (NSE). It's a key barometer for market trends and investor confidence.
A well-researched forecast for Nifty 50 movement tomorrow can be highly valuable for:
Intraday traders planning entry and exit points.
Swing traders timing short-term opportunities.
Investors staying aligned with macroeconomic trends.
🔍 Nifty 50 Technical Analysis for Tomorrow
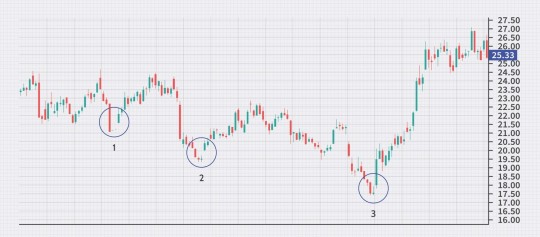
1. Key Support and Resistance Levels
Based on today’s market close and recent trading patterns:
Support zones: 22,300 and 22,180
Resistance zones: 22,500 and 22,640
If the index breaks above 22,500 with momentum, it may push higher. A drop below 22,180 could shift sentiment toward bearish.
2. Moving Averages
Nifty is trading above both 20-day and 50-day EMAs, suggesting the trend remains positive.
The Relative Strength Index (RSI) is around 58–60, reflecting healthy momentum without overbought conditions.
3. Candlestick Pattern
Today’s session showed indecision, forming a neutral candle. A breakout candle or a bullish engulfing pattern tomorrow would be a strong confirmation of upward momentum.
🗣️ Market Sentiment & Global Cues
Sentiment in the market remains cautiously optimistic. Some of the key global and domestic factors influencing the Nifty forecast tomorrow include:
U.S. Federal Reserve commentary on interest rates
Movement in crude oil prices
INR/USD exchange rate fluctuations
Institutional investor activity (FII/DII inflow/outflow)
FIIs were net buyers today, a signal that global appetite for Indian equities remains intact — at least for now.
📈 Expert Outlook: Nifty Forecast for Tomorrow
Analysts are leaning towards a mild bullish trend continuing into tomorrow’s session, assuming no sudden negative cues overnight. That said, volatility is likely to spike during the first hour of trade.
Here are some smart trading reminders:
Don’t chase early price gaps.
Stick to well-defined stop losses.
Wait for volume confirmation, especially near breakout zones.
💡 Tip: A breakout above 22,500 on strong volume could provide a high-probability setup for short-term trades.
🛠️ Action Plan for Traders
Intraday Traders
Observe the first 15–30 minute range for market direction.
Indicators like MACD, RSI, and volume spikes are crucial for timing entries.
Use a trailing stop-loss strategy once in profit.
Positional Traders
Consider adding long positions above 22,500 with upside targets around 22,800.
If Nifty dips below 22,180, reassess and wait for a base to form before entering.
🔗 Live Updates and Tools
Want more granular data? For real-time charts, key levels, and analyst videos, check out the full Nifty 50 forecast and live analysis page.
📬 Final Thoughts
A well-informed Nifty prediction for tomorrow helps traders cut through the noise and take calculated risks. No forecast is 100% guaranteed, but combining technical signals, market sentiment, and global cues can give you an edge.
Trade smart. Stay disciplined. And always have a plan.
#nifty forecast tomorrow#nifty 50 prediction#nifty 50 forecast#nifty technical analysis#nifty trend tomorrow#share market forecast#stock market prediction#nifty outlook#nifty analysis#nifty trading strategy#nifty support and resistance#nifty levels tomorrow#intraday trading tips#stock market india#nifty market trend#nifty tomorrow analysis#nifty movement prediction#NSE forecast#indian stock market forecast#market trend analysis#technical analysis nifty 50#nifty 50 chart#fii dii data analysis#stock market update today#trading view nifty#nifty live updates#nifty chart pattern#nifty stock tips#nifty breakout strategy#nifty candlestick analysis
0 notes
Text
Top 8 Must-Know Chart Patterns in Technical Analysis | NTA®
Discover the 8 essential chart patterns every trader should master. Enhance your trading strategy with insights into market trends and price action analysis.
0 notes
Text
Unlocking the Power of TradingView: The Best Charting Platform for Traders
A sleek and modern TradingView dashboard displaying real-time charts, candlestick patterns, and powerful technical indicators like RSI and MACD. Are you looking for a powerful, easy-to-use charting tool to enhance your trading? Whether you’re a beginner or an experienced trader, TradingView is one of the best platforms for technical analysis, market insights, and strategy building. And here’s…
#Affiliate Marketing#Automated trading#Candlestick patterns#Crypto trading#Day trading#Forex trading#Investing#MACD#Market analysis#Online trading#passive income#RSI#Stock market#Swing trading#Technical analysis#Trading alerts#Trading bots#Trading platform#Trading signals#Trading strategies#Trading tools#TradingView#TradingView charts#TradingView indicators#TradingView plans#TradingView pricing#TradingView review
0 notes
Text
Candlestick charts are like storybooks for stock market trends, showing price movements in a simple yet powerful way. This guide breaks down how to read these charts, making it easy for anyone to understand. By the end, readers will feel confident in spotting market patterns and making informed decisions.
0 notes
Text
Understanding Candlestick Charts: A Key Tool for Traders

If you’ve ever looked at a stock trading platform or financial news channel, you’ve probably seen a chart filled with colorful, vertical bars called candlesticks. These aren’t just random decorations—they’re powerful tools for traders to analyze stock movements and make informed decisions. But what exactly are candlestick charts, and how can you use them to improve your trading game? Let’s dive into the world of candlesticks and explore their secrets!
0 notes
Text
In stock market, traders rely on various share market techniques and tools to make informed decision based on the movements of price. One of the important techniques in technical trading is the Candlestick Pattern. Candlestick indicates the price movement of an asset over a specified period of time. The body of each candlestick is constructed from wicks (also known as shadows) at both ends, shows the open, high, low, and close for that particular time period. In order to help technical traders make predictions about the future movements and price patterns of the underlying asset, candlestick patterns evaluate one or more candlesticks. Before utilizing more complex patterns, it’s necessary that you understand the fundamentals of candlestick charts. Our team of experienced traders can offer valuable insights into different trading techniques. By utilizing our module for Candlestick Charts for Intraday Trading, Traders Platform can provide you a competitive advantage and educate you while you trade. Enroll in our trading course, designed for both beginners and expert traders, to learn more about technical trading and stock market strategies.
0 notes
Text
youtube
#youtube#forextrading#xauusd scalping#xauusd#gold trading#gold scalping#xauusd price#golden trio rp#forexcommunity#forexcharts#candlestick#chart patterns
0 notes
Text
Forex Basics and Profit Plan for Jaipur
Learn key forex concepts, develop a clear trading plan, manage risks, and start your profitable forex journey in Jaipur confidently.
SOCIAL MEDIA LINKS https://x.com/profithill21263https://www.youtube.com/@edu.profithillshttps://www.facebook.com/Edu.profithills/https://www.linkedin.com/company/edu-profithills/https://www.instagram.com/edu.profithills/?hl=enhttps://in.pinterest.com/profithillseducation/
#Best Trading App#Best Trading App in India#Trading Course app#Forex and Crypto Trading App#Forex Trading for Beginners#Price Action Trading Strategy#How to Learn Trading#Free Online Trading Courses#Stock Market Trading Courses#Trading On The Stock Market#Financial Markets In India#How to Learn Stock Market Trading#Currency Exchange Trading#Best Forex Trading Platforms in 2024#Price Action Trading#Open a Forex Trading Account#Basic to Advance Trading#Technical Analysis in Forex Trading#Best Technical Indicator for Trading#Basics of Indian Stock Market#Paper Trading Simulator#Bearish Candlestick Patterns#Best Charting Software in India#Smart Money Concepts (SMC)#Objectives of Fundamental Analysis#Financial Markets in India#Bullish Candlestick Patterns#Double Top Chart Pattern#Free Price Action Trading PDF#Ascending Triangle Pattern
1 note
·
View note
Text
Bitcoin trading strategies for beginners
Introduction: Welcome to the exciting world of Bitcoin trading! As a beginner, stepping into the realm of cryptocurrency trading can feel like diving into the deep end of a vast ocean. However, with the right knowledge and strategies, you can navigate these waters with confidence and potentially reap rewarding profits. In this guide, we'll explore some essential Bitcoin trading strategies tailored specifically for beginners.

Understanding Bitcoin Trading: Before diving into strategies, let's grasp the basics of Bitcoin trading. Unlike traditional stocks or commodities, Bitcoin operates 24/7 on global cryptocurrency exchanges. The goal of trading is to buy Bitcoin at a low price and sell it at a higher price to make a profit. However, the volatile nature of cryptocurrency markets requires careful planning and execution.
Key Concepts to Know:
Market Analysis: Before making any trades, it's crucial to analyze market trends, news, and indicators. Fundamental analysis involves assessing the underlying factors influencing Bitcoin's price, while technical analysis involves studying historical price charts and patterns.
Risk Management: Cryptocurrency markets can be highly unpredictable, so it's essential to manage your risk effectively. This involves setting stop-loss orders to limit potential losses and diversifying your investment portfolio.
Emotional Discipline: Trading can evoke strong emotions, such as fear and greed. Beginners often fall into the trap of making impulsive decisions based on emotions rather than logic. Maintaining emotional discipline is key to successful trading.
Now, let's delve into some beginner-friendly Bitcoin trading strategies:

HODLing (Hold On for Dear Life): This strategy involves buying Bitcoin and holding onto it for the long term, regardless of short-term price fluctuations. HODLing is based on the belief in Bitcoin's long-term potential as a store of value and hedge against inflation. It's a straightforward strategy suitable for beginners who prefer a hands-off approach to trading.
Dollar-Cost Averaging (DCA): DCA is a strategy that involves investing a fixed amount of money in Bitcoin at regular intervals, regardless of its price. By spreading out your purchases over time, you can reduce the impact of market volatility and potentially lower your average purchase price. DCA is ideal for beginners who want to gradually build their Bitcoin holdings without worrying about timing the market.

Swing Trading: Swing trading involves capitalizing on short to medium-term price fluctuations in the market. Traders aim to buy Bitcoin at support levels (when prices are low) and sell at resistance levels (when prices are high). This strategy requires a basic understanding of technical analysis and the ability to identify entry and exit points on price charts.
Trend Following: This strategy involves identifying and following the prevailing trend in the market. Traders buy Bitcoin when the trend is bullish (prices are rising) and sell when the trend reverses or becomes bearish (prices are falling). Trend following relies heavily on technical analysis indicators such as moving averages and trend lines.
Arbitrage: Arbitrage involves exploiting price differences between different cryptocurrency exchanges. Traders buy Bitcoin from one exchange where the price is lower and sell it on another exchange where the price is higher, pocketing the price difference as profit. While arbitrage opportunities may be scarce, they can be lucrative for skilled traders with access to multiple exchanges.
Conclusion: As a beginner in Bitcoin trading, it's essential to start with a solid foundation of knowledge and adopt a cautious approach. Experiment with different strategies, but remember to start small and gradually increase your exposure as you gain experience. Keep learning, stay updated on market developments, and don't hesitate to seek advice from seasoned traders. With time and practice, you'll be well on your way to mastering the art of Bitcoin trading. Happy trading!
#“Bitcoin graph showing upward trend.”#“Person analyzing Bitcoin market on laptop.”#“Bitcoin trading chart with candlesticks.”
0 notes