#chartanalysis
Explore tagged Tumblr posts
Visit Tumblr Blog
Explore Tumblr blogs with no restrictions, modern design and the best experience.
Last Seen Tumblr Blogs


Fun Fact
Tumblr has a low social media market share in South America.
Text


Julia Fox
She is a Shravana Sun (gifted) truly, much like Billie Eilish. You can see it in the eyes, that psychic, 'weirdo', 'rejected' 'freak' kid. She talks a lot in her book about feeling 'different' from everyone else, unique and strange. With Shravana natives, we see the gifted child (Harry Potter vibes)
Her Bharani Moon gives her a seductive, hypnotic, sultry, Venusian beauty. She loves fashion, like a typical Venusian, and has a hedonistic, intense, extremist side. We know she was a Dominatrix in her young adult life, which is perfectly in line with sensual Bharani Nakshatra (it's symbol being the literal Yoni)
Her Mercury is in Purva Ashadha, and she does have a very soft, beautiful writing (and speaking) style. Mercury rules over how we speak, write, communicate and think, her mind is beautiful really, and so is her speech.

I can definitely see her sensual Bharani Moon in a lot of photos of her online; lollipops, sugar, ice cream. Venus (Shukra) is oozing out of every pore in her body. She does give off a very seductive energy, and has an intoxicating, Aphrodite-like aura.

Bharani is ruled by Yama, The God of Death, and she does talk a lot in her book about sewersidel thoughts. She overdosed twice. She almost died, she's definitely 'tasted' death. This is in line with Vedic Mythology. This is directly from her book: "My new friends and I hold séances in my bedroom, invoking the spirit of the deceased front man of my favorite band, Nirvana. I tape a picture of Kurt Cobain on my wall and fantasize about dying so I can join him on the other side. “It’s better to burn out than to fade away,” he wrote in his suicide note." -Julia Fox
Her Ascendant is in Ardra Nakshatra (ruled by Rudra, The Storm God, and The Tear Drop), she's lived an extremely traumatic and tumultuous life. She does have a bit of Taylor Swift energy though (Also Ardra influenced), whereby she constantly mentions 'not needing men', and is a radical feminist). Ardra Nakshatra is also very into fashion, due to Rahu here creating obsession and craving, a touch of materialism. (Peep the black and white Fabric - Coco Chanel vibes and the leopard print too!) From her book: "The faces on the missing posters stare blankly back at me. There are so many all stacked on top of one another, each telling a devastating story. At night, I lie in bed and wonder if every plane I hear flying overhead is actually a bomb. I grip my pillow over my ears and brace for impact."


In my humble opinion, she is extremely iconic, and still too underrated. I believe she will continue to grow further into her fame - she's got a very socialite 11th House Moon, (fame, friendships and the spotlight).
Her life purpose (Rahu) is in Shravana (The Moon); a huge part of her destiny in this lifetime was to become a mother. Chandra = Mother / Moon. We know that she writes and talks a lot about her son, and how he changed her entire life and is now her whole world.

A lot of Moon influenced women, Venususians and Rahu girls will fall in love with and greatly look up to Julia Fox. (Shravana + Bharani, Purva Phalguni) as well as many Ardra Natives. Gen Z in particular, I can see a ton of women with those placements feeling inspired by her, feeling like her story is home to them, feeling like they understand her, and she understands them.
Overall, I love Julia Fox and her energy, and just wanted to share this with you all. As a Bharani Sun woman myself, I feel so close to her energetically and spiritually (and I'm sure many of you out there do too!)
#juliafox#downthedrain#kanyewest#vedicastrology#astronotes#astroanalysis#chartanalysis#venus#bharani#shravana
92 notes
·
View notes
Text

Technical and Graphical Analysis
This technical and graphical analysis ebook lays down...
Bullish Candlestick & Chart patterns Bearish Candlestick & Chart patterns What are Technical Indicators & Candlesticks? How to use Indicators like SMA, Pivot Points, RSI, etc. Bilateral Patterns that can go in either direction. How to draw Support and Resistance? Trade the bounce and the break
And much more...
Educational content with high-level methods for beginners. The profits can be high with the right tools and knowledge. Get access to this ebook forever. Access it offline, anytime, anywhere. Once downloaded, the purchase can't be refunded.
File: PDF Size: 6,91 MB Pages: 460
15 E-BOOKS -- 460 PAGES
#technicalanalysis#graphicalanalysis#markettrends#tradingstrategies#investsmart#chartpatterns#datadriven#financialinsights#stockmarketanalysis#investingwisely#technicalindicators#marketanalysis#tradingtips#financialfreedom#investmentstrategies#chartanalysis#technicalcharts#marketresearch#profitpotential#smartinvesting#daytrading#forextrading#priceaction#riskmanagement#swingtrading#tradingcommunity
0 notes
Text
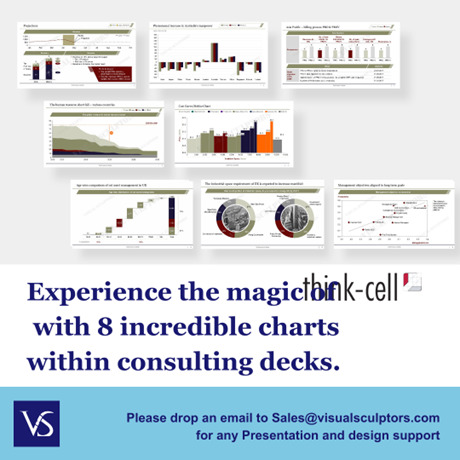
Comparing Data Effectively: When to Choose Clustered Column Charts Over Simple Bar Charts
Data Visualization: Top Inquiries Answered
1.What are the advantages of clustered column chart?
Clustered column charts effectively compare multiple categories across different groups. They allow for easy visualization of data trends, highlight variations between categories, and facilitate side-by-side comparisons. Their clear representation helps in quickly identifying patterns and differences, making them useful for presentations and reports where clarity and comparison are essential.
2. What are the disadvantages of clustered bar charts?
Disadvantages of clustered bar charts include difficulty in comparing values across categories due to overlapping bars, potential clutter if too many categories are included, and challenges in interpreting data when bars are closely spaced. They can also become less effective with large datasets, leading to visual confusion and making it hard to discern trends or differences.
3. What is the difference between clustered bar chart and simple bar chart?
A simple bar chart displays individual categories with bars representing their values. A clustered bar chart, on the other hand, groups bars by category and allows for comparison of multiple datasets within the same category. Each group shows different data sets side by side, making it easier to compare values across categories.
4. When to use a clustered column chart?
Use a clustered column chart when you want to compare multiple categories across different groups. It's ideal for displaying discrete data, highlighting differences and trends among categories, and allowing easy comparison of values side by side. This type of chart is effective for visualizing data over time or across different categories and subcategories.
5. How do I add a line to a clustered column chart?
To add a line to a clustered column chart, first create your column chart. Then, select the data series you want as a line. Right-click and choose "Change Series Chart Type." Select "Line" for that series and ensure it's on the same axis if needed. Adjust formatting as desired for clarity and visibility.

Visit: VS Website See: VS Portfolio
#DataVisualization#ClusteredColumnChart#BarChart#ChartAnalysis#DataPresentation#VisualData#ChartComparison#DataInsights#ExcelCharts
0 notes
Text

Ready to take your trading skills to the next level? Gain a foothold in intraday
trading and unlock new opportunities with the right strategies
Take Control of Your Financial Future
Join Magnum Educorporates and master the art of stock market trading!
#TradingSkills#FinancialSuccess#StockMarketEducation#MagnumEducorporates#InvestSmart#LearnStockTrading#TradingForBeginners#GrowYourWealth#StockMarketIndia#IntradayTrading#ChartAnalysis#FinancialGrowth#TradingJourney#InvestingMadeEasy#SmartInvestments!#StockMarketSuccess#TradingTips"
0 notes
Text
How I lost 53.5K playing risky trades 💸😱… but then I started learning from pros. Made 15% copying successful traders, and now I've built my own Buy, Sell, and Stop Loss script with Pine Script 📈💪. Turning mistakes into opportunities!
#TradingJourney#LostMoney#LearnAndGrow#TradingView#PineScript#ChartAnalysis#EasyChartSignals#FromZeroToHero#Investing#LessonsLearned
1 note
·
View note
Text
LINEAR VS. LOGARITHMIC CHARTING: A VISUAL COMPARISON

Linear charts display equal intervals, showing absolute changes, while logarithmic charts emphasize percentage changes, making earlier growth periods more visible. For example, Bitcoin's 2017 surge is clearer on a log chart than on a linear one, which can compress such movements.
0 notes
Text
Days Count in Point & Figure Charts: A Comprehensive Indicator Overview
The "No of Days" in a Point & Figure (P&F) chart indicator counts the number of trading days since the last signal change. It helps gauge the duration of trends and consolidate patterns for better trading decisions.
0 notes
Text
Decoding Crypto Charts: Your Economic Weather Forecast for Smart Trading! 📈🌐
Just like checking the weather before a journey, understanding crypto charts empowers traders to navigate the financial climate wisely🚀💡
0 notes
Text
"Take Control of Your Trading Journey with ChartBuddy: Unlocking Reliable Buy/Sell Signals and Advanced Chart Analysis." . . .
Follow + Like + Share + Comment
Follow us for daily tips and setups Turn on post notifications
Follow for more update @chartbuddyofficial
#forex#stockmarket#nifty#bitcoins#crypto#technicalanalysis#tradingcards#tradingtips#tradingmemes#forextrading#success#business#bullishtrend#chartanalysis#stoploss#traders#trademarketing#sharemarket#riskmanagement#riskanalysis#financialgrowth#startupindia#sensex#explorepage#chartbuddyofficial#investing#trader#forextrader#money#stocks
0 notes
Text
The Importance of Legends in Line Graphs: Enhancing Clarity in Data Representation
Data Visualization: Key Questions Explained
1.Which chart is best for analysis?
The best chart for analysis depends on the data and the insights you want to convey. Bar charts are effective for comparing categories, line charts are great for trends over time, pie charts can show proportions, and scatter plots are useful for relationship analysis. Choose the chart type that best represents your data and highlights key points.
2. What is the limitation of line charts?
A limitation of line charts is that they can be misleading when displaying data with significant fluctuations or irregular intervals. They may oversimplify complex data trends, leading to misinterpretation. Additionally, line charts are not effective for comparing multiple datasets at once if they overlap, making it difficult to discern individual trends clearly.
3. What is the application of line graph?
Line graphs are used to display data points over time, showing trends and changes. They effectively illustrate relationships between variables, making it easier to compare information and identify patterns. Common applications include tracking sales performance, monitoring temperature changes, and visualizing stock market trends. Overall, line graphs aid in understanding data dynamics and making informed decisions.
4. What are the characteristics of a line graph?
A line graph displays data points connected by straight lines, showing trends over time or continuous data. Key characteristics include an x-axis (horizontal) and y-axis (vertical), which represent different variables, the use of scales to quantify data, and the ability to easily visualize changes, patterns, and relationships within the data. It often includes markers for data points.
5. What is a legend in a line chart?
A legend in a line chart is a key that explains what each line represents. It typically includes labels or colors corresponding to different data series, helping viewers understand the chart's information briefly. The legend is essential for interpreting the data accurately, especially when multiple lines are displayed.
Visit: VS Website See: VS Portfolio
#DataVisualization#LineChart#ChartAnalysis#GraphCharacteristics#StatisticalAnalysis#LegendInCharts#DataPresentation#InformationDesign
0 notes
Video
youtube
Veeva Systems: Is This Pullback Just the Beginning of a New Trend? #VEEV...
#youtube#VEEV VeevaSystems HealthcareAI USstocks GrowthStocks TechnicalAnalysis Rhythmix SwingTrading MidTermSetup ChartAnalysis
0 notes
Text
youtube
Kostenlose DAX-Future-Analyse – Jetzt auf LWC Management!
In diesem Video präsentieren wir Ihnen eine ausführliche Analyse des DAX-Futures, basierend auf den Regeln der Markttechnik und der Elliott-Wellen-Theorie. Erfahren Sie alles über aktuelle Unterstützungs- und Widerstandsbereiche, Marktbewegungen und Trading-Setups für Ihre nächste Handelsentscheidung!
Besuchen Sie unsere Website für täglich kostenlose Analysen: ➡️ https://lwcmanagment.de
Handeln Sie mit einem zuverlässigen Broker! Unser Partner Vantage bietet Ihnen professionelle Handelsbedingungen, niedrige Spreads und die Möglichkeit, auch mit Kryptowährungen einzuzahlen. Perfekt für erfahrene Trader und Einsteiger gleichermaßen. Mehr erfahren: ➡️ https://vigco.co/7VfUN3
⚠️ Rechtlicher Hinweis: Wenn Sie den obigen Link nutzen, erhalten wir eine Provision. Dies hilft uns, weiterhin kostenlose Inhalte wie diese anzubieten – für Sie entstehen dabei keine zusätzlichen Kosten.
Inhalt des Videos:Aktuelle Marktlage und technische Analyse Elliott-Wellen-Betrachtung Trading-Setups mit Risikomanagement Prognosen und Ausblick auf die Handelswoche
📌 Abonnieren Sie unseren Kanal für weitere tägliche Analysen, Marktupdates und hilfreiche Trading-Tipps!
Disclaimer: Dieses Video dient ausschließlich zu Informationszwecken und stellt keine Finanzberatung dar. Der Handel mit Hebelprodukten wie Futures birgt erhebliche Risiken. Verluste können das eingesetzte Kapital übersteigen. Bitte handeln Sie verantwortungsbewusst.
Copyright: © 2025 LWC Management. Alle Rechte vorbehalten.
#DAXFuture#ChartAnalysis#DAX30#TradingSetup#TechnicalAnalysis#StockMarket#DayTrading#IntradayTrading#Ichimoku#RSI#MACD#SupportAndResistance#TradingStrategy#FinancialMarkets#ForexTrading#FuturesTrading#StockAnalysis#MarketUpdate#DailyTradingAnalysis#InvestingTips#Youtube
0 notes
Text
youtube
Impulse Moves? Death Candles? I Scalp Crypto For INSANE Profit! Explore the potential outcomes of impulse moves in trading! We analyze chart patterns, showcase successful trades using the death candle strategy, and reveal scalping results with quick profits. Learn how to gamble wisely and make 0.5 SOUL in seconds! #ImpulseTrading #DeathCandleStrategy #ScalpingProfits #CryptoTrading #StockMarketAnalysis #TradingStrategy #ChartAnalysis #DayTrading #FinancialFreedom #TradingTips via YouTube https://www.youtube.com/watch?v=Q6MTBh2lZ0c
0 notes
Text
LINEAR CHART

A linear chart represents data with equal spacing between values on the y-axis, where a move from 50 to 51 is displayed the same as a move from 100 to 101, despite the difference in percentage change.
#tradingstrategies#LinearChart#DataVisualization#ChartAnalysis#StockCharts#TradingCharts#FinancialAnalysis
0 notes
Text

Just another Day @ the office #tradinglife#daytrader#forextrading#stockmarket#crypto#investing#tradercommunity#financialfreedom#makemoneyonline#tradingsetup#technicalanalysis#tradingstrategies#swingtrading#daytrading#cryptotrading#options#stocktrading#pennystocks#chartanalysis#tradinggoals#bullmarket#bearmarket#tradetowin#tradeideas#forexsignals#stocksignals#cryptosignals#riskmanagement#traderlifestyle#tradingjournal#tradepsychology#wallstreet#blockchaintrading#profitablesetups#stockwatchlist#cu
1 note
·
View note
Text
https://saptarishisshop.com/karma-rebirth-and-jyotish-by-o-d-mande/
Karma Rebirth and Jyotish by O D Mande
In this article, O D Mande describe the concept of Karma and Reincarnation with example charts of Jawahar Lal Nehru, Indira Gandhi, Amitabh Bachchan, & Lahiri Mahasaya. The writer feels understanding one’s karma ought to be the primary purpose of Jyotish, the timing of materialistic events like marriage, childbirth, professional gains, etc being secondary.
#vedicastrology#karma#rebirth#jyotish#astrology#JawaharLalNehru#IndiraGandhi#AmitabhBachchan#LahiriMahasaya#chartanalysis#saptarishisastrology
0 notes