#php apm monitoring
Explore tagged Tumblr posts
Visit Tumblr Blog
Explore Tumblr blogs with no restrictions, modern design and the best experience.
Last Seen Tumblr Blogs


Fun Fact
After the announcement of the deal with Yahoo!, there were 170K signatures of unhappy Tumblr users petitioning to prevent the sale in 2013.
Text
Mastering PHP Application Monitoring: Best Practices for 2025
Introduction
PHP powers over 75% of the web today, making it one of the most widely used server-side languages. From WordPress sites to complex Laravel applications, developers rely on PHP to build fast, scalable solutions. But with growing complexity comes the need for real-time visibility and control. This is where application monitoring plays a critical role.
Monitoring isn't just about tracking uptime, it's about understanding how your code behaves in production, identifying slow queries, spotting memory leaks, and proactively fixing issues before users even notice them. In this blog, we’ll explore the best practices for PHP application monitoring and how you can implement them effectively.
12 Best Practices for PHP Application Monitoring
1. Upgrade to PHP 8+
Running on the latest version ensures better performance, error handling, and compatibility with modern tools. PHP 8’s JIT compiler alone can improve execution speed significantly.
2. Follow PSR Coding Standards
Using standards like PSR-3 (logging) and PSR-4 (autoloading) leads to cleaner, more structured code that monitoring tools can process more efficiently.
3. Use Descriptive Functions and Logs
Functions like processData() aren’t helpful when debugging. Instead, use meaningful names like generateMonthlyReport() and ensure log messages are clear and contextual.
4. Leverage Popular Frameworks
Frameworks such as Laravel, Symfony, or CodeIgniter come with built-in structure and middleware support, which integrate smoothly with APM solutions.
5. Manage Dependencies with Composer
Locking versions through Composer ensures consistent environments across staging and production, reducing unexpected errors during deployment.
6. Add Caching Layers
Implement opcode, database, and object caching to reduce server load and accelerate response times.
7. Set Up Smart Alerts
Avoid alert fatigue. Configure alerts for thresholds that truly matter like a sustained increase in response time or sudden spike in 500 errors.
8. Conduct Security Monitoring
Monitor failed login attempts, suspicious user behavior, or error messages that might indicate vulnerabilities.
9. Use CI/CD Tags for Deployments
Tagging releases helps correlate performance changes with specific deployments, making it easier to roll back or debug regressions.
10. Keep Monitoring Agents Updated
Regularly check for updates to ensure compatibility with your PHP version and frameworks.
11. Profile Real User Traffic
Use profiling tools in production to identify bottlenecks during peak usage not just in local or staging environments.
12. Optimize SQL Queries
Poorly indexed or long-running queries can slow down your app. APM tools can pinpoint these with exact timings and stack traces.
Why Choose Atatus for PHP Monitoring?
Atatus is a full-stack APM and error-tracking platform that offers deep insights into PHP applications. Here’s why it stands out:
Real-time performance monitoring for PHP 7.x and 8.x apps
Transaction tracing down to database queries, external calls, and slow functions
Easy integration with Laravel, Symfony, CodeIgniter, and other frameworks
Custom alerting, dashboards, and logs in one unified interface
Error tracking with stack traces and user context to speed up debugging
Atatus helps developers detect issues early, optimize code paths, and ensure smooth performance at scale.
Conclusion
Effective monitoring is key to building fast, stable, and scalable PHP applications. By following these best practices and choosing the right tool like Atatus, you can gain full visibility into your app's performance, reduce downtime, and deliver a seamless user experience.
Whether you're managing a startup project or an enterprise-grade application, observability isn't optional, it's essential. Implementing a strong monitoring strategy today will lead to fewer production issues, faster debugging, and more confident development tomorrow.
Originally published by https://www.atatus.com/
#php monitoring#php monitoring best practices#What is PHP Monitoring#php applications#PHP Application Monitoring#PHP apm#php application performance monitoring tools#php monitoring solution#php application monitoring tools#php application performance#php performance monitoring tool#php monitoring tools#php performance monitor#php monitor#apm for php#php apm monitoring#php monitoring tool#php monitoring software#monitor php application performance#apm php#php application monitoring tool#php application performance mangement#monitoring php performance#php app monitoring#php distributed tracing
0 notes
Text
Exploring the Power SCADA Market: Trends, Drivers, and Emerging Opportunities in Energy Management - UnivDatos
According to a new report by UnivDatos Market Insights, the Power SCADA Market is expected to reach USD ~3.5 billion by 2032 by growing at a CAGR of ~5.2%. Currently, due to the advancement in technology, companies are always on the lookout for ways to automate and enhance operations as well as industrial procedures. Ever since the discovery of computers and the World Wide Web, machines have slowly started installing computing technologies into their structures. The emergence of these systems in the traditional existing structure can be considered as the start of a new period in the Industrial Revolution. As with most industries, power systems have developed to cater to the needs of investors, consumers, and operators in the last few decades. Enterprise resource planning solutions: the main impact on power systems describes that automation has been a result of the implementation of these solutions. Consequently, power systems started to utilize SCADA systems in the last part of the twentieth century. However, before discussing SCADA systems in detail, its history must be discussed.
Request To Download Sample of This Strategic Report - https://univdatos.com/get-a-free-sample-form-php/?product_id=68085&utm_source=LinkSJ&utm_medium=Snehal&utm_campaign=Snehal&utm_id=snehal
SCADA Systems in Oil and Gas: Driving Innovation and Efficiency in the Digital Age
In the oil and gas industry, supervisory control and data acquisition Scada has emerged as a revolutionary concept that is revolutionizing operations across the value chain. Cutting across the upstream, middle, and downstream, this article provides a detailed analysis of such systems and relates the development and design of SCADA systems to their usage. SCADA systems in upstream invents real-time well monitoring, production optimization, and remote operation which increases the output and efficiency to a greater level. Midstream applications on the other hand aim at optimizing the use of pipelines with features such as maintenance prediction, improved leakage detection, and pipeline flow. Through automated quality assurance, energy consumption, and process control, SCADA systems can revolutionize the climate in refineries profoundly. Of course, some challenges come with system integration, and in the case of SCADA, these include problems encountered in data management, cybersecurity issues, and issues of integration with legacy systems. Besides, looking at new developments capable of enhancing the functionalities of SCADA, this study considers edge computing, digital twins, AI, machine learning integration, and 5G. Using SCADA, the oil and gas industry can be made efficient, safe, and innovative. The ensuing analysis of SCADA implementation lessons and impediments underlines that companies becoming integrated with the new technologies while also overcoming key implementation challenges will be best placed to thrive in the challenging, competitive, and complex energy marketplace of the future. Notably, this adoption has been especially prominent in regions with well-established oil and gas infrastructure such as North America and Europe; these two regions account for over 60% of the SCADA market in the industry.
Several significant themes have characterized the development of SCADA systems in the oil and gas industry:
Enhanced Integration: Modern SCADA systems are integrating with other business systems rapidly more and more, especially with advanced systems like Asset Performance Management (APM) and Enterprise Resource Planning (ERP). They are no longer the standalone solutions. Due to this integration, operations management is now a broader concept, as evidenced by the enhanced decision-making capacities revealed by 78% of the oil and gas industry players.
Better Cybersecurity: With the more advanced integration in computer networks, SCADA systems usher in cyber security concerns. Therefore, industry consumption of cybersecurity solutions related to SCADA systems has trended upward by 35% each year since 2018.
Cloud Adoption: As of 2021, 62% of oil and gas businesses implement cloud integration in their SCADA systems for their businesses up from 27% in 2016. This has suggested an increase in the trend of converting to cloud-based SCADA solutions.
The cumulative impact of these changes has been unprecedented improvements in the operational efficiency levels. Companies with complex SCADA systems, for example, experience roughly a 15 % reduction in unplanned downtime and a 20 % rise in asset usage. Also, the efficient use of the SCADA system has led to a reduction of the maintenance cost by 30% among some operators due to predictive maintenance.
SCADA ARCHITECTURE: THE NERVOUS SYSTEM OF OIL AND GAS OPERATIONS
The nervous system of industrial operations is made up of a sophisticated network of interconnected components that make up modern SCADA systems in the oil and gas industry. Real-time monitoring, control, and optimization across many, frequently geographically scattered assets are made possible by this complex architecture.
· A case study of one of the leading players in the Eagle Ford Shale indicated that an enhanced SCADA system led to a productivity improvement of approximately 22% and a 35% reduction in Well downtime. The predictive analytical functions of the system allowed for preventive maintenance functions that further reduced cases of random breakdowns.
· This case study is an ideal example to understand how complex SCADA systems can transform the upstream operation. The operator implemented an end-to-end SCADA system with production enhancement algorithms accompanied by real-time well monitoring and teleoperation. The ability of the system to integrate data from one or more sources - surface instruments, downhole sensors, and previous production data was critical to the performance of the system.
· The aspect of the system that provided for maintenance based on predictions of when certain components would degrade had a major influence. It was also reported that the technology used the trends in the performance of equipment data to make estimations on possible equipment failures up to two weeks in advance. Therefore, it became possible to minimize production losses as well as to plan interventions by maintenance teams during planned downtime. In return, the unscheduled downtime was reduced from 12% to 4% enhancing overall production tremendously.
Ask for Report Customization - https://univdatos.com/get-a-free-sample-form-php/?product_id=68085&utm_source=LinkSJ&utm_medium=Snehal&utm_campaign=Snehal&utm_id=snehal
Conclusion
By presenting the details, it can be proposed that the SCADA system can be employed on a greater capacity in power systems to obtain higher performance and reliability along with life span. Equipment data monitoring and especially data acquisition can be very convenient and accurate if power systems are commissioned to SCADA. Today, electrical systems are very highly efficient and smart enough to oversee all the correlated activities and actions, and it would have not been possible without the aid of technology. Thus, the power sector needs to see the need and organize itself to meet the new technical changes.
0 notes
Text
AWS Cloud Monitoring and Optimization Ideal Practices
The venture adoption of Amazon Web Services has actually accelerated over last 3 years among big consumers throughout the globe ranging from manufacturing to highly regulated economic solutions. As large enterprise business adopts AWS as a vital cloud system for their IT systems, it's important to established excellent managed cloud methods for a successful cloud adoption.
Provisioning and also Arrangement Monitoring
One of the key facets of using Cloud infrastructure is to provision as well as set up software to make it useful. We suggest adhering to 3 ideal practices for an effective AWS cloud framework provisioning as well as configuration monitoring.
CloudFormation Templates
You can benefit from AWS CloudFormation service for provisioning your cloud facilities with one click. You can develop base cloud development templates to prepare your AWS accounts for manufacturing, QA and growth objective by configuring proper VPC's and also IAM resources. This will certainly guarantee that every brand-new AWS cloud account will be sterilized based on your enterprise process as well as compliance demands for use.
Managed Settings
You can utilize took care of setting services like AWS BeanStalk and also OpsWorks rather than producing software program configuration for your application using various innovation piles like.NET, JAVA, Python, PHP and so on. This will certainly decrease the DevOps as well as setup management work for your IT groups.

Modern Setup Management
AWS has great assistance for COOK if you are trying to find modern configuration administration of software dependences and setups. You can likewise check out utilizing Ansible for the lightweight arrangement administration at rate and range without expenses.
Develop and also Continual Implementations
Cloud systems bring dexterity via rapid and also on-demand provisioning. Nevertheless, the genuine agility can be knowing when you can take your applications and software adjustments much faster to end users. The adhering to AWS Cloud solutions assist you build and also launch software faster than you could do with standard IT.
Build as well as Test Code Faster
By taking advantage of AWS CodeBuild solution, you can assemble source codes, run test collections as well as prepare software for launch much faster than ever before without bothering with handling the develop pipes and examination automation facilities. This can help you reduce release times dramatically without stressing over the required framework to construct as well as evaluate hundreds of different applications in the venture landscape.
Automate Software Program Release Workflows
AWS CodePipeline solution brings constant assimilation as well as shipment as a service so business can build, test as well as deploy software program applications whenever when there is an adjustment or new code dedicate. This will certainly allow you to rapidly test and supply new attributes and also modules secure by preparing your software application for different atmospheres like PROD, QA and also DEV and so on.
Automate Application Release Release
You can take a look at standard devices like Jenkins or Go.CD or utilize AWS CodeDeploy for automating the software application launches into various settings in a foreseeable means once the software launch packages prepare. This will minimize the manual release process, carry out no downtime deployments as well as can aid you release across numerous web servers in an issue of mins. AWS CodeDeploy collaborates with CodePipeline for implementation automation.
DevOps Automation and also Cloud Procedures Management
As a big business, you will not succeed in cloud journey unless DevOps society as well as automation are key priorities for your teams. The only means to properly manage your business cloud framework will certainly be by allowing your groups to make use of AWS SDK's for your automation. This will certainly surpass provisioning, setup, build and release life cycle to day-to-day operations administration for tracking, security as well as cloud management.
Modern IT Monitoring
Take advantage of contemporary software applications like Datadog for monitoring, New Antique for APM as well as Sumo Reasoning for log management throughout your applications running in cloud framework. You can stream cloud occasions from CloudTrail right into your log monitoring system for centralised presence into every change in your cloud infrastructure.
Trustworthy Security Administration
Taking care of application as well as setup protection is customer obligation in AWS cloud. You can take advantage of tools like TrendMicro, CloudPassage for your server as well as network degree security while making the most of software program from AWS industry for WAF or DDoS protection.
1 note
·
View note
Text
From React to MongoDB: Full Stack Optimization Strategies
Full stack optimization is crucial for ensuring that your software runs smoothly and performs well under heavy load. One of the most important aspects of full stack optimization is identifying and addressing performance bottlenecks. Profiling tools and performance monitoring can help you pinpoint the areas of your application that need the most attention, whether it be slow database queries, unoptimized front-end code, or inefficient back-end algorithms. By focusing on these problem areas, you can make targeted improvements that will have a significant impact on overall performance. In this blog post, we'll take a look at some of the best tools and techniques for identifying and addressing performance bottlenecks in full stack applications, with a focus on the most effective strategies for improving the performance of your software.
Profiling Tools for Identifying Performance Bottlenecks
One of the most important steps in optimizing full stack software is identifying performance bottlenecks that are slowing down your application. Profiling tools allow developers to analyze the performance of different components of their software, such as the front-end, back-end, and database, and pinpoint the areas that need improvement.
There are several types of profiling tools available, including:
CPU profilers: These tools measure the time spent executing different parts of your code and can help identify which functions or methods are taking the longest to execute.
Memory profilers: These tools help you understand how your application is using memory and can identify memory leaks or other issues that are impacting performance.
Performance profilers: These tools measure the performance of your application over time and can help you identify patterns or trends in performance.
Some popular profiling tools for full stack development include:
Chrome DevTools: it's an in-browser tool available in Google Chrome that allows developers to profile front-end performance.
Blackfire: it's a performance monitoring and profiling tool for PHP applications.
Xdebug: it's a PHP extension that provides debugging and profiling capabilities.
Visual Studio Profiler: it's a performance profiling tool for .NET and C++ applications.
By using these tools, developers can get detailed information about how their application is performing and can use this information to make targeted improvements that will have a significant impact on overall performance.
It's important to note that Profiling should be done in a development environment and not in production as it can cause a slowdown in the system. Also, it's recommended to profile your application in different scenarios such as high load, low load and normal load.
For custom software development services Click here .
Performance Monitoring Techniques for Full Stack Application
Performance monitoring is another key technique for optimizing full stack software. Unlike profiling which is used to identify specific performance bottlenecks, performance monitoring is used to track the overall performance of your application over time. This allows developers to identify patterns or trends in performance and make adjustments as necessary.
There are several types of performance monitoring tools available, including:
Application performance management (APM) tools: These tools provide a detailed view of the performance of your application, including metrics such as response time, error rate, and throughput.
Log monitoring tools: These tools allow you to collect and analyze log data from your application, which can be used to identify performance issues or errors.
Server monitoring tools: These tools provide information about the performance of your servers, including metrics such as CPU usage, memory usage, and disk usage.
Some popular performance monitoring tools for full stack development include:
New Relic: it's a cloud-based APM tool that provides detailed performance metrics for your application.
Loggly: it's a cloud-based log monitoring tool that allows you to collect and analyze log data from your application.
Nagios: it's an open-source server monitoring tool that allows you to monitor the performance of your servers and infrastructure.
By using performance monitoring tools, developers can track the performance of their application over time, identify patterns or trends in performance, and make adjustments as necessary to improve performance. These tools also provide detailed information about the performance of your application, which can be used to diagnose and troubleshoot performance issues.
Targeting Problem Areas: Optimizing the Most Critical Components of Your Full Stack
Once you've identified performance bottlenecks and trends in performance using profiling and monitoring tools, the next step is to focus on optimizing the most critical components of your full stack. This means targeting the areas of your application that are having the biggest impact on performance and addressing them first.
For example, if your profiling tool shows that a particular database query is taking a long time to execute, you should focus on optimizing that query first. Similarly, if your monitoring tool shows that your front-end is slow to load, you should focus on optimizing the front-end code to improve the load time.
To target problem areas, you can use several techniques such as:
Reducing the complexity of your code: By simplifying your code, you can make it easier to understand, maintain and optimize.
Caching: Caching can help reduce the load on your back-end by storing frequently used data in memory.
Database optimization: This can include indexing, normalization, and query optimization to improve the performance of your database queries.
Scaling: Scaling can help improve performance by adding more resources to your application, such as additional servers or more powerful hardware.
It's important to remember that optimization is an iterative process, and you may need to repeat the process of profiling, monitoring, and targeting problem areas multiple times to fully optimize your full stack application.
By focusing on the most critical components of your full stack, you can make targeted improvements that will have the biggest impact on overall performance. This will help you improve the performance of your application and make it more responsive and scalable.
For ecommerce software development company Click here .
Using Profiling and Monitoring to Improve Full Stack Performance
Profiling and monitoring are two key techniques for optimizing full stack software. While profiling is used to identify specific performance bottlenecks, monitoring is used to track the overall performance of your application over time. Both techniques can be used together to improve the performance of your full stack application.
By using profiling tools to identify performance bottlenecks, developers can make targeted improvements to specific parts of their application. For example, if a particular database query is taking a long time to execute, developers can use profiling tools to identify the cause of the problem and make optimizations to improve performance.
Performance monitoring, on the other hand, allows developers to track the overall performance of their application over time and identify patterns or trends in performance. By monitoring metrics such as response time, error rate, and throughput, developers can identify areas of the application that need improvement and make adjustments as necessary.
Combining these two techniques can provide a comprehensive view of your application's performance, which can help developers make more informed decisions about how to optimize their application.
For example, Profiling can help you identify the problem areas and monitoring will help you track how these changes are impacting the overall performance of the application. By doing so, developers can make adjustments to their optimization strategy as needed and track the progress of their optimization efforts over time.
It's important to note that profiling and monitoring should be done regularly in the development environment and not in production as it can cause a slowdown in the system. Also, it's recommended to profile your application in different scenarios such as high load, low load and normal load.
Optimizing Full Stack Applications with Profiling and Monitoring: A Practical Guide
Optimizing full stack applications can be a complex and time-consuming process, but by using profiling and monitoring techniques, developers can make it more manageable and efficient.
One of the key steps in optimizing a full stack application is identifying performance bottlenecks and problem areas. Profiling tools can be used to analyze the performance of different components of the application, such as the front-end, back-end, and database, and pinpoint the areas that need improvement. Once the problem areas are identified, developers can focus on optimizing them by using techniques such as reducing the complexity of the code, caching, database optimization, and scaling.
Performance monitoring can also play an important role in optimizing full stack applications. By monitoring the performance of the application over time, developers can identify patterns or trends in performance and make adjustments as necessary. This can include modifying the code, adding more resources, or making other changes to improve performance.
Combining profiling and monitoring can provide a comprehensive view of the application's performance, which can help developers make more informed decisions about how to optimize their application.
It's important to note that optimization is an iterative process, and you may need to repeat the process of profiling, monitoring, and targeting problem areas multiple times to fully optimize your full stack application.
In conclusion, optimizing full stack software is crucial for ensuring that your application runs smoothly and performs well under heavy load. Profiling and monitoring techniques are two key tools that developers can use to identify performance bottlenecks and problem areas, track overall performance, and make targeted improvements to improve performance. By focusing on the most critical components of your full stack, you can make targeted improvements that will have the biggest impact on overall performance.
It's important to remember that optimization is an iterative process, and you may need to repeat the process of profiling, monitoring, and targeting problem areas multiple times to fully optimize your full stack application. Additionally, it's crucial to test your application under load to identify and fix performance issues before they become critical, and to use monitoring and logging tools to diagnose and troubleshoot performance issues.
To take action, Developers should start by identifying the areas of their application that need improvement, and then use profiling and monitoring tools to gather more information about the performance of their application. They can use this information to make targeted improvements that will have the biggest impact on overall performance.
Additionally, developers can also follow best practices, remove unnecessary code, and use efficient algorithms to optimize their code. By following these steps, developers can optimize their full stack software, improve performance, and create a more responsive and scalable application.
I hope you find the information which you have been looking for. For more information or queries regarding any software development services you can contact us.
#business#coding#programming#softwaredevelopment#webdevelopment#softwaredeveloper#it#fullstack#javascript#python#java#technology#tech#react#mongodb
1 note
·
View note
Text
Application Performance Monitoring (APM) can be defined as the process of discovering, tracing, and performing diagnoses on cloud software applications in production. These tools enable better analysis of network topologies with improved metrics and user experiences. Pinpoint is an open-source Application Performance Management(APM) with trusted millions of users around the world. Pinpoint, inspired by Google Dapper is written in Java, PHP, and Python programming languages. This project was started in July 2012 and later released to the public in January 2015. Since then, it has served as the best solution to analyze the structure as well as the interconnection between components across distributed applications. Features of Pinpoint APM Offers Cloud and server Monitoring. Distributed transaction tracing to trace messages across distributed applications Overview of the application topology – traces transactions between all components to identify potentially problematic issues. Lightweight – has a minimal performance impact on the system. Provides code-level visibility to easily identify points of failure and bottlenecks Software as a Service. Offers the ability to add a new functionality without code modifications by using the bytecode instrumentation technique Automatically detection of the application topology that helps understand the configurations of an application Real-time monitoring – observe active threads in real-time. Horizontal scalability to support large-scale server group Transaction code-level visibility – response patterns and request counts. This guide aims to help you deploy Pinpoint APM (Application Performance Management) in Docker Containers. Pinpoint APM Supported Modules Below is a list of modules supported by Pinpoint APM (Application Performance Management): ActiveMQ, RabbitMQ, Kafka, RocketMQ Arcus, Memcached, Redis(Jedis, Lettuce), CASSANDRA, MongoDB, Hbase, Elasticsearch MySQL, Oracle, MSSQL(jtds), CUBRID, POSTGRESQL, MARIA Apache HTTP Client 3.x/4.x, JDK HttpConnector, GoogleHttpClient, OkHttpClient, NingAsyncHttpClient, Akka-http, Apache CXF JDK 7 and above Apache Tomcat 6/7/8/9, Jetty 8/9, JBoss EAP 6/7, Resin 4, Websphere 6/7/8, Vertx 3.3/3.4/3.5, Weblogic 10/11g/12c, Undertow Spring, Spring Boot (Embedded Tomcat, Jetty, Undertow), Spring asynchronous communication Thrift Client, Thrift Service, DUBBO PROVIDER, DUBBO CONSUMER, GRPC iBATIS, MyBatis log4j, Logback, log4j2 DBCP, DBCP2, HIKARICP, DRUID gson, Jackson, Json Lib, Fastjson Deploy Pinpoint APM (Application Performance Management) in Docker Containers Deploying the PInpoint APM docker container can be achieved using the below steps: Step 1 – Install Docker and Docker-Compose on Linux. Pinpoint APM requires a Docker version 18.02.0 and above. The latest available version of Docker can be installed with the aid of the guide below: How To Install Docker CE on Linux Systems Once installed, ensure that the service is started and enabled as below. sudo systemctl start docker && sudo systemctl enable docker Check the status of the service. $ systemctl status docker ● docker.service - Docker Application Container Engine Loaded: loaded (/usr/lib/systemd/system/docker.service; enabled; vendor preset: disabled) Active: active (running) since Wed 2022-01-19 02:51:04 EST; 1min 4s ago Docs: https://docs.docker.com Main PID: 34147 (dockerd) Tasks: 8 Memory: 31.3M CGroup: /system.slice/docker.service └─34147 /usr/bin/dockerd -H fd:// --containerd=/run/containerd/containerd.sock Verify the installed Docker version. $ docker version Client: Docker Engine - Community Version: 20.10.12 API version: 1.41 Go version: go1.16.12 Git commit: e91ed57 Built: Mon Dec 13 11:45:22 2021 OS/Arch: linux/amd64 Context: default Experimental: true
..... Now proceed and install Docker-compose using the dedicated guide below: How To Install Docker Compose on Linux Add your system user to the Docker group to be able to run docker commands without sudo sudo usermod -aG docker $USER newgrp docker Step 2 – Deploy the Pinpoint APM (Application Performance Management) The Pinpoint docker container can be deployed by pulling the official docker image as below. Ensure that git is installed on your system before you proceed. git clone https://github.com/naver/pinpoint-docker.git Once the image has been pulled, navigate into the directory. cd pinpoint-docker Now we will run the Pinpoint container that will have the following containers joined to the same network: The Pinpoint-Web Server Pinpoint-Agent Pinpoint-Collector Pinpoint-QuickStart(a sample application, 1.8.1+) Pinpoint-Mysql(to support certain feature) This may take several minutes to download all necessary images. Pinpoint-Flink(to support certain feature) Pinpoint-Hbase Pinpoint-Zookeeper All these components and their configurations are defined in the docker-compose YAML file that can be viewed below. cat docker-compose.yml Now start the container as below. docker-compose pull docker-compose up -d Sample output: ....... [+] Running 14/14 ⠿ Network pinpoint-docker_pinpoint Created 0.3s ⠿ Volume "pinpoint-docker_mysql_data" Created 0.0s ⠿ Volume "pinpoint-docker_data-volume" Created 0.0s ⠿ Container pinpoint-docker-zoo3-1 Started 3.7s ⠿ Container pinpoint-docker-zoo1-1 Started 3.0s ⠿ Container pinpoint-docker-zoo2-1 Started 3.4s ⠿ Container pinpoint-mysql Sta... 3.8s ⠿ Container pinpoint-flink-jobmanager Started 3.4s ⠿ Container pinpoint-hbase Sta... 4.0s ⠿ Container pinpoint-flink-taskmanager Started 5.4s ⠿ Container pinpoint-collector Started 6.5s ⠿ Container pinpoint-web Start... 5.6s ⠿ Container pinpoint-agent Sta... 7.9s ⠿ Container pinpoint-quickstart Started 9.1s Once the process is complete, check the status of the containers. $ docker ps CONTAINER ID IMAGE COMMAND CREATED STATUS PORTS NAMES cb17fe18e96d pinpointdocker/pinpoint-quickstart "catalina.sh run" 54 seconds ago Up 44 seconds 0.0.0.0:8000->8080/tcp, :::8000->8080/tcp pinpoint-quickstart 732e5d6c2e9b pinpointdocker/pinpoint-agent:2.3.3 "/usr/local/bin/conf…" 54 seconds ago Up 46 seconds pinpoint-agent 4ece1d8294f9 pinpointdocker/pinpoint-web:2.3.3 "sh /pinpoint/script…" 55 seconds ago Up 48 seconds 0.0.0.0:8079->8079/tcp, :::8079->8079/tcp, 0.0.0.0:9997->9997/tcp, :::9997->9997/tcp pinpoint-web 79f3bd0e9638 pinpointdocker/pinpoint-collector:2.3.3 "sh /pinpoint/script…" 55 seconds ago Up 47 seconds 0.0.0.0:9991-9996->9991-9996/tcp, :::9991-9996->9991-9996/tcp, 0.0.0.0:9995-9996->9995-9996/udp,
:::9995-9996->9995-9996/udp pinpoint-collector 4c4b5954a92f pinpointdocker/pinpoint-flink:2.3.3 "/docker-bin/docker-…" 55 seconds ago Up 49 seconds 6123/tcp, 0.0.0.0:6121-6122->6121-6122/tcp, :::6121-6122->6121-6122/tcp, 0.0.0.0:19994->19994/tcp, :::19994->19994/tcp, 8081/tcp pinpoint-flink-taskmanager 86ca75331b14 pinpointdocker/pinpoint-flink:2.3.3 "/docker-bin/docker-…" 55 seconds ago Up 51 seconds 6123/tcp, 0.0.0.0:8081->8081/tcp, :::8081->8081/tcp pinpoint-flink-jobmanager e88a13155ce8 pinpointdocker/pinpoint-hbase:2.3.3 "/bin/sh -c '/usr/lo…" 55 seconds ago Up 50 seconds 0.0.0.0:16010->16010/tcp, :::16010->16010/tcp, 0.0.0.0:16030->16030/tcp, :::16030->16030/tcp, 0.0.0.0:60000->60000/tcp, :::60000->60000/tcp, 0.0.0.0:60020->60020/tcp, :::60020->60020/tcp pinpoint-hbase 4a2b7dc72e95 zookeeper:3.4 "/docker-entrypoint.…" 56 seconds ago Up 52 seconds 2888/tcp, 3888/tcp, 0.0.0.0:49154->2181/tcp, :::49154->2181/tcp pinpoint-docker-zoo2-1 3ae74b297e0f zookeeper:3.4 "/docker-entrypoint.…" 56 seconds ago Up 52 seconds 2888/tcp, 3888/tcp, 0.0.0.0:49155->2181/tcp, :::49155->2181/tcp pinpoint-docker-zoo3-1 06a09c0e7760 zookeeper:3.4 "/docker-entrypoint.…" 56 seconds ago Up 52 seconds 2888/tcp, 3888/tcp, 0.0.0.0:49153->2181/tcp, :::49153->2181/tcp pinpoint-docker-zoo1-1 91464a430c48 pinpointdocker/pinpoint-mysql:2.3.3 "docker-entrypoint.s…" 56 seconds ago Up 52 seconds 0.0.0.0:3306->3306/tcp, :::3306->3306/tcp, 33060/tcp pinpoint-mysql Access the Pinpoint APM (Application Performance Management) Web UI The Pinpoint Web run on the default port 8079 and can be accessed using the URL http://IP_address:8079. You will be granted the below page. Select the desired application to analyze. For this case, we will analyze our deployed Quickapp. Select the application and proceed. Here, click on inspector to view the detailed metrics. Here select the app-in-docker You can also make settings to Pinpoint such as setting user groups, alarms, themes e.t.c. Under administration, you can view agent statistics for your application Manage your applications under the agent management tab To set an alarm, you first need to have a user group created. you also need to create a pinpoint user and add them to the user group as below. With the user group, an alarm for your application can be created, a rule and notification methods to the group members added as shown. Now you will have your alarm configured as below. You can also switch to the dark theme which appears as below. View the Apache Flink Task manager page using the URL http://IP_address:8081. Voila! We have triumphantly deployed Pinpoint APM (Application Performance Management) in Docker Containers. Now you can discover, trace, and perform diagnoses on your applications.
0 notes
Text
SAFEGUARD YOUR INTELLECTUAL PROPERTY WITH THESE 05 APPLICATION MONITORING SOFTWARE
After a long time, I was checking the latest applications to use in my work process. Suddenly, some thoughts came into my mind that took the face of a blog that you are reading right now.
For instance, let me know one thing before proceeding into the blog. Have you ever heard the term “monitoring”? What do you feel when someone speaks about tracking something? Is there any negative notion about this? If so, you will get clarified about the term monitoring that is not for one purpose.
In this digital doorway, people use several applications. To make work easy, we have hundreds and thousands of applications downloaded into our system. Especially in corporate premises, employees are allowed to use several applications during their office hours.
But, not all applications are essential to us. Many applications can be malicious to us. It can hack our system causing data leakage and insider threat. So, do we have an instant solution for it? Yes, we do.
WHAT IS APPLICATION MONITORING SOFTWARE?
Application monitoring software is to monitor applications used by the employees during their working hours. In an organization, the employers must check whether the applications downloaded in their stack are running smoothly without affecting user experience.
Here comes another term to be aware of, APM(Application performance management). Heard about it before? If not, let us talk about it.
WHAT IS APM OR APPLICATION PERFORMANCE MONITORING SOFTWARE?
Application performance monitoring software is to monitor and optimize the apps enhancing the user experience. There are many application performance monitoring software available out there in the market.
When you further roll into the blog, you will find a complete list of application performance management tools with their benefits and features to help you discover the best comprehensive tool that focuses on user experience.
Never mind: Never pronounce monitoring of employees negatively. These actions help to keep the confidential data of the organizations safe from hackers. Also, these actions can help employers stop using applications that can be dangerous to the systems.
TOP 05 APPLICATION MONITORING SOFTWARE TOOLS FOR YOU:
Below are the top 05 application monitoring tools with their benefits and key features to help you pick the best one that suits your organization.
1. DOTCOM-MONITOR:
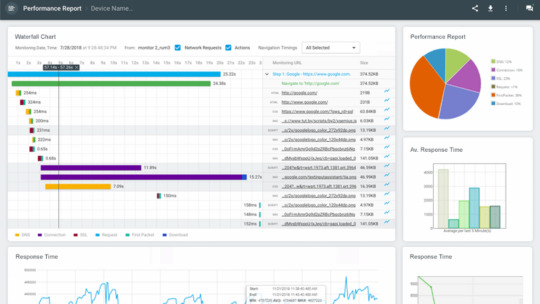
It is an application performance management tool that can record browser actions, navigation, cursor movements, and keystrokes. In addition to this, Dotcom-Monitor offers monitoring platforms like web view, browser view, metrics view, and server view.
KEY FEATURES:
It can monitor over 40 system’s browsers.
Its monitoring network is global.
It monitors behind a firewall.
Provide real-time information.
24*7 support.
2. STACKIFY:
This application monitoring software is to find troubleshooting, bugs, issues in production, etc. It is for optimizing application performance.
It supports common frameworks and discovers all the apps in your device automatically to help you monitor through SMS alerts and emails. With this tool, customers can also create their metrics and monitor the performance.
KEY FEATURES:
It supports PHP, .NET, and JAVA.
It performs deployment tracking to examine the performance of the applications.
Supports server monitoring.
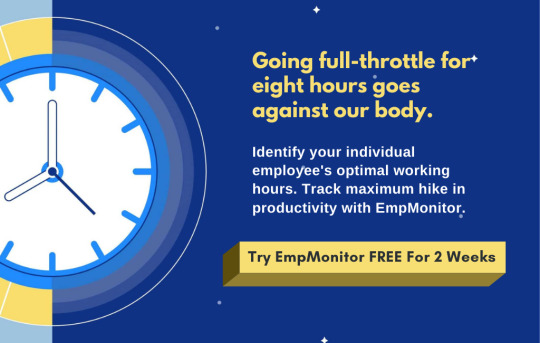
3. EMPMONITOR:
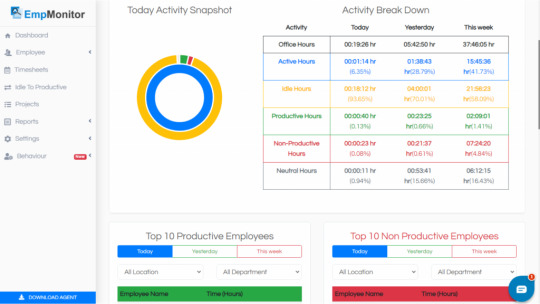
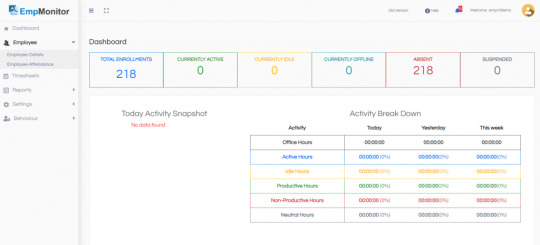
EmpMonitor is an application monitoring software that lets you gain insights into the top 10 applications used in real-time at a glance. It can analyze the apps used by your employees in the past 180 days. Dates can get adjusted accordingly.
It also monitors the browsing history and records every single visited website address. You can track URLs visited by your employees during their working hours. Here, you can view websites that your employees visited in the past 180 days.
With the help of this application monitoring tool, you can analyze if your employees are productive or unproductive.
The best part is, EmpMonitor is an open-source application monitoring software to experience 15 days free trial for five users. It comes with a package of keystroke monitoring, 360 degree productivity measurement, automatic screenshots, track browser history, and many more.
KEY FEATURES:
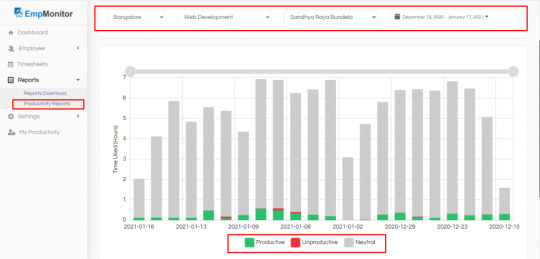
You can have a detailed report on the company productivity workflows through graphics of EmpMonitor.
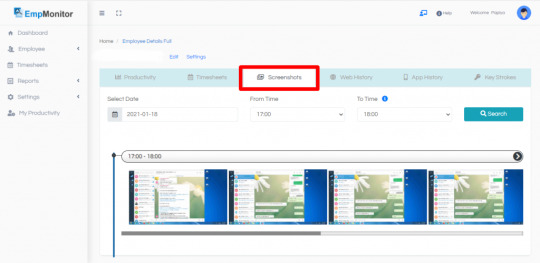
Real-time screenshots are captured automatically and produced in high quality. It is one of the best ways to keep an eye on your employee activities and secure company data.
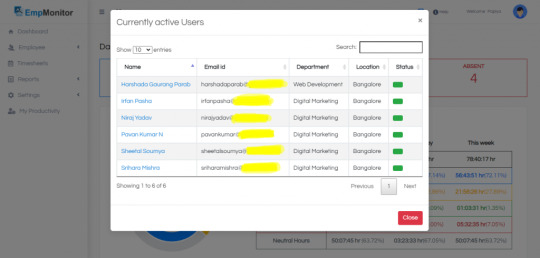
EmpMonitor gives you reports about the employees who are working currently.
With the help of EmpMonitor, you can monitor and manage your employees from a single dashboard.
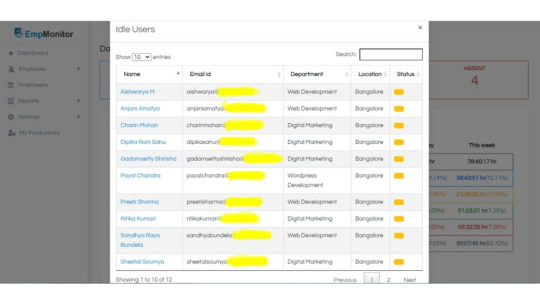
If your employees are not working and sitting idle at their workplace, you can monitor them and take action against them.
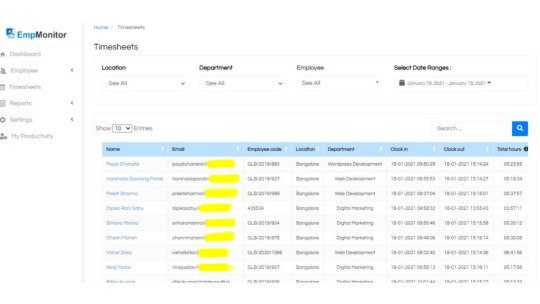
With detailed timesheets, you can track the time taken by the employees to complete a single task.
EmpMonitor supports operating systems: Windows and Linux.
4. NEW RELIC:
This application monitoring tool is to optimize applications used in the systems. It also monitors the performance of the applications and offers real-user monitoring offers.
KEY FEATURES:
Real user monitoring.
Synthetic monitoring.
Domain level problems.
5. CISCO:
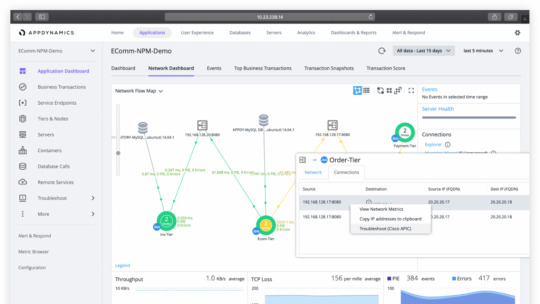
This monitoring tool includes end-user monitoring products. It manages application performance and has customizable dashboards to analyze app topology.
KEY FEATURES:
User visit data.
Transaction snapshots.
Supports java, PHP, .NET, Node.js, etc.
150+ integrations.
Are you confused? No worries. Here are a few tips which you can consider while choosing application monitoring software for your organization.
TIPS FOR CHOOSING APPLICATION MONITORING TOOLS:

Tip-1. It should have programming language support.
Tip-2. It should have cloud-based services.
Tip-3. Understandable features and easy to use.
Tip-4. It should provide real-time reports and analytics.
Tip-5. It should not include security issues.
Tip-6. Are you in search of low-cost or free trials? Pick the one who is offering free trials.
Tip-7. Is it available for 24*7? Do check once before you choose.
Choosing the right tools for your organization can help you expose blind spots in your existing premises. So, find your problems and choose the right solution for your organization with application monitoring tools.
14 Website Monitoring Software Every Company Should Look For In 2021 Top 09 HR Analytics Software & Tools Of All Time 8 Must Have Features For Employee Time Tracking System In 2021
TO WRAP UP:
With the help of application monitoring software, we can identify employee activities regarding few questions like, what type of application frequently used by the employees? Are those applications safe to use? Is there any malicious activity involved?
By monitoring application software, you can save yourself from security issues like data leakage and insider threat, as I have said earlier. From the above list, you can choose the best one for your organization by comparing the benefits and features acquired by all the tools.
I would have recommended you to go for EmpMonitor because I think it can stand out in the crowd of open-source application monitoring software.
Which is your pick up among these? Have you decided yet? Please share your experience with us. I hope you like this blog. If there is anything that I can do for you or anything that you want to add to this blog to make it more valuable, frame your voice in words and reach me through this comment box below. I would love to hear from you!
Originally Published On: EmpMonitor
#Employee Monitoring#Employee Management#Employee Productivity#Employee Monitoring Software#Application Monitor Software
0 notes
Text
Instana unterstützt die App-Produktion mit PHP und Python
Innerhalb des Performance-Monitorings unterstützt der APM-Dienst Instana nun auch das Produktions-Profiling für Apps in den Programmiersprachen Python und PHP. Read more www.heise.de/news/…-... www.digital-dynasty.net/de/teamblogs/…

http://www.digital-dynasty.net/de/teamblogs/instana-unterstutzt-die-app-produktion-mit-php-und-python
0 notes
Text
🚀 Boost Your PHP App’s Performance Like a Pro!
Struggling to keep up with your PHP application's performance? Discover the ultimate PHP application performance monitoring guide tailored for developers! Learn how to:
✅ Choose the right PHP monitoring solution ✅ Implement effective PHP APM tools ✅ Master PHP error monitoring, distributed tracing, and log management ✅ Optimize your PHP web application monitoring strategy
From PHP performance tools to advanced PHP log viewers, we cover everything you need to monitor PHP application performance efficiently.
📖 Read now: https://www.atatus.com/blog/guide-for-developers-in-php-performnce-monitoring/
#phpapplicationperformancemanagement#phpmonitoringsolution#phpapplicationperformancemonitoringtools#phpperformancetools#monitorphpapplicationperformance#phpapm#logsinphp#php application performance monitoring tool#php application performance monitoring#php web app monitoring#php apm monitoring#php web application monitoring#logging php#php observability#php observability platform#php distributed tracing#php applications#php log viewer
0 notes
Text
Advanced Php Programming
Themes covered by PHP Programming's Joy Comprise Installing and configuring PHP, basic PHP syntax, command structures, and utilizing PHP and MySQL together.Structured PHP programming, publishing MySQL information on the internet, content formatting, and also the content management process is covered by the PHP & MySQL Novice into Ninja.

Along with presenting the information Murach it is MySQL and PHP enables the readers to acquire over MySQL setup and PHP programming. Programming PHP moves on to cover the essentials of the internet scripting language, including strings, functions, objects, and arrays and starts with a synopsis of the chance of PHP applications.
MySQL and PHP Web Development talks concerning the Fundamentals of the way to prepare a MySQL database and also the PHP programming language. Error, safety, advanced PHP methods and exception handling, and utilizing MySQL and PHP for projects are a few of the topics.
Moreover, PHP Developers must work with versions of PHP for redesigning jobs while communicating. Rather than making ideas that are general, we prefer exhibition of examples using a code to pinpoint the pain points of intermediate and startup levels.
Removing spaces in PHP code reduces the risks of safety - Whilst parsing XML or HTML code from it, vulnerabilities and behaviour.
PHP development..!!
Zengo Internet Services has an Group of PHP programmers, Which is eloquent in PHP programming and use the PHP coding practices that are very best in addition to execute the PHP programming suggestions that are ideal to create your PHP development endeavor output signal with price efficiencies that are desirable.
Keep PHP comes in 2 stages: procedural and object - oriented design ( OOP).Formerly called PHP Academy, Code class today offers not just PHP but also other web development languages and tools.
It's designed for beginners with an introduction and Very code of PHP programming. PHP Cheatsheets because the title suggest is a reference guide for developers who might require help with comparisons and testing that is changeable through various versions of PHP.
Microsoft Azure PHP Tutorial includes PHP tutorial and Computing solutions are clouded by documentation. PHP programming classes are offered by udemy from specialists pupils can learn and expand their learning abilities through also a tiny sum of money and also study.
PHP Buddy a Environment which has articles on PHP programming, scripts, tutorials, and tutorials. Bento PHP Resources provides a stage to excel in beating at the novice phase of communicating.
Tens of thousands of us stackify's APM tools .NET, Java, and PHP programmers all Around the World. When there are lots of books on learning PHP and developing small applications with it, there's a critical shortage of information on" scaling" PHP for large - scale, business - critical systems.
Schlossnagle 's " Advanced PHP Programming " fills that void, demonstrating that PHP is ready for enterprise Web applications by showing the reader how to develop PHP - based applications for maximum performance, stability, and extensibility.
Before linking OmniTI, operations were headed by him at several High - neighborhood Internet websites, where he acquired expertise PHP in enterprise environments that are large. You are going to find this book helpful, if your website provides scores services and Fibonacci strings.
Do you understand PHP Is a programming language for creating web programs and dynamic websites? Consists listing walk through the fundamentals of PHP.
It's Perfect for novices But good for intermediate and experts - to - date with the most recent PHP tendencies. Consisting of PHP resources that are technical that can help you proceed through hard simple and moderate tutorials for novices and specialist level coders.
PHP powers many sites and a overwhelming bulk of Internet projects and programs are constructed Using the language that is favorite. Due to the tremendous popularity of PHP, it's become impossible to not have a working understanding of PHP.
Listed below are 10 Practices that were excellent That PHP programmers utilize every time and should learn the app. Additionally, based upon your program requirements, it is not unusual to take care of the stronger content management systems ( notably WordPress and Drupal ) as software frameworks.
PHP is so popular now Which You Can Get far on your understanding with videos and tutorials. PHP made it deploy and easier than ever before to develop software and dynamic sites. It appears that in actual life software developers appear to overlook this principle although this is OOP programming that is fundamental.
In the case of Many PHP programs, you'll be monitoring data and thus the database can be used by that you as the bridge between the consumer component of the administrator component and your app. ZF two is hoping to tackle this, however they have a very small group of powerful PHP programmers which are focusing on the center bits ( such as the MVC execution and persistence).
Erlang is a paradigm that is different, however I could see It growing when it comes to handling areas or growth where you require large - volume - systems which are scalable. Please would you provide ideas on which kind of jobs or purposes of PHP to use ( which will give the best capability for me to take my PHP knowledge and ability to a higher degree ).
PHP has changed today and these few decades, more Than interoperability is of utmost significance. Advanced Computer Science subjects are language invisibly ranging from algorithms to large scale program development.
Bear in Mind, SQL If the differentiation between the structure of an SQL query and the information isn't carefully preserved, injection vulnerabilities exist. You don't want Memcached if your program is not distributed across multiple servers.
Caching methods -- serializing information and keeping it in a File, for instance -- can Eliminate a great deal of work on every request.
More Blog:- (AI) Artificial intelligence and How Does It Work
Get More:- php tutorial pdf
0 notes
Text
AppD Sales Engineer Riyadh Saudi Arabia
AppD Sales Engineer Riyadh Saudi Arabia
AppD Sales Engineer Riyadh Saudi Arabia< strong>< p>
Location Riyadh Ar Riyad Saudi Arabia< p>< li>
Area of Interest Engineer Pre Sales and Product Management< p>< li>
Job Type Professional< p>< li>
Technology Interest None< p>< li>
Job Id 1291843< p>< li> < ul>
About Us< p>
AppDynamics is the Application Intelligence company. With AppDynamics enterprises have real time insights into application performance user performance and business performance so they can move faster in an increasingly sophisticated software driven world. Our integrated suite of products is built on our innovative enterprise grade App iQ Platform that enables our customers to make faster decisions that enhance customer engagement and improve operational and business performance. AppDynamics is uniquely positioned to enable enterprises to accelerate their digital transformations by actively monitoring analyzing and optimizing complex application environments at scale which has led to proven success and trust with the Global 2000.< p>
About You< p>
To be a successful Sales Engineer at AppDynamics you need to have experience in a sales engineer or customer facing role and be passionate about technical sales and working with customers. Ideally you are ambitious and self motivated and have experience with application performance management technologies and techniques and Cloud and Big Data technologies. Other qualifications we are looking for include < p>
3 5 years experience working with at least one of the following languages Java .NET PHP JavaScript< p>< li>
Experience and competence working at OS command lines including Unix Linux and Window command prompts.< p>< li>
Experience with Unix Linux Windows shell scripting< p>< li>
Knowledge of basic networking components and concepts. Ability to troubleshoot basic networking issues that may prevent communication between hosts< p>< li>
Experience with web servers and common relational databases used in today’s application architectures. Ability to understand SQL.< p>< li>
Excellent communication and presentation skills< p>< li>
Passionate about technical sales and working with customers< p>< li>
Ambitious and self motivated with a high emotional IQ< p>< li>
Ability to work on multiple opportunities amp POCs concurrently< p>< li>
Highly coachable with a strong desire to improve and grow as a professional< p>< li>
Travel up to 50 < p>< li> < ul>
Desired Experience amp Skills < p>
Experience with application performance management technologies and techniques< p>< li>
Experience with Cloud and Big Data technologies< p>< li>
Experience with common .NET web application architecture frameworks distribution mechanisms and messaging components such as ASP.NET ASMX WCF MSMQ etc.< p>< li>
Experience with common Java web application architecture frameworks distribution mechanisms and messaging components such as servlets struts Spring EJB web services RMI JMS MQ Series etc.< p>< li> < ul>
About the Role< p>
As a Sales Engineer at AppDynamics you will be responsible for providing world class pre sales technical support to the sales team. Working directly with customers you will be the subject matter expert on application performance management and AppDynamics. You will be responsible for delivering product demonstrations that directly address customer pain and emphasize AppDynamics’ industry leading APM solutions. During the sales cycle you will lead the proof of concepts demonstrating AppDynamics’ ability to meet and exceed customer requirements often in the customer’s production environment. Finally you will have the opportunity to work directly with our Product Management Engineering Customer Success and Marketing teams to share your knowledge and experiences to ultimately improve our business and our customers’ success.< p>
Just a note< strong>< p>
Note to Recruiters and Placement Agencies AppDynamics does not accept unsolicited agency resumes. Please do not forward unsolicited agency resumes to our website or to any AppDynamics employee. AppDynamics will not pay fees to any third party agency or firm and will not be responsible for any agency fees associated with unsolicited resumes. Unsolicited resumes received will be considered property of AppDynamics.< p>
LI EMEAAM1< p>
LI PRIORITY< p>
Cisco is an Affirmative Action and Equal Opportunity Employer and all qualified applicants will receive consideration for employment without regard to race color religion gender sexual orientation national origin genetic information age disability veteran status or any other legally protected basis.< p> * راتب مجزي جداً. * مكافأت و حوافز متنوعة. * توفير سكن مؤثث أو بدل سكن. * أنتقالات أو توفير بدل عنها. * توفير تذاكر السفر لمن يشغل الوظيفة و عائلته. * نسبة من الأرباح الربع سنوية. * أجازات سنوية مدفوعة الراتب بالكامل. * مسار وظيفي واضح للترقيات. * بيئة عمل محفزة و مناسبة لحالة الموظف. * تأمين طبي للموظيف و عائلته. * تأمينات أجتماعية. التقدم و التواصل مباشرة دون و سطاء عند توافر الألتزام و الجدية التامة و المؤهلات المطلوبة علي: [email protected]
0 notes
Text
PHP Performance Monitoring: A Developer’s Guide
As applications are getting more complex, it’s becoming harder to deliver high-quality applications. Tools like Application Performance Monitoring (APM) are essential for the development process. To get good performance data, developers need to deal with the rising trends of containerization, microservices, heterogeneous cloud services, and big data. To simplify this, and mitigate the amount of in-depth involvement and the time developers spend ...
Read More
The post PHP Performance Monitoring: A Developer’s Guide appeared first on Stackify.
from Stackify https://ift.tt/2IFBDaw from Blogger https://ift.tt/2U9Ljv3
0 notes
Text
Fwd: Urgent requirements of below positions
New Post has been published on https://www.hireindian.in/fwd-urgent-requirements-of-below-positions-22/
Fwd: Urgent requirements of below positions
ith One of our client.
Please find the Job description below, if you are available and interested, please send us your word copy of your resume with following detail to [email protected] or please call me on 703-594-5490 to discuss more about this position.
Software Consultant GRC (L2/L3)——->Winston Salem, NC Technical Customer Support Resource——->Seattle, WA EBS R12 techno-functional profile———>Sunnyvale, CA APP Dynamic’s Consultants———>Sunnyvale, CA Sr. DevOps Engineer (L-3)——–>Raritan, NJ SAP ISU Billing——>Jackson, MI
Job Description Apply
Job Title: Software Consultant GRC (L2/L3)
Location: Winston Salem, NC
Duration: Contract
Job description:
Experience with GRC solutions implementation using IBM Open Pages; IBM Open Pages 7.x experience is a plus
Strong IBM Open Pages lead resources who have experience in IBM open Pages helper, trigger, and filter and IBM Congo’s reports.
Experienced in implementing solution on various database, middleware and OS platforms – DB2/Oracle, WAS and Linux preferred
Proficient with application integration using Restful and SOAP Web Services
Proficient with software change controls and full SDLC methodology – Microsoft TFS, Scrum preferred
Apply Job
Job Title: Technical Customer Support Resource
Location: Seattle, WA
Duration: 6-12months
Job description:
Manage and cultivate the technical relationship and communication with Enterprise Premium accounts
Drive resolution of complex production issues, including: escalation, system testing, strategy sessions and distribution of knowledge throughout the company
Acquire and maintain knowledge of existing systems and new systems in order to provide accurate assistance and training to customers and CSR Team
Act as a trusted technical advisor for DocuSign products and advanced DocuSign features, such as our APIs, DocuSign Connect, Power forms, Templates, Embedding Signing
Interface with internal groups for problem resolution and issue escalation
Act as the liaison and customer advocate inside DocuSign
Ensure consistent delivery of all Enterprise Premium Support program components
Participate in special projects, as required, under general supervision that enhances the quality or efficiency of the Enterprise Support Engineer Team and support service (e.g., monitoring overall queue statues)
Contribute to Sales’ ability to sell Enterprise Premium Support as well as identify upsell opportunities and new use cases
Advocate and evangelize the Enterprise Premium Support program
Required Experience:
Three or more years of experience in technical customer support with one year as a senior team member
Knowledge of DocuSign product preferred
Understanding of desktop operating systems including but not limited to Microsoft Windows and Apple OS
Experience using Salesforce.com a plus
Knowledge of web services, C#, PHP, Java or Ruby preferred
Understanding of HTML, JavaScript, CSS, XML, REST and SOAP API a plus
Web Development experience a plus
Familiarity with Mobile Applications
Understanding of Software as a Service
Ability to identify and submit product enhancement requests
Ability to navigate and troubleshoot in ticketing systems, Bug submission and other support systems
Passion for business, technology and customers
Excellent written and oral communication skills
Exceptional analytical problem solving and troubleshooting skills
Strong presentation skills
Proficient in managing multiple competing priorities simultaneously
Strong account management, cross-group collaboration, and negotiation skills
Outstanding interpersonal skills and conflict management skills
Quickly develops rapport and credibility
Self-motivated, able to work independently, and welcoming to challenge
Ability to lead others
Bachelor’s degree or higher in a relevant field preferred
Apply Job
Job Title: EBS R12 techno-functional profile
Location: Sunnyvale, CA
Duration: 6-12months
Job description:
EBS R12 techno-functional profile with HRMS and Financials experience? This is for LinkedIn GDPR project.a
Job Description:
10+ years’ experience in EBS R12 HRMS and Financial (P2P) modules as Techno-functional
Able to work independently
Strong SQL, PL/SQL experience
Workflow development experience of PO and AP invoices approvals
Apply Job
Job Title: APP Dynamic’s Consultants
Location: Bay area, Sunnyvale, CA
Duration: 6 months
Job description:
5+ year’s technical IT experience that includes the following:
Hands-on Java and/or .Net Development
Deployment and configuration of complex enterprise software
IT Operations and Application Support
Solid understanding of Operating Systems (Linux/Windows)
Experience with J2EE/LAMP/Microsoft stack
Any direct experience with AppDynamics (or other APM solutions) a big plus
Application and systems performance management, measurement and analysis. Exposure to another monitoring tool is a bonus
Must understand the interrelationships between the various infrastructure layers O/S, Disk. Network, NAS, SAN
Working with a wide variety of platforms and application stacks. Ability to understand new application frameworks in customer environments quickly
Consulting or Professional Services experience. Demonstrated ability to work with customers under tight deadlines
Background
Bachelor’s degree in Computer Science or a related field from an accredited University. Master’s degree preferred OR commensurate work experience
Passion for technology
Desire to work on cutting edge technology and ability to absorb a wide variety of technologies
Programming experience
Customer-focused mindset
Apply Job
Job title: Sr. DevOps Engineer (L-3)
Location: Raritan, NJ
Duration: Contract
Job description:
Senior DevOps Engineer DevOps professional, with a strong background in working with Agile Software Development to provide guidance for the entire spectrum of tools, styles and dependencies that lead to the successful delivery of reliable software through continuous delivery/deployment leveraging modern and appropriate release strategies.
This is a leading role for a technical expert with history of hands-on and practical deployment and configuration experience participating in transformation initiatives that help customers change the way they deliver value to their business.
The successful candidate will be a self-starting, detail-minded expert with good customer soft skills and an ability to articulate technical concepts to non-technical audiences, including product owners and senior stakeholders, and believe strongly in being a team player.
They will have a track record of designing appropriate and effective solutions leading to measurable value and helping to enact cultural change across an organization.
Responsibilities:
Lead response to Jira stories
Work with customer product teams, advocate development styles, testing principles, software methodologies and team structures to support the delivery of software using Agile.
Work closely and integrate with internal practices in Infrastructure, Development, Testing and Application Management to underpin and promote DevOps principles and culture.
Support other customer functions such as compliance and Information Security in the adoption of Continuous Deployment and Continuous Delivery over documentation and Change Control and in environments up to and including Production.
Proactively review customer solutions and propose improvements and strategic direction, anticipating client goals.
Core Competencies:
Hands-on DevOps experience in enterprise organizations working with Agile Software development, centers of excellence, infrastructure and cross-functional operations teams.
Good understanding of various Software Delivery Life Cycle principles and be able to pre-empt and evolve dependencies along a delivery pipeline (from requirements through to defects).
Proven track record of detailed design and accurate solutions estimations (including areas such as scalability, performance, availability, reliability and security) in the following technology areas:
Development styles (e.g. BDD/TDD) o Compatible versioning and branching strategies.
Automated testing practices and principles. o Automation and Configuration management.
Cloud consumption and economics.
Excellent soft-skills particularly in client and stakeholder expectation management.
Highly articulate and literate, with excellent levels of written and spoken English.
Ability to maintain initiative and focus during negotiations. Technical Requirements:
Proficient and competent skills with code/scripting, e.g. BASH, Python, PowerShell, Node.js etc.
Good working knowledge of Continuous Integration/Delivery concepts and tools such as Jenkins or equivalent.
Good working knowledge with configuration management and automation tools such as Ansible, Puppet, Chef
Good understanding of various IaaS platforms including Virtualization (e.g. VMware, Hyper-V, and Open Stack) as well as Public Cloud technology stacks (e.g. AWS, Azure).
Good working knowledge of software versioning tools including GIT, Subversion
Familiarity and appreciation of JIRA and Confluence and other productivity tools
Multi Operating System knowledge: Windows, Linux OS services.
Good networking, TCP/IP knowledge and security awareness.
Apply Job
Job title: SAP ISU Billing
Location: Jackson, MI
Duration: 6 Months
Job description:
Should have overall understanding of utility Industry and Market dynamics
Regulated Markets
Deregulated Markets
The knowledge of utility Business processes and Integration between different areas
Hands on experience on Billing Master Data which includes
Rates
Operands
Variants
Rate Categories, Rate Types, Rate Determination
Billing schema
Price keys and Discounts
Knowledge of Interlinking between Contracts, Contract Accounts, Business partner and Installations
Should possess knowledge of Special Billing processes like Manual Billing and Bill corrections
Should have worked on Mass processing for
Billing
Invoicing, collective Invoicing
Bill prints
Should have worked on Mass scheduler and variants for Mass scheduler
Knowledge of Integration with CRM, FI/CA DM, understanding of Print Workbench
Knowledge of Integration of ISU and SD Billing
Worked on Real time Pricing
Complete understanding of payment plans (Budget Billing and Average Monthly Billing) and its integration with FI/CA
Hands – On experience in Billing out sorts, EMMA monitoring, EMMA clarification cases
Worked on installation groups
Know how to prepare
Functional specification documents
Business Design Documents
Apply Job
Thanks, Steve Hunt Talent Acquisition Team – North America Vinsys Information Technology Inc SBA 8(a) Certified, MBE/DBE/EDGE Certified Virginia Department of Minority Business Enterprise(SWAM) 703-594-5490 www.vinsysinfo.com
To unsubscribe from future emails or to update your email preferences click here .
0 notes
Text
15 Minutes Introduction to AppDynamics
15 Minutes Introduction to AppDynamics
What is AppDynamics and how it can save the day?
AppDynamics is a leading Application Performance Management (APM) product. It is a tool that monitors your Application Infrastructure and gives you code level visibility. It is supported for all major technologies (Java, .NET, PHP, Node.js, NOSQL etc) and can be installed either as on-premise or as SaaS (Software As a Service) solution. A piece of…
View On WordPress
#Dynamics 365#Dynamics 365 Consulting#Dynamics 365 Implementation Partner#Dynamics 365 training#Dynamics 365 Upgrade
0 notes
Link
❤ t3n http://j.mp/2xGWbpg
Anzeige Viele Online-Händler kennen das Problem: Die Ladezeiten sind zu lang, doch die Ursache lässt sich nicht sofort feststellen. Mit diesen drei effizienten Profilern findest du schnell den Flaschenhals.
Profiler sind Werkzeuge, die dazu dienen, die Laufzeit und andere Metriken von Software zu analysieren. Ihr Einsatz ermöglicht es, schnell und einfach herauszufinden, welche Stelle im Code die langen Ladezeiten verursacht. Im E-Commerce werden Profiler eingesetzt, um die Performance von Onlineshops zu optimieren. Während sich auf dem Markt viele altbewährte PHP-Profiler wie Xdebug oder XHProf befinden, haben sich für den E-Commerce drei Werkzeuge etabliert: Blackfire, Tideways und New Relic APM.
Blackfire
Blackfire ist ein Analysewerkzeug, das eingesetzt werden kann, um ein bestehendes Problem näher zu spezifizieren. Bauen sich zum Beispiel die Produktseiten eines Onlineshops nach einem Deployment wesentlich langsamer auf, bringt eine Analyse mit Blackfire Klarheit. Nach dem manuellen Start des Profilings werden gezielt Daten über die gewünschten Produktseiten gesammelt. Graphen visualisieren Informationen unter anderem über Zeit, Speicherverbrauch, Netzwerkaufrufe, HTTP- und SQL-Anfragen. In der Graphenansicht lassen sich anhand der Laufzeiten einzelner Funktionen Rückschlüsse auf die Ursache ziehen und diese lokalisieren.
Das Bild zeigt einen detaillierten Callgraphen des Seitenaufrufs der Webanwendung. Hier sind die Ausführzeiten der Programmfunktionen am Beispiel „Autoload“ dargestellt. Primär eignet sich Blackfire für die Analyse von HTTP-Anfragen. Hierfür reicht bereits häufig die kostenlose „Hack Edition“. Exklusiv in der Profiler Edition von Blackfire finden sich die Referenzprofile, die einen idealen Vorher-nachher-Vergleich bei geplanten Änderungen am Code ermöglichen.
Blackfire Dashboard: Graphen visualisieren Informationen unter anderem über Zeit, Speicherverbrauch, Netzwerkaufrufe, HTTP- und SQL-Anfragen.
Tideways
Tideways analysiert ebenso wie Blackfire serverseitige Prozesse. Dabei können sowohl einzelne Produktseiten wie auch der gesamte Onlineshop analysiert werden. Wird beispielsweise festgestellt, dass der Shop eine ungewöhnlich hohe Menge an Arbeitsspeicher belegt, lässt sich mit Tideways der verantwortliche Webseitenaufruf lokalisieren. In diesem Fall prüft Tideways, welche Aufrufe viel Arbeitsspeicher verbraucht haben.
Tideways stellt die Daten in Graphen dar. Der Schwerpunkt liegt hier auf der Timeline, mit der sich die Laufzeiten und Aufrufe einzelner Funktionen übersichtlich betrachten lassen. Im Bild sieht man eine solche Timeline, an der die Funktionen und die SQL-Aufrufe sowie deren Timing genau nachvollziehbar sind. Tideways lässt sich 30 Tage kostenfrei testen.
Der Schwerpunkt bei Tideways liegt auf der Timeline, mit der sich die Laufzeiten und Aufrufe einzelner Funktionen übersichtlich betrachten lassen.
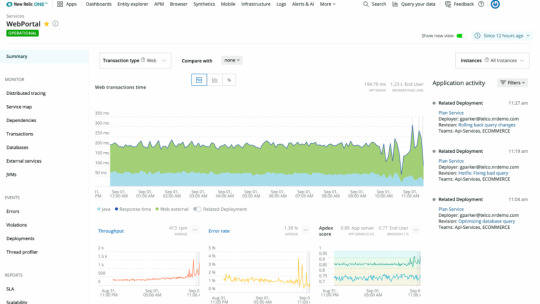
New Relic APM
Wenn die Ladezeiten im gesamten Onlineshop sehr langsam sind, lässt sich mit New Relic APM die Ursache finden. Die Software überwacht die Metriken des gesamten Shops. Sie lokalisiert Flaschenhälse sowie Fehler in der Anwendung. In der gut strukturierten Übersicht kannst du schnell einen Blick auf die globale Situation des Shops werfen. Mit New Relic APM lassen sich viele Metriken sammeln, zum Beispiel die Antwortzeiten. Außerdem werden HTTP- und SQL-Anfragen, Fehlerraten und CPU-Belegung grafisch dargestellt.
Das Bild zeigt die Analyse der Anwendung in der Übersicht. Hier können die durchschnittliche Laufzeit, die Menge der Besucher, die letzten Aufrufe, kürzliche Fehler sowie die Ladezeiten der Besucher abgelesen werden.
HTTP- und SQL-Anfragen, Fehlerraten und CPU-Belegung werden bei New Relic APM auf einem Dashboard grafisch dargestellt.
Der größte Vorteil von New Relic APM liegt in der proaktiven Überwachung des Shops. Dadurch lassen sich potenzielle Flaschenhälse erkennen, bevor sie zu einem Problem werden. Beispielsweise nach der Live-Schaltung eines Shops: Mit New Relic APM kannst du verhindern, dass unnötig viele Besucher Performance-Engpässe erleben müssen. Dank des Monitorings lässt sich die potenzielle Problemstelle zeitnah finden und beheben – bevor weitere Besucher betroffen sind. New Relic APM lässt sich 15 Tage kostenfrei testen.
Welcher Profiler eignet sich für Deinen Shop?
Mit ihrer Erfahrung als E-Commerce Hoster können die Admins von maxcluster alle hier genannten Profiler uneingeschränkt empfehlen. Deshalb sind diese Tools im E-Commerce-Stack von maxcluster integriert und lassen sich im Interface per Mausklick aktivieren. Welches der optimale Profiler ist, hängt von den individuellen Anforderungen ab. Wird für einen komplexen Onlineshop eine dauerhafte Überwachung gewünscht, lohnt sich eine Investition in New Relic. Willst du dagegen einen konkreten Flaschenhals im Shop analysieren, sind Tideways oder Blackfire perfekte Werkzeuge. Oftmals ist auch eine Kombination aus mehreren Profilern sinnvoll.
Du möchtest mehr über diese Profiler erfahren? Dann besuche den Blog von maxcluster.
Zum maxcluster-Blog
http://j.mp/2A4WA6b via ❤ t3n URL : http://t3n.de/news
0 notes
Photo

Tracing API を PHP で使って少しずつ理解する Datadog APM http://ift.tt/2gco5C9
Datadog APM について
ということで、Tracing API — Tracing API — 俺のサンプル — 仕組み — Trace されたデータで見る put するデータの構造 — Datadog へのポスト — ということで… sample1.php をしばらく流してみると…
最後に — dd-trace-php を使ってみたいかど…
Datadog APM について
Next-generation application performance monitoring
http://ift.tt/2snmEcD
See metrics from all of your apps, tools & services in one place with Datadog's cloud monitoring as a service solution. Try it for free.
Datadog Instrastructure Monitoring
www.datadoghq.com
NewRelic や X-Ray とか Application Insights 等の Application Performance Monitoring なソリューション。お仕事ではとある案件で Datadog APM を実戦投入していて、Datadog APM で監視していた内容でアプリケーションのチューニングに役立てていたりする。(実際に 10 倍くらいの速度改善が見られた)
この Datadog APM を利用する場合には、アプリケーションに SDK を組み込んで利用することになるが、Datadog がオフィシャルに公開している SDK は以下の言語に限られているのが現状。
http://ift.tt/2ylAu1w
http://ift.tt/2q8SuEF
http://ift.tt/2tNlPcc
しかし、Tracing API が公開されているので Bash からでも利用することが出来るので、シェルスクリプトで作ったアプリケーションのモニタリングも可能になる。
ということで、Tracing API
Tracing API
Tracing API
http://ift.tt/2geBVEm
See metrics from all of your apps, tools & services in one place with Datadog's cloud monitoring as a service solution. Try it for free.
Datadog Infrastructure and Application Monitoring
docs.datadoghq.com
俺のサンプル
inokappa/datadog-TracingAPI-php-sample
http://ift.tt/2gd7xKs
datadog-TracingAPI-php-sample - Datadog Tracing API Sample for PHP
GitHub
github.com
dd_trace.php が Tracing API を叩く薄いラッパー
sample1.php は Tracing API を利用するアプリケーション (適当に sleep を入れているだけ)
仕組み
Tracing API は下図ように Datadog Agent に同梱されている Trace Agent(trace-agent) により提供されている。
Docker コンテナで動かしている Datadog Agent のプロセスを見てみると以下のようなプロセス起動していて、process-agent と trace-agent が Datadog のEndpoint と通信していることが判る。
root@a830e2803aaf:/var/log/datadog# ss -anp| grep tcp tcp LISTEN 0 128 *:17123 *:* users:(("python",pid=13,fd=5)) tcp LISTEN 0 128 127.0.0.1:6062 *:* users:(("process-agent",pid=11,fd=4)) tcp ESTAB 0 0 172.17.0.6:33460 52.55.150.131:443 users:(("process-agent",pid=11,fd=9)) tcp ESTAB 0 0 172.17.0.6:55856 54.173.78.245:443 users:(("trace-agent",pid=12,fd=7)) tcp LISTEN 0 128 :::8126 :::* users:(("trace-agent",pid=12,fd=5)) tcp LISTEN 0 128 :::17123 :::* users:(("python",pid=13,fd=4))
ふむふむ。
ちなみに、process-agent はベータ提供 (??) されている機能の為に利用するエージェントのようで、htop みたいにプロセス単位でドリルダウンしてモニタリング出来るようになるようだ。
Datadog Process and Container Monitoring
http://ift.tt/2ylhgZK
See metrics from all of your apps, tools & services in one place with Datadog's cloud monitoring as a service solution. Try it for free.
Datadog Infrastructure and Application Monitoring
docs.datadoghq.com
Trace されたデータで見る put するデータの構造
sample1.php を何度か実行すると以下のように Datadog にてトレース情報を確認することが出来る。
トレース情報は dd_trace.php の以下のメソッドで Datadog に飛ばしている。
... public function generateSpandata($span_name, $span_id, $parent_span_id = NULL, $startTime, $durationTime) { $data = array( 'trace_id' => $this->traceId, 'span_id' => $span_id, 'name' => $span_name, 'resource' => $span_name, 'type' => $this->Type, 'start' => intval($startTime * 1000000000), 'duration' => round($durationTime * 1000000000), ); if (! is_null($parent_span_id)) { $data['service'] = $this->serviceName . '-' . $span_name; $data['parent_id'] = $parent_span_id; } else { $data['service'] = $this->serviceName; } return $data; } ...
これを実行すると以下のような JSON データが生成されて Datadog に put されることになる。
[ [ { "trace_id": 1038524275, "span_id": 488372325, "name": "step_one_sleep", ... 図中の (3) "resource": "step_one_sleep", "type": "web", "start": 1506841510052099800, "duration": 1419700146, "service": "sample1.php-step_one_sleep", "parent_id": 1824231734 }, { "trace_id": 1038524275, "span_id": 569978220, "name": "step_two_sleep", ... 図中の (2) "resource": "step_two_sleep", "type": "web", "start": 1506841511471800000, "duration": 1753799915, "service": "sample1.php-step_two_sleep", "parent_id": 1824231734 }, { "trace_id": 1038524275, "span_id": 1824231734, "name": "root_sleep", ... 図中の (1) "resource": "root_sleep", "type": "web", "start": 1506841510052099800, "duration": 3173500061, "service": "sample1.php" } ] ]
parent_id で指定している ID で複数関数の個々の処理時間と合計の処理時間を上図のように 1 つの Trace として扱いたい場合に指定が必要になる(これが肝だと思う)
上記に合わせて、1 つの Trace として扱いたい場合には trace_id を揃えておく必要がある(上記だと 1038524275 で揃えている)
start や duration については UNIX タイムを送信する必要がある(ナノ秒)※但し、上記 JSON の duration はマイクロ秒だよな…でも問題無さそう
Datadog へのポスト
生成された JSON は HTTP Put メソッドで Datadog Agent に同梱されている Trace Agent に送信する。sample1.php だと以下の部分。
public function finish($data) { echo json_encode([$data]); $endpoint = $this->agentEndpoint; $curl = curl_init($endpoint); $options = array( CURLOPT_HTTPHEADER => array( 'Content-Type: application/json', ), CURLOPT_CUSTOMREQUEST => "PUT", CURLOPT_POSTFIELDS => json_encode([$data]), ); curl_setopt_array($curl, $options); $result = curl_exec($curl); return $result; }
正常にリクエストが処理された場合にレスポンスは OK が返却されてステータスコードは 200 を返す。リクエストに異常がある場合には 500 エラーが返却される。
ということで… sample1.php をしばらく流してみると…
以下のように sample1.php をしばらく流しておくと以下のようにトレースデータが出力される。
何となくではあるが、プログラムの処理時間を確認することが出来ているつもり。
最後に
dd-trace-php を使ってみたいかど…
以下のように既にサードパーティ製ではあるが、PHP 向けのクライアントライブラリが公開されていた。
jcchavezs/dd-trace-php
http://ift.tt/2gd7Che
dd-trace-php - Datadog tracing in PHP
GitHub
github.com
README を参考にして以下のようなサンプルを作ってみたけど…手元の環境では Datadog Agent にデータが送信されてないので何でだろう…何でだろう…。
<?php require_once __DIR__ . "/vendor/autoload.php"; use DdTrace\Tracer; $tracer = Tracer::noop(); $span = $tracer->createRootSpan("sleep_test", "sleep_test", "sleep_test"); var_dump($span); try { $rand_sleep_time = rand(1500000,3000000); usleep($rand_sleep_time); $span->setMeta("sleep_time", $rand_sleep_time); } catch (RequestException $e) { $span->setError($e); } $span->finish(); ?>
元記事はこちら
「Tracing API を PHP で使って少しずつ理解する Datadog APM」
October 16, 2017 at 02:00PM
0 notes
Text
Real-User Monitoring (RUM) vs APM for PHP: When to Use What?
When it comes to optimizing PHP applications, performance monitoring tools play a pivotal role. Two of the most commonly used approaches are Real-User Monitoring (RUM) and Application Performance Monitoring (APM). While both serve the goal of improving application performance and user experience, they do so in different ways. Understanding their differences—and when to use each—can help PHP developers and DevOps teams make smarter decisions.
What is Real-User Monitoring (RUM)?
Real-User Monitoring (RUM) is a passive monitoring technique that tracks how actual users interact with your application in real time. It captures data directly from the user’s browser, including page load times, user locations, device types, browser versions, and session paths. This approach offers invaluable insight into the real-world performance of your PHP application across different environments and network conditions.
Pros of RUM:
Reflects real user experience
Tracks performance across regions, devices, and browsers
Helps identify frontend bottlenecks
Useful for UX and product teams
Limitations:
Doesn’t provide deep backend diagnostics Reactive in nature—only highlights issues after they affect users
What is APM?
Application Performance Monitoring (APM), on the other hand, takes a deeper, code-level view of your application. APM tools monitor server-side performance, database queries, external API calls, memory usage, and exception rates. This is especially valuable for debugging complex backend issues in PHP applications.
Pros of APM:
Provides detailed insights into application internals
Helps identify slow database queries, memory leaks, and bottlenecks
Proactive monitoring with alerting features
Great for developers and operations teams
Limitations:
May miss performance issues that only appear in the browser
Doesn’t account for real-world user variability (e.g., device or network)
RUM vs APM: When to Use What?
Think of RUM and APM as complementary tools rather than competing ones.
Use RUM when: You want to understand how your PHP application performs for real users across different environments. It’s perfect for tracking Core Web Vitals, optimizing frontend performance, and improving user satisfaction metrics.
Use APM when: You need to diagnose backend issues, monitor server health, or proactively track application performance trends. It's especially helpful during development, QA, or when troubleshooting live issues in production.
Best Practice: Combine RUM and APM
The most effective performance strategies don’t rely on just one tool. Combining RUM and APM gives you full-stack visibility—letting you see both the user’s experience and the backend’s performance. For PHP applications, this holistic view ensures faster troubleshooting, better user experience, and improved overall reliability.
Final Thoughts
Choosing between RUM and APM for your PHP application shouldn’t be an either-or decision. Each serves a distinct purpose and, when used together, provides a more comprehensive understanding of your application's performance. Whether you're scaling your product, optimizing frontend speed, or squashing backend bugs, knowing when to use what can make all the difference.
To get the most value, choose a monitoring platform that combines Real-User Monitoring, Application Performance Monitoring, and other capabilities like error tracking and infrastructure monitoring in one place. This unified approach streamlines performance insights, reduces blind spots, and empowers both frontend and backend teams to deliver a seamless user experience.
#application performance monitoring#application performance monitoring tools#apm tool#best apm tool#top apm tool#best rum tool#top rum tool#real user monitoring#real user monitoring tools#best real user monitoring#rum vs apm#rum vs apm tool#rum vs apm tool for php#rum vs apm tool for php monitoring#rum vs apm tool for php performance monitoring
0 notes