#spatialthinking
Explore tagged Tumblr posts
Visit Tumblr Blog
Explore Tumblr blogs with no restrictions, modern design and the best experience.
Last Seen Tumblr Blogs


Fun Fact
Tumblr Inc. is funded by 13 investors.
Text
Solar Site Suitability Mapping for Utility-Scale Projects
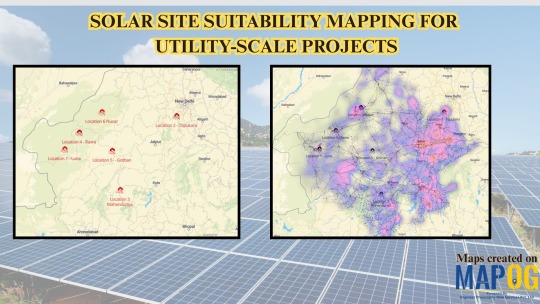
Efficient utility-scale solar project planning depends on identifying locations with high solar potential and strong connectivity to the power grid. A free and easy-to-use GIS platform, allows users to visualize and layer crucial spatial data such as Global Horizontal Irradiance (GHI), land use, flood zones, and transmission infrastructure to guide informed decision-making.
Why GIS for Solar Planning?
Not all sunlit land is viable for solar development. GIS allows users to answer essential questions like:
Are the target parcels located in high-GHI zones?
Are they safe from flood risks and near existing powerlines?
By using spatial filters and buffers, planners can eliminate unsuitable locations and focus on areas that are technically sound and logistically accessible.
Educational Significance
This exercise improves:
Application of theory to real-world energy planning
Spatial reasoning and geospatial literacy
Understanding of how GIS supports sustainable infrastructure
Step-by-Step Methodology
Start by creating a new story. Load key base layers like administrative boundaries, industrial land parcels, flood-prone areas, and transmission lines. Upload the GHI dataset and apply a heat map style to visualize solar intensity. Use buffer tools to define 2 km zones around rivers and 500 m zones around powerlines. Merge the buffers using merge polygon and apply filters to eliminate land parcels within flood zones or those far from the grid. Identify six high-GHI locations from the filtered results and mark them manually. Using “Add story” add points and add attributes such as GHI value, site name, and a brief description. Customize point icons and labels, then publish and share the final map using export features.

Use Case: Government-Led Solar Expansion for Industrial Parks
A state government launched an initiative to promote renewable energy adoption across its industrial parks. Planners evaluated land parcels across several districts by overlaying GHI, land use, and infrastructure data. After applying buffers and filters, they identified multiple sites ideal for solar installations within government-owned industrial zones. These findings supported investment proposals and policy decisions, accelerating the state’s green energy goals.
Wider Impact
Solar site suitability mapping with GIS strengthens clean energy transitions, minimizes environmental risks, and enhances collaboration among academic, private, and public stakeholders.
Conclusion
By combining intuitive GIS tools with structured spatial analysis, platforms like MAPOG enables data-driven solar planning that is efficient, inclusive, and scalable. It transforms raw location data into meaningful insights for real-world energy solutions.
#SolarMapping#GISforGood#MAPOG#CleanEnergy#FreeGIS#RuralElectrification#StudentProjects#SustainableDevelopment#GeographyEducation#SpatialThinking
0 notes
Photo

To move through modern art is to move through thought given structure.
#modernart#moma#artandarchitecture#contemporaryart#spatialthinking#designphilosophy#visualculture#artencounter#museumexperience#creativeexploration#urbanartspace#artperspective#ianfulgar
1 note
·
View note
Text
0 notes
Photo
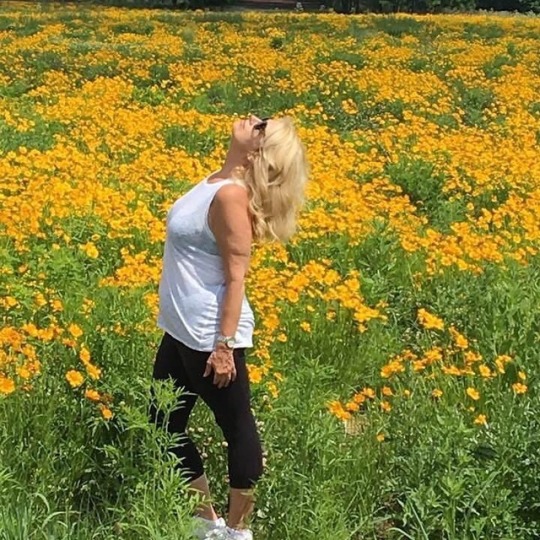
No filter needed💛💛💛 #summer2018 #wildfowers #ohiogram #pullover #fotogirl #parttimemodel #yellowflowers #yellowfields #thisamazesme #spatialthinking #cannotgetoverit #thatyellowthough #springhassprung2018 #grateful (at Centerville, Ohio)
#yellowfields#cannotgetoverit#thatyellowthough#ohiogram#summer2018#pullover#yellowflowers#spatialthinking#springhassprung2018#thisamazesme#parttimemodel#grateful#wildfowers#fotogirl
0 notes
Video
My cheeky chunkster Building blocks time 😀😀 #snellingclan #family #buildingblocks #building #littletown #spatialthinking #finemotorskills #cheekyboy
0 notes
Photo
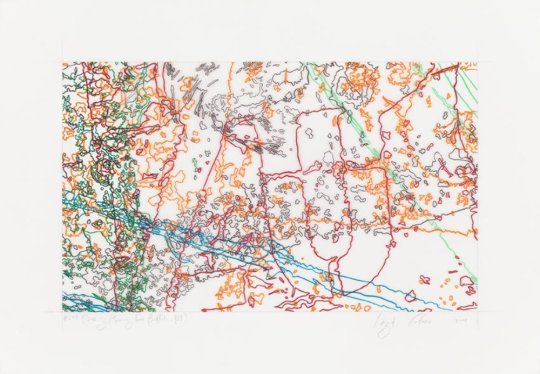


Ingrid Calame is a Los Angeles-based artist whose work attempts to document “the lowly visual remains ofhuman activity” by tracing everyday marks of human presence (Harmon 106). In the examples shown here,Calame has traced the marks found in the Los Angeles river bed—including graffiti, stains, and other humanmarks—and has then overlaid tracings that record the regularized physical movements of people who work inthe observatory. Calame has also done extensive tracings of skid marks at the Indianapolis Motor Speedway andareas of the trading floor at the New York Stock Exchange. In all her work is an awareness of the passingthrough of human activity, driven by a desire to record human presence. At the same time, however, her workemphasizes the difficulty of capturing that human presence in various spaces. My question then is: does this work fit in with a definition of “map”? Do these works count as “maps”? Yes : Katharine Harmon seems to think so; she argues that Calame’s work fits into a definition of maps as“simplified representations of the Earth’s surface or depictions of relationships between the components of aspace” and that it “documents the relationship between humans and their environments” (106). Might Calame’swork also fit under the heading of “new cartography” that Deleuze has observed? That is: “a mode of spatialthinking that sought not to trace out representations of the real, but to construct mappings that refigure relationsin ways that render alternate epistemologies and very different ways of world making” (Cobarrubias and Pickles40)? No : The artist herself claims that she does not see her work as “maps” but, regardless, it does arise from a“cartographic desire to know the world.” So should we then define a “map” as any document or work of art thatarises from this similar desire? How is a “cartographic” desire different from any other desire to know theworld? https://www.youtube.com/watch?v=UfZpzoRX84w&ab_channel=JamesCohanGallery
1 note
·
View note
Text
#10km3x2 map #biodiversity #SpatialThink #m3GPS #nCoV https://t.co/U957Zaj1UM @SDGaction #SDG6 #reproductiveRights map #rape https://t.co/kQtIggGUXU and see https://t.co/II53LoWImF standardize @isostandards #URCPP #anomaly #risk #EarlyWarning #foodSecurity #waterSecurity map map https://t.co/ur8d7NZgZB
— Tamra E. Raven (@tamraraven) February 10, 2020
0 notes
Link
tesler + mendelovitch develops a bendable wooden textile #industrialdesign #design #designthinking #spatialthinking #materials https://t.co/IG4Y3LcPSo
— Dennis L. Kappen (@3D_Ideation) June 26, 2019
June 26, 2019 at 11:49PM
0 notes
Photo
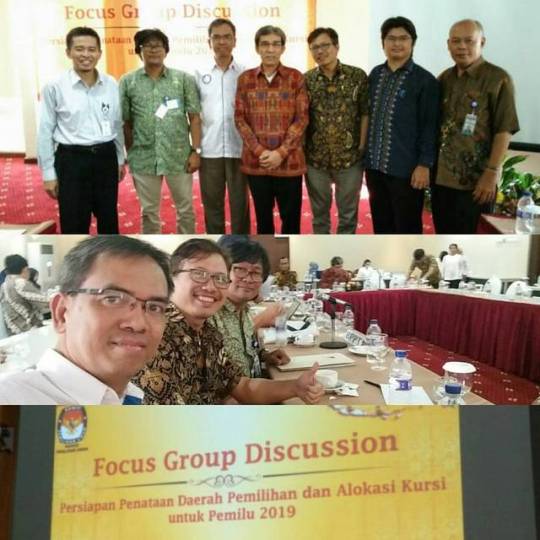
Mengikuti FGD persiapan penataan Daerah Pemilihan dan alokasi kursi untuk Pemilu 2019, dipimpin oleh Komisioner KPU bapak Hadar Nafis Gumay. . Banyak "ilmu baru" didapat dalam acara ini. Ide yang berloncatan adalah menerapkan ilmu sosial politik dalam Spatial Auto Correlation dan dilengkapi dengan Spatial Multi-Criteria Evaluation untuk pengembangan dalam menentukan Daerah Pemilihan tingkat Provinsi dan Kabupaten/Kota. . #spatialanalysis #spatialthinking
0 notes