#📊📈📉
Text
glow

#i know this is implying it'll be a ship piece but i actually dont know where i wanna go with this!#im just rly happy w this sketch lmao#tangled the series#cassandra tangled#cassandra tts#feel like i should stop posting wips it's such a double-edged sword#its that dumb psychological thing like 'glad i shared this! hmm i kinda wanna move on to something else now'#and then nothing ends up getting polished! ⚖🎢📈📉📊#xanswips
10 notes
·
View notes
Text


💙💙💙
#a week off meds now & enjoying the intensity of everything sooo much....i want to find the right language to describe this whole thing w/o#having to settle for “hypomanic” and “depressive”#not even Necessarily to avoid psychiatric language though thats a bonus but just cause theyre clunky and 0% evocative of what its actually#like to experience life like this 📈📉📈📉📈📉📊📈📉📊📊📈📉
4 notes
·
View notes

Text
7 Secrets Every Aspiring Data Scientist Should Know

In recent years, the field of data science has exploded in popularity, driven by the increasing availability of data and the growing demand for professionals who can analyze and interpret this information. As businesses and organizations strive to make data-driven decisions, the role of the data scientist has become more critical than ever. For those looking to break into this exciting field, several key insights and strategies can help pave the way to a successful career. Here are seven secrets every aspiring data scientist should know.
Master the Fundamentals
Before diving into the more glamorous aspects of data science, it’s essential to have a strong grasp of the fundamentals. This includes understanding basic concepts in statistics, probability, and linear algebra. A solid foundation in these areas will not only help you understand the algorithms and models you’ll be working with but also enable you to troubleshoot and refine them effectively.
Statistics and Probability
Understanding statistical measures like mean, median, variance, and standard deviation is crucial. Probability theory helps in understanding distributions, hypothesis testing, and statistical significance, which are integral to data analysis.
Linear Algebra
Linear algebra is the backbone of many data science algorithms. Concepts like vectors, matrices, eigenvalues, and eigenvectors are essential for understanding complex models, especially in machine learning and deep learning.
Develop Strong Programming Skills
Proficiency in programming is a must for any data scientist. Python and R are the most popular languages in the field due to their extensive libraries and frameworks that support data manipulation, analysis, and visualization.
Python
Python is favored for its simplicity and readability. Libraries such as NumPy, pandas, Scikit-learn, and TensorFlow are instrumental for data manipulation, statistical modeling, and machine learning.
R is particularly strong in statistical analysis and visualization. Packages like ggplot2, dplyr, and caret are powerful tools for creating detailed and informative visualizations and performing robust statistical analyses.
Gain Practical Experience
While theoretical knowledge is important, hands-on experience is invaluable. Engaging in practical projects, internships, and competitions can help solidify your understanding and provide tangible proof of your skills.
Kaggle Competitions
Participating in Kaggle competitions can provide exposure to real-world data problems and allow you to apply and test your skills against a global community.
Internships and Projects
Internships offer practical experience and insights into the workings of the industry. Working on real-world projects, either through internships or independently, helps in understanding the end-to-end process of data science workflows.
Understand Data Cleaning and Preparation
A significant portion of a data scientist’s time is spent on data cleaning and preparation. Raw data is often messy, incomplete, or inconsistent, and must be cleaned and transformed before analysis.
Data cleaning involves handling missing values, correcting errors, and ensuring consistency. Techniques include imputation, outlier detection, and normalization.
Data Transformation
Data transformation includes scaling, encoding categorical variables, and feature engineering. Properly prepared data is crucial for building accurate and reliable models.
Learn Machine Learning Algorithms
Machine learning is at the heart of data science. Understanding various machine learning algorithms and knowing when and how to apply them is critical.
Supervised Learning
Supervised learning algorithms, such as linear regression, decision trees, and support vector machines, are used
when you have unlabeled data. These algorithms identify patterns and structures in the data.
Deep Learning
Deep learning, a subset of machine learning, uses neural networks with many layers (hence "deep"). It is particularly effective for tasks like image and speech recognition.
Cultivate Communication Skills
Data scientists must be able to communicate their findings effectively to stakeholders who may not have a technical background. Strong communication skills are essential for explaining complex concepts clearly and concisely.
Data Visualization
Data visualization is a powerful tool for communicating insights. Tools like Tableau, Power BI, and Matplotlib can help you create compelling visualizations that tell a story with data.
presentation and Storytelling
Being able to present your findings in a compelling narrative is crucial. Focus on clarity, conciseness, and relevance to your audience’s needs.
Stay Curious and Keep Learning
The field of data science is constantly evolving, with new techniques, tools, and algorithms being developed regularly. A successful data scientist must stay curious and committed to continuous learning.
Online Courses and Certifications
Platforms like Coursera, edX, and Udacity offer courses and certifications in data science and related fields. Continuous learning helps you stay updated with the latest trends and technologies.
Research and Reading
Following academic research papers, blogs, and forums can provide insights into cutting-edge developments. Engaging with the data science community through conferences and meetups can also be beneficial.
Conclusion
Embarking on a career in data science can be both exciting and challenging. By mastering the fundamentals, developing strong programming skills, gaining practical experience, understanding data cleaning and preparation, learning machine learning algorithms, cultivating communication skills, and committing to continuous learning, you can position yourself for success in this dynamic field. Remember, the journey of a data scientist is a marathon, not a sprint. Stay curious, keep learning, and enjoy the process of uncovering insights from data.
Additional Resources for Aspiring Data Scientists
To help you on your journey, here are some additional resources that can provide valuable knowledge and experience:
Books
"Python Data Science Handbook" by Jake VanderPlas
"Hands-On Machine Learning with Scikit-Learn, Keras, and TensorFlow" by Aurélien Géron
"Deep Learning" by Ian Goodfellow, Yoshua Bengio, and Aaron Courville
Online Courses
"Machine Learning" by Andrew Ng on Coursera
"Data Science MicroMasters" by UC San Diego on edX
"Deep Learning Specialization" by Andrew Ng and team on Coursera
Communities and Forums
Kaggle: Participate in competitions and discussions
Stack Overflow: Ask questions and share knowledge
Data Science Reddit: Engage with a community of data enthusiasts
Practical Steps to Get Started
Build a Portfolio: Start by working on small projects and gradually take on more complex ones. Create a portfolio showcasing your work on platforms like GitHub.
Network: Attend meetups, conferences, and webinars to connect with other data professionals. Networking can open doors to job opportunities and collaborations.
Seek Mentorship: Find a mentor who can provide guidance and feedback. A mentor can help you navigate the challenges of starting a career in data science.
Stay Updated: Follow influential data scientists on social media, subscribe to newsletters, and regularly read blogs to keep up with the latest trends and best practices.
Data science is a field that offers endless opportunities to learn and grow. Whether you are just starting out or looking to advance your career, the key is to stay motivated and persistent. Embrace challenges as learning opportunities and always strive to improve your skills. With dedication and the right approach, you can achieve success in the exciting world of data science.
#DataScienceSecret 1: The real magic often lies in data preprocessing. Clean#well-organized data can outperform even the most complex algorithms. Spend extra time here! 🧹📊#DataScienceSecret 2: Understanding the business problem is half the battle. Great data scientists are also great communicators and problem#DataScienceSecret 3: Feature engineering can make or break your model. Creativity in creating new features from existing data is a powerful#DataScienceSecret 4: Model interpretability is crucial. Simpler models are often better because they’re easier to explain and trust. 🌟📉#DataScienceSecret 5: Ensemble methods can significantly boost performance. Combining multiple models can lead to more robust and accurate p#DataScienceSecret 6: Cross-validation is key to a robust model. Always validate your model on unseen data to avoid overfitting. 🔄📈#DataScienceSecret 7: Domain knowledge is invaluable. The best data scientists understand the nuances of the field they’re working in. 🌍📚#DataScienceSecret 8: Visualization is your best friend. Effective data visualization can reveal insights that numbers alone cann
1 note
·
View note
Text
A comprehensive list of 100+ technical indicators.
നൂറിൽ അധികം ടെക്നിക്കൽ ഇൻഡിക്കേറ്ററുകളെ കുറിച്ചുള്ള വിവരങ്ങൾ അടങ്ങിയ പോസ്റ്റ്.
0 notes
Text
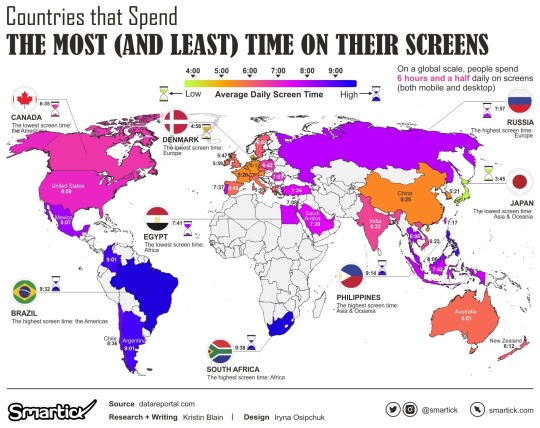
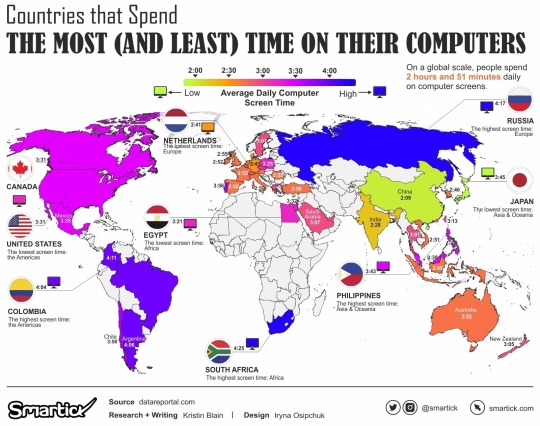
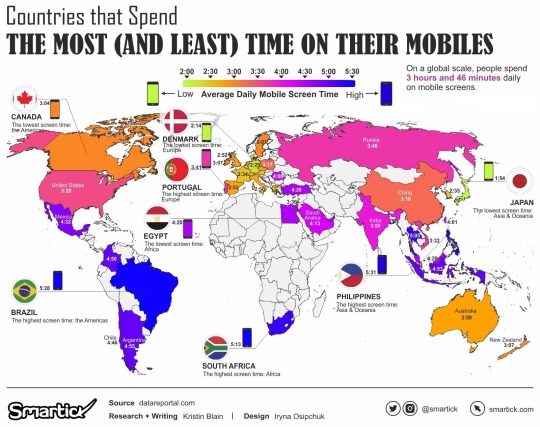
The Countries Most Addicted To Screen Time, Mapped
— Jared Russo | Digg.Com |
You'll never guess which country is the most obsessed with spending time online, just glued to their phones and desktops. The internet is addicting.
The most significant thing to happen to the human race this millennium (so far) has been the proliferation and explosion of the internet, particularly through smart phones. Being glued to devices that are small computers with screens bigger than most hands is how many people interact with the world, work at their jobs, order food, meet their loved ones and manage their finances.
But who is the most addicted to their screens? And is that mostly just scrolling through TikTok?
Smartick gathered data from DataReportal.com on digital behavior to put together maps showing who's the most online, and, to a lesser extent, the most online.
Key Findings:
South Africa 🇿🇦 spends the most time on desktop and mobile, averaging nearly 10 hours a day per internet user. Brazil 🇧🇷, Philippines 🇵🇭, Argentina 🇦🇷 and Colombia also average more than nine hours a day.
South Africa 🇿🇦 also wins the award for most internet usage via a computer, with almost 4.5 hours per day. Russia 🇷🇺, 🇧🇷, Argentina 🇦🇷 and Columbia 🇨🇴 were also quite close the four hour mark.
The Philippines 🇵🇭 spends the most time on their phones, averaging more than 5.5 hours per day, per user, followed closely by Brazil 🇧🇷, Thailand 🇹🇭, South Africa 🇿🇦 and Indonesia 🇮🇩.
#Tech Neck#Digg.Com#Screen 📺 Time Spending#Smartick | Data 📉 📊 📈 | DataReportal.com#Countries Around the World 🌎#Addiction#Tablets | Phones 📱 | Computers 💻 🖥️
1 note
·
View note
Text
i can make pictures easily😀😃😄😁😆😅🤣😂🙂🙃🫠😉😊😇🥰😍🤩😘😗☺️😚😙🥲😋🤩😘😗☺️😚😙🥲😋😛😜🤪😝🤑🤗🤭🫢🫣🤫🤔🫡🤐🤨😐😑😶🫥😶🌫️😏😒🙄😬😮💨🤥🫨🙂↔️🙂↕️😌😔😪🤤😴😷🤒🤕🤢🤮🤧🥵🥶🥴😵😵💫🤯🤠🥳🥸😎🤓🧐😕🫤😟🙁☹️😮😯😲😳🥺🥹😦😧😨😰😥😢😭😱😣😣😞😓😩😫🥱😤😡😠🤬😈👿💀☠️💩🤡👹👺👻👽👾🤖😺😸😹😻😼😽🙀😿😾🙈🙉🙊💋💌💘💝💖💗💓💞💕💟❣️💔❤️🔥❤️🩹❤️🩷🧡💛💚💙🩵💜🤎🖤🩶🤍💯💢💥💫💦💨🕳💣💬🗨🗯💭💤👋🤚🖐✋️🖖🫱🫲🫳🫴🫷🫸👌🤌🤏✌️🤞🫰🤟🤘🤙👈👉👆🖕👇☝️🫵👍👎✊️👊🤛🤜👏🙌🫶👐🤲🤝🙏✍️💅🤳💪🦾🦿🦵🦶👂🦻👃🧠🫀🫁🦷🦴👀👁👅👄🫦👶🧒👦👧🧑👱👨🧔♂️🧔♀️🧔👨🦰👨🦱👨🦳👨🦲👩👩🦰🧑🦰👩🦱🧑🦱👩🦳🧑🦳👩🦲🧑🦲👱♂️👱♀️👴👵🧓🙍♂️🙍♀️🙍🙎♂️🙎♀️🙎🙅♂️🙅♀️🙅🙆♂️🙆♀️🙆💁♂️💁♀️💁🙋♂️🙋♀️🙋🧏♂️🧏♀️🧏🙇♂️🙇♀️🙇🤦♂️🤦♀️🤦🤷♂️🤷♀️🤷👨⚕️👩⚕️🧑⚕️👨🎓👩🎓🧑🎓👨🏫👩🏫🧑🏫👨⚖️👩⚖️🧑⚖️👨🌾👩🌾🧑🌾👨🍳👩🍳🧑🍳👨🔧👩🔧🧑🔧👨🏭👩🏭🧑🏭👨💼👩💼🧑💼👨🔬👩🔬👨💻👩💻🧑💻👨🎤👩🎤🧑🎤👨🎨👩🎨🧑🎨👨✈️👩✈️🧑✈️👨🚀👩🚀🧑🚀👨🚒👩🚒🧑🚒👮♂️👮♀️👮🕵♂️🕵♀️🕵💂♂️💂♀️💂🥷👷♂️👷♀️👷🫅🤴👸👳♂️👳♀️👳👲🧕🤵♂️🤵♀️🤵👰♂️👰♀️👰🤰🫃🫄🤱👨🍼👩🍼🧑🍼👼🎅🤶🧑🎄🦸♂️🦸♀️🦸🦹♂️🦹♀️🦹🧙♂️🧙♀️🧙🧚♂️🧚♀️🧚🧛♂️🧛♀️🧛🧜♂️🧜♀️🧜🧝♂️🧝♀️🧝🧞♂️🧞♀️🧞🧟♂️🧟♀️🧟🧌💆♂️💆♀️💆💇♂️💇♀️💇🚶♂️🚶♂️➡️🚶♀️🚶♀️➡️🚶🚶➡️🧍♂️🧍♀️🧍🧎♂️🧎♂️➡️🧎♀️🧎♀️➡️🧎🧎➡️👨🦯👨🦯➡️👩🦯👩🦯➡️🧑🦯🧑🦯➡️👨🦼👨🦼➡️👩🦼👩🦼➡️🧑🦼🧑🦼➡️👨🦽👨🦽➡️👩🦽👩🦽➡️🧑🦽🧑🦽➡️🏃♂️🏃♂️➡️🏃♀️🏃♀️➡️🏃🏃➡️🕺💃🕴👯♂️👯♀️👯🧖♂️🧖♀️🧖🧗♂️🧗♀️🧗🤺🏇⛷️🏂🏌♂️🏌♀️🏌🏄♂️🏄♀️🏄🚣♂️🚣♀️🚣🏊♂️🏊♀️🏊⛹️♂️⛹️♀️⛹️🏋♂️🏋♀️🏋🚴♂️🚴♀️🚴🚵♂️🚵♀️🚵🤸♂️🤸♀️🤸🤼♂️🤼♀️🤼🤽♂️🤽♀️🤽🤾♂️🤾♀️🤾🤹♂️🤹♀️🤹🧘♂️🧘♀️🧘🛀🛌👬👫👭🧑🤝🧑👨❤️💋👨👩❤️💋👨👩❤️💋👩💏👨❤️👨👩❤️👨👩❤️👩💑👩👩👦👨👩👧👩👩👧👦👨👩👦👦👨👩👧👧👨👦👩👦🗣👤👥️🫂👣🧑🧑🧒🧑🧑🧒🧒🧑🧒🧑🧒🧒🐵🐒🦍🦧🐶🐕🦮🐕🦺🐩🐺🦊🦝🐱🐈🐈⬛🦁🐯🐅🐆🐴🫎🫏🐎🦄🦓🦌🦬🐮🐂🐃🐄🐷🐖🐗🐽🐏🐑🐐🐪🐫🦙🦒🐘🦣🦏🦛🐭🐁🐀🐹🐰🐇🐿🦫🦔🦇🐻🐨🐻❄️🐼🦥🦦🦨🦘🦡🐾🦃🐔🐓🐣🐤🐥🐦🐧🕊🦅🦆🦢🦉🦤🪶🦩🦚🦜🪽🐦⬛🪿🐦🔥🐸🐊🐢🦎🐍🐲🐉🦕🦖🐳🐋🐬🦭🐟🐠🐡🦈🐙🦀🦞🦐🦑🐚🪸🪼🐌🦋🐛🐜🐝🪲🐞🦗🕷🪳🕸🦂🦟🪰🪱🦠💐🌸💮🪷🏵🌹🥀🌺🌻🌼🌷🪻⚘️🌱🪴🌲🌳🌴🌵🌾🌿☘️🍀🍁🍂🍃🪹🪺🍇🍈🍉🍊🍋🍌🍍🥭🍎🍏🍐🍑🍒🍓🫐🥝🍅🫒🥥🍋🟩🥑🍆🥔🥕🌽🌶🫑🥒🥬🥦🧄🧅🍄🥜🫘🌰🫚🫛🍄🟫🍞🥐🥖🫓🥨🥯🥞🧇🧀🍖🍗🥩🥓🍔🍟🍕🌭🥪🌮🌯🫔🥙🧆🥚🍳🥘🍲🫕🥣🥗🍿🧈🧂🥫🍱🍘🍙🍚🍛🍜🍝🍠🍢🍣🦪🍤🍥🥮🍡🥟🥠🥡🍦🍧🍨🍩🍪🎂🍰🧁🥧🍫🍬🍭🍮🍯🍼🥛☕️🫖🍵🍶🍾🍷🍸🍹🍺🍻🥂🥃🫗🥤🧋🧃🧉🧊🥢🍽🍴🥄🔪🫙🏺🌍🌎🌏🌐🗺🧭🏔⛰️🌋🗻🏕🏖🏜🏝🏞🏟🏛🏗🧱🪨🪵🛖🏘🏚🏠🏡🏢🏣🏤🏥🏦🏨🏩🏪🏫🏬🏭🏯🏰💒🗼🗽⛪️🕌🛕🕍⛩️🕋⛲️⛺️🌁🌃🏙🌄🌅🌆🌇🌉♨️🎠🛝🎡🎢💈🎪🚂🚝🚄🚅🚆🚇🚈🚉🚊🚝🚞🚋🚌🚍🚎🚐🚑🚒🚓🚔🚕🚖🚗🚘🚙🛻🚚🚛🚜🏎🏍🛵🦽🦼🛺🚲🛴🛹🛼🚏🛣🛤🛢⛽️🛞🚨🚥🚦🛑🚧⚓️🛟⛵️🛶🚤🛳⛴️🛥🚢✈️🛩🛫🛬🪂💺🚁🚟🚠🚡🛰🚀🛸🛎🧳⌛️⏳️⌚️⏰️⏱️⏲️🕰🕛🕧🕐🕜🕑🕝🕒🕞🕓🕟🕔🕠🕕🕡🕖🕢🕗🕣🕘🕤🕙🕥🕚🕦🌑🌒🌓🌔🌕🌖🌗🌘🌙🌚🌛🌜🌡☀️🌝🌞🪐⭐️🌟🌠🌌☁️⛅️⛈️🌤🌥🌦🌧🌨🌩🌪🌫🌬🌀🌈🌂☂️☔️⛱️⚡️❄️☃️⛄️☄️🔥💧🌊🎃🎄🎆🎇🧨✨️🎈🎉🎊🎋🎍🎎🎏🎐🎑🧧🎀🎁🎗🎟🎫🎖🏆🏅🥇🥈🥉⚽️⚾️🥎🏀🏐🏈🏉🎾🥏🎳🏏🏑🏒🥍🏓🏸🥊🥋🥅⛳️⛸️🎣🤿🎽🎿🛷🥌🎯🪀🪁🎱🔮🪄🧿🪬🎮🕹🎰🎲🧩🧸🪅🪩🪆♠️♥️♦️♣️♟️🃏🀄🎴🎭🖼🎨🧵🪡🧶🪢👓🕶🥽🥼🦺👔👕👖🧣🧤🧥🧦👗👘🥻🩱🩲🩳👙👚🪭👛👜👝🛍🎒🩴👞👟🥾🥿👠👡🩰👢🪮👑👒🎩🎓🧢🪖⛑️📿💄💍💎🔇🔈🔉🔊📢📣📯🔔🔕🎼🎵🎶🎙🎚🎛🎤🎧📻🎷🪗🎸🎹🎺🎻🪕🥁🪘🪇🪈📱📲☎️📞📟📠🔋🪫🔌💻🖥🖨⌨️🖱🖲💽💾💿📀🧮🎥🎞📽🎬📺📷📸📹📼🔍🔎🕯💡🔦🏮🪔📔📕📖📗📘📙📚📓📒📃📜📄📰🗞📑🔖🏷💰🪙💴💵💶💷💸💳🧾✉️📧📨📩📤📥📦📫📪📬📭📮🗳✏️✒️🖋🖊🖌🖍📝💼📁📂🗂📅📆🗒🗓📇📈📉📊📋📌📍📎🖇📏📐✂️🗃🗄🗑🔒🔓🔏🔐🔑🗝🔨🪓⛏️⚒️🛠🗡⚔️🔫🪃🏹🛡🪚🔧🪛🔩⚙️🗜⚖️🦯🔗⛓️⛓️💥🪝🧰🧲🪜⚗️🧪🧫🧬🔬🔭📡💉🩸💊🩹🩼🩺🩻🚪🛗🪞🪟🛏🛋🪑🚽🪠🚿🛁🪤🪒🧴🧷🧹🧺🧻🪣🧼🫧🪥🧽🧯🛒🚬⚰️🪦⚱️🗿🪧🪪🏧🚮🚰♿️🚹🚺🚻🚼🚾🛂🛃🛄🛅⚠️🚸⛔️🚫🚳🚭🚯🚱🚷📵🔞☢️☣️⬆️↗️➡️↘️⬇️↙️⬅️↖️↕️↔️↩️↪️⤴️⤵️🔃🔄🔙🔚🔛🔜🔝🛐⚛️🕉✡️☸️☯️✝️☦️☪️☮️🕎🔯🪯♈️♉️♊️♋️♌️♍️♎️♏️♐️♑️♒️♓️⛎️🔀🔁🔂▶️⏩️⏭️⏯️◀️⏪️⏮️🔼⏫️🔽⏬️⏸️⏹️⏺️⏏️🎦🔅🔆📶🛜📳📴♀️♂️⚧️✖️➕️➖️➗️🟰♾️‼️⁉️❓️❔️❕️❗️〰️💱💲⚕️♻️⚜️🔱📛🔰⭕️✅️☑️✔️❌️❎️➰️➿️〽️✳️✴️❇️©️®️™️#️⃣*️⃣0️⃣1️⃣2️⃣3️⃣4️⃣5️⃣6️⃣7️⃣8️⃣9️⃣🔟🔠🔡🔢🔣🔤🅰️🆎️🅱️🆑️🆒️🆓️ℹ️🆔️Ⓜ️🆕️🆖️🅾️🆗️🅿️🆘️🆙️🆚️🈁️🈂️🈷️🈶️🈯️🉐️🈹️🈚️🈲️🉑️🈸️🈴️🈳️㊗️㊙️🈺️🈵️🔴🟠🟡🟢🔵🟣🟤⚪️⚫️🟥🟧🟨🟩🟦🟪🟫⬛⬜️◼️◻️◾️◽️▪️▫️🔶️🔷️🔸️🔹️🔺️🔻💠🔘🔲🔳🏁🚩🏴🏳🏳️🌈🏳️⚧️🏴☠️🇦🇨🇦🇩🇦🇪🇦🇫🇦🇬🇦🇮🇦🇱🇦🇲🇦🇴🇦🇶🇦🇷🇦🇸🇦🇹🇦🇺🇦🇼🇦🇽🇦🇿🇧🇦🇧🇧🇧🇩🇧🇪🇧🇫🇧🇬🇧🇭🇧🇮🇧🇯🇧🇱🇧🇲🇧🇳🇧🇴🇧🇶🇧🇷🇧🇸🇧🇹🇧🇻🇧🇼🇧🇾🇧🇿🇨🇦🇨🇨🇨🇩🇨🇫🇨🇬🇨🇭🇨🇮🇨🇰🇨🇱🇨🇲🇨🇳🇨🇴🇨🇵🇨🇷🇨🇺🇨🇻🇨🇼🇨🇽🇨🇾🇨🇿🇩🇪🇩🇬🇩🇯🇩🇰🇩🇲🇩🇴🇩🇿🇪🇦🇪🇨🇪🇪🇪🇬🇪🇭🇪🇷🇪🇸🇪🇹🇪🇺🇫🇮🇫🇯🇫🇰🇫🇲🇫🇴🇫🇷🇬🇦🇬🇧🇬🇩🇬🇪🇬🇫🇬🇬🇬🇭🇬🇮🇬🇱🇬🇲🇬🇳🇬🇵🇬🇶🇬🇷🇬🇸🇬🇹🇬🇺🇬🇼🇬🇾🇭🇰🇭🇲🇭🇳🇭🇷🇭🇹🇭🇺🇮🇨🇮🇩🇮🇪🇮🇲🇮🇳🇮🇴🇮🇶🇮🇷🇮🇸🇮🇹🇯🇪🇯🇲🇯🇴🇯🇵🇰🇪🇰🇬🇰🇭🇰🇮🇰🇲🇰🇳🇰🇵🇰🇷🇰🇼🇰🇾🇰🇿🇱🇦🇱🇧🇱🇨🇱🇮🇱🇰🇱🇷🇱🇸🇱🇹🇱🇺🇱🇻🇱🇾🇲🇦🇲🇨🇲🇩🇲🇪🇲🇫🇲🇬🇲🇭🇲🇰🇲🇱🇲🇲🇲🇳🇲🇴🇲🇵🇲🇶🇲🇷🇲🇸🇲🇹🇲🇺🇲🇻🇲🇼🇲🇽🇲🇾🇲🇿🇳🇦🇳🇨🇳🇪🇳🇫🇳🇬🇳🇮🇳🇱🇳🇴🇳🇵🇳🇷🇳🇺🇳🇿🇴🇲🇵🇦🇵🇪🇵🇫🇵🇬🇵🇭🇵🇰🇵🇱🇵🇲🇵🇳🇵🇷🇵🇸🇵🇹🇵🇼🇵🇾🇶🇦🇷🇪🇷🇴🇷🇸🇷🇺🇷🇼🇸🇦🇸🇧🇸🇨🇸🇩🇸🇪🇸🇬🇸🇭🇸🇮🇸🇯🇸🇰🇸🇱🇸🇲🇸🇳🇸🇴🇸🇷🇸🇸🇸🇹🇸🇻🇸🇽🇸🇾🇸🇿🇹🇦🇹🇨🇹🇩🇹🇫🇹🇬🇹🇭🇹🇯🇹🇰🇹🇱🇹🇲🇹🇳🇹🇴🇹🇷🇹🇹🇹🇻🇹🇼🇹🇿🇺🇦🇺🇬🇺🇲🇺🇳🇺🇸🇺🇾🇺🇿🇻🇦🇻🇨🇻🇪🇻🇬🇻🇮🇻🇳🇻🇺🇼🇫🇼🇸🇽🇰🇾🇪🇾🇹🇿🇦🇿🇲🇿🇼🏴🏴🏴
3K notes
·
View notes
Link
The Power🔥💥 of Your Subconscious Mind
@nexzyro Arv King
The book is really satisfied u can buy the book my link and read and change the Your life...
.
.https://amzn.to/44pjy5K
.
1 note
·
View note
Photo

Cisco Systems (CSCO) getta le basi per una nuova possibile Bull Run. Riportiamo nelle immagini gli elementi a supporto della teoria e le condizioni necessarie affinché si verifichi. 🤔 Qual’è la tua View su CSCO? - - - - - - - - - - - - 📍Coneicom è a Forlì, incontriamoci per parlarne insieme! - - - - - - - - - - - - 📣 Se ti è piaciuto questo post, seguici per maggiori contenuti: 👉@coneicom 👉@coneicom 👉@coneicom - - - - - - - - - - - - 🔎 se vuoi conoscerci meglio, visita il nostro link in bio o visita il nostro sito: www.coneicom.com - - - - - - - - - - - - 📣 Please, no investment advice! Il nostro obiettivo è l’educazione volta al confronto. - - - - - - - - - - - - #technicalanalysis📊📈📉 #csco #analisitecnica #bullrun #coneicom https://www.instagram.com/p/CnXlxErsj-a/?igshid=NGJjMDIxMWI=
0 notes
Video
undefined
tumblr
Always research and understand the business, industry and company in which you are investing.
The importance of research may not be clear in a bull market when all stocks are rising.
But when the bear market arrives as part of the natural cycle, it is only your research and knowledge that will give you conviction to hold on to your investment and make the right moves.
If you do not have the time and inclination for research, find a trusted financial advisor.
Get in touch today or DM me.
Email: [email protected]
Website:- https://profinancial.solutions
Phone: +971 555342042
0 notes
Photo
Trade active Monitor your money management 💰💲 #forexhaber #forexlifestyle📊📉📈💴💵💷💸 #forexlearning #eforex #forexkings #forexkenya #forexking #gforexleica #gforexsignals #jforex3 #aforex #aforexxibanorte #aforexxi #aforexes #aforexspecies #forexo #forexonline #forexoneminutestrategy #forexoptions #forexonlinetrading #forexworld #forexwithbukky #forexwealth #forexworldwide #forexwomen #forexrobot https://www.instagram.com/p/CmbcJk-NpKr/?igshid=NGJjMDIxMWI=
#forexhaber#forexlifestyle📊📉📈💴💵💷💸#forexlearning#eforex#forexkings#forexkenya#forexking#gforexleica#gforexsignals#jforex3#aforex#aforexxibanorte#aforexxi#aforexes#aforexspecies#forexo#forexonline#forexoneminutestrategy#forexoptions#forexonlinetrading#forexworld#forexwithbukky#forexwealth#forexworldwide#forexwomen#forexrobot
0 notes
Note
Hi I just wanna say thank you so much for your Tangled Hector art, you're the only one keeping the weird old sexy man flame alive in this fandom
!!! thank you sm, anon 🥺💖 this fandom is v small and quiet these days so your message is rly encouraging!!
i'd honestly thank @pennumbra - her hector art/takes rewired my brain and if it weren't for her i most likely would have migrated from this fandom years ago (hi ilu bb LMAO)
#i see an opportunity to stan my gf i tAKE IT 💘🐺#fr though if birb wasnt rbing and/or leaving such nice comments on my art i would not have stuck around !!#not even in an 🧮📊engagement📉📈 sort of way - just rly abt making connection/creating smthn others enjoy in an otherwise quiet space#im forever grateful to birb for that!! at the time i was sorta in-between fandoms and in a weird limbo#and making a near instant connection w/ her + realizing we're on the same wavelength#had me stay in the fandom LMAO so it makes me happy to see other people appreciating my art/hector too#this side char with like <10 speaking lines in a niche disney show means so much to me#so tldr ik i ended up rambling but have a lot of (positive) feelings abt this and ty!!!#interactions / msgs like this rly go a long way! esp when irl things are rough- at least art-wise i can feel hopeful/motivated 🖍👶#also go look at her art if u havent yet!!! 📣💖🐺🌙#so ty anon!!! 💖💖💖#xanreplies#pennumbra#((i love my gf and our 84 hector AUs lmao))#me always: is this a chance to ramble 🎙🎤🗣🗣🗣🎙🎤
7 notes
·
View notes
Text

I have SO many 😅😆 unfinished 🪓📉🖊️animatics! 🔎 Help me 🫡✂️ pick one to work 🖌️ on ☺️📈📊
[Twitch link]
317 notes
·
View notes
Text
🏦🍗Happy BANKS-giving🍗🏦 to all my 💵 finance 🅱️itches & 🅱️ros 🔥today 📅 might be a bank holiday 🎉but it’s also a 👐SPANK 🙌 HOLIDAY 🤤🫣 it’s time ⏰ to get your crush’s ⬆️ INTEREST ⬆️ rates UP 🔝 to handle INFLATION 👀🍆 so you can 🦃GOBBLE🍽️ that 🍑 and get STUFFED 🥴 by your favorite 💦LARGE DEPOSITOR💦 remember to PUT ➡️ that TURKEY 🦃 in your OVEN 🔥 and CALL ☎️ your hottest 🥵 SLUTS 💋 to lock 🔒 in that sexy 👅 bid-ASS SPREAD 🤸♂️ finish that CUMkin🎃 PIE 🥧 and be THANKFUL 👆🙏 nonperforming📉loans aren’t the 🅾️nly thing getting SUBBED 😈⛓️tonite 💯
📬 send 📩 this to your 🔟 highest 📈investors📊 to THANK 🫶 BANK 💰 and YANK ✊💦them
#thanksgiving#copypasta#interest rates#finance#jay speaks#I’m sorry I think this might be the worst thing I have ever typed
562 notes
·
View notes
Text
i just imagine childe, dottore and pantalone to be real bachelors in snezhnaya, like so many people fawn over them and literally want to be with them, would 100% sell their souls to date them, probably also think about how on earth ?? they can still be single when in reality they're so fucking bitchless due to them being seriously crazy in the head. like one keeps talking about the ✨thrill😏✨ of battle and nuts to it probably, the other one doesn't see the difference between an actual human being and stonks📈📊📉and the other probably cooks people🧙🏻
242 notes
·
View notes
Text

Technical Analysis in Stock Market Trading:
Technical analysis is a method employed by traders to evaluate and predict future price movements based on historical market data. This approach revolves around the analysis of price charts, patterns, and trading volumes, aiming to uncover potential trends and turning points. Key components of technical analysis include:
Price Charts:
Utilizing various chart types (candlestick, line, bar) to visualize historical price movements.
Identifying trends, support, and resistance levels through chart analysis.
Indicators:
Implementing technical indicators like moving averages, Relative Strength Index (RSI), and Moving Average Convergence Divergence (MACD).
These indicators provide quantitative insights into market momentum, overbought or oversold conditions, and potential trend reversals.
Trendlines:
Drawing trendlines to highlight the direction of the market.
Recognizing breakout or breakdown points that may signify significant price movements.
Chart Patterns:
Identifying common chart patterns such as head and shoulders, triangles, and flags.
Interpreting these patterns to forecast potential future price movements.
Volume Analysis:
Analyzing trading volumes alongside price movements.
Volume analysis helps confirm the strength of a trend or identify potential reversals.
While technical analysis doesn't consider a stock's intrinsic value, it provides valuable insights into market sentiment and momentum, making it particularly useful for short to medium-term trading strategies. Traders often combine technical analysis with risk management techniques to enhance decision-making and navigate the dynamic nature of financial markets successfully. Understanding the nuances of technical analysis empowers traders to make informed choices based on historical patterns and market psychology.
#sharemarket#stockmarket#priceaction#technicalanalysis📊📈📉#technicalanalysisdaily#technical analysis#technicalanalyst#technicalanalysis#priceactionstrategy#priceactiontrader#priceactiontrading
0 notes
Last Seen Blogs

amazingsmileylife
in love with...

happyasiamme-blog
Untitled

divinechaosband
Divine Chaos

misstricksmix
Untitled

thomaluc
Thomaluc Enthusiast