#Annotated images
Text
How to Use Graphics in Microlearning to Enhance Learning

Microlearning is a powerful educational strategy that delivers information in small, manageable chunks, making it easier for learners to absorb and retain knowledge. Graphics play a crucial role in enhancing microlearning by making content more engaging, accessible, and memorable. Effective use of graphics can transform complex information into easily digestible visuals, facilitate better understanding, and promote active learning. Here’s a comprehensive guide on how to use graphics in microlearning to enhance learning.
1. Simplify Complex Information
Graphics can simplify complex information, making it easier for learners to understand and remember. When dealing with intricate concepts or data, visual representations like diagrams, charts, and infographics can break down information into more digestible parts.
Infographics: Use infographics to combine text and visuals, providing a clear and concise overview of complex topics. Infographics are particularly effective in presenting data, processes, and comparisons. For instance, an infographic about the benefits of a new software tool can visually highlight its features, advantages, and usage statistics, making the information more accessible and engaging.
Flowcharts: Flowcharts are excellent for illustrating processes and workflows. They provide a step-by-step visual guide that can help learners understand sequences and relationships between different stages of a process. For example, a flowchart showing the steps of a customer service protocol can guide employees through each stage, from initial contact to resolution.
Diagrams and Models: Use diagrams to represent structures, systems, or concepts. For instance, a Venn diagram can effectively illustrate overlapping areas of two related concepts, while a model of a cell can help biology students visualize its components and functions.
2. Enhance Retention and Recall
Graphics enhance retention and recall by leveraging the brain's natural preference for visual information. Visual aids can help learners encode information more effectively, leading to better memory retention.
Mind Maps: Mind maps visually organize information around a central concept, showing the relationships between different ideas. This technique is useful for brainstorming sessions, summarizing lessons, or revising topics. A mind map about a historical event, for example, can connect key dates, figures, and outcomes, helping learners see the big picture and remember details.
Mnemonic Graphics: Use mnemonic graphics to create visual memory aids. Mnemonics are tools that help learners recall information through associations. For example, a graphic that uses the acronym "HOMES" to remember the Great Lakes (Huron, Ontario, Michigan, Erie, Superior) can be a fun and effective learning aid.
Flashcards: Digital flashcards with graphics can enhance vocabulary learning, language acquisition, and other memory-based tasks. Each flashcard can display an image along with a term or definition, making it easier for learners to create mental associations.
3. Engage Learners Actively
Active engagement is crucial for effective learning. Interactive graphics can transform passive learning experiences into active ones, encouraging learners to participate and interact with the content.
Interactive Infographics: Create interactive infographics that learners can explore by clicking on different sections to reveal more information. This approach allows learners to engage with the content at their own pace, diving deeper into areas of interest.
Simulations and Virtual Labs: Use graphics to create simulations and virtual labs that replicate real-world scenarios. These interactive environments enable learners to practice skills and apply knowledge in a safe, controlled setting. For example, a virtual lab for chemistry students can simulate experiments, allowing them to mix chemicals and observe reactions without the risks associated with physical labs.
Clickable Diagrams: Incorporate clickable diagrams that provide additional details when learners hover over or click on specific parts. This technique is useful for exploring detailed systems, such as the human body or machinery, where learners can click on different components to learn more about their functions.
4. Support Diverse Learning Styles
Different learners have different preferences and strengths. Some may be visual learners who benefit greatly from graphics, while others might prefer textual or auditory information. Using a variety of graphics can cater to these diverse learning styles.
Visual Summaries: Provide visual summaries of key points at the end of each microlearning module. These can include bullet points, icons, and illustrations that encapsulate the main ideas. Visual summaries help visual learners quickly grasp the core concepts and serve as a handy reference.
Video Content: Integrate videos with graphical elements such as animations, subtitles, and on-screen text. Videos can combine auditory and visual learning, making them effective for learners who benefit from seeing and hearing information simultaneously. For example, an instructional video on CPR can show animated sequences of the procedure along with audio explanations.
Graphical Storytelling: Use graphics to tell stories that illustrate concepts and scenarios. Storytelling is a powerful tool for making information relatable and memorable. For instance, a graphic story about a company’s journey to achieve sustainability goals can engage learners and provide a narrative context for the information.
5. Facilitate Quick Understanding
In microlearning, time is of the essence. Graphics can convey information quickly and effectively, ensuring that learners grasp the key points without feeling overwhelmed.
Icons and Symbols: Use icons and symbols to represent concepts, actions, and categories. Icons are universally recognized and can quickly convey meaning without the need for lengthy explanations. For example, a series of icons can represent different stages of a project lifecycle, such as planning, execution, and evaluation.
Charts and Graphs: Incorporate charts and graphs to present numerical data and trends. Visualizing data helps learners understand patterns and relationships at a glance. A bar chart showing sales performance across different regions, for example, can quickly highlight areas of success and those needing improvement.
Annotated Images: Use annotated images to highlight and explain specific parts of a visual. An annotated image of a complex machine can label and describe each component, helping learners understand its structure and function quickly.
Best Practices for Using Graphics in Microlearning
To maximize the effectiveness of graphics in microlearning, consider the following best practices:
Keep It Simple: Avoid cluttering your graphics with too much information. Focus on clarity and simplicity to ensure that the visuals are easy to understand.
Consistency: Maintain a consistent style, color scheme, and typography throughout your graphics to create a cohesive learning experience.
Relevance: Ensure that all graphics are directly related to the content and learning objectives. Irrelevant or decorative graphics can distract learners and reduce the effectiveness of the lesson.
Accessibility: Make sure your graphics are accessible to all learners, including those with visual impairments. Use high-contrast colors, alt text for images, and ensure compatibility with screen readers.
Feedback: Gather feedback from learners on the effectiveness of your graphics and make improvements based on their input. Continuous refinement will help you create more effective learning materials.
Conclusion
Graphics are a powerful tool in microlearning, capable of enhancing engagement, simplifying complex information, and supporting diverse learning styles. By integrating well-designed visuals into your microlearning modules, you can create a more effective and enjoyable learning experience. Whether through infographics, interactive elements, or visual summaries, the thoughtful use of graphics can significantly enhance the impact of your microlearning efforts.
#Microlearning#Graphics in education#Visual learning#Infographics#Flowcharts#Diagrams#Interactive content#Learning retention#Active learning#Simplifying complex information#Memory aids#Mnemonic graphics#Digital flashcards#Interactive infographics#Simulations#Virtual labs#Clickable diagrams#Diverse learning styles#Visual summaries#Instructional videos#Graphical storytelling#Quick understanding#Icons and symbols#Charts and graphs#Annotated images#Educational technology#Visual aids#Learning engagement#E-learning#Learning preferences
1 note
·
View note
Text
Gaming for the good of our ocean 🎮📱🌊
Have you played @fathomverse yet? This cozy sci-non-fi game for ocean explorers was created by our research and technology partners @mbari-blog . By playing you can interact with real underwater images to improve the artificial intelligence that helps researchers study ocean life.

Now available for download on the App Store and Google Play! Read more at https://mbayaq.co/FathomVerse
📸:@mbari-blog
#monterey bay aquarium#the good kind of AI#do you know how long it takes to manually annotate 100000 images?#community science at its finest
2K notes
·
View notes
Text


lhqr outfit musings... (underlayers, everyday outfits, performance / out on the town outfits)
#em draws stuff#l'homme qui rit#the man who laughs#déa#gwynplaine#LONG AWAITED IMAGE. as in this has been slightly more than a month in the works. oh boy.#and also happy belated birthday to tumblr user (and my pal) ned sneez - he who got me interested in these two!#here are your little guys and many happy returns of the day :)#...most of my usual tag-commentary has been relocated into annotations today... I feel like I should add more grime and mends#but frankly it has been one million years of copypasting and selecting and forgetting which layer was which and I wish this done#at some point I want to go back and try drawing gwyn with his hair down as well#I tried on the third slide here but it did not look very good so I put it back :|#oh whale. guess I have to draw him again <- opposite of a problem
59 notes
·
View notes
Text

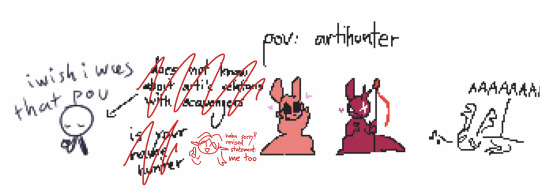
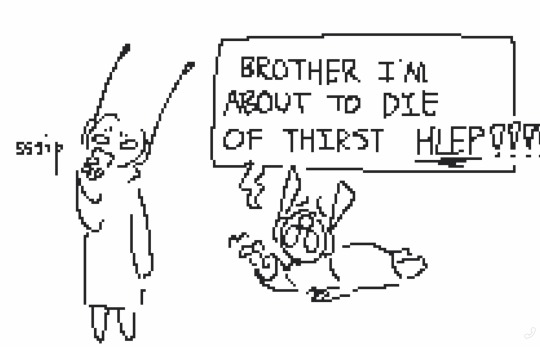


magma.com rain world from like 3 months ago that i definitely did not forget about until just today (complete with recently-made annotations in red ink)
(sequel to this post)
#rain world#rain world downpour#rain world spoilers#rw artificer#idfk man#artihunter#biblio conjures#should i tag for more stuff#my idea is that the stuff i didnt tag for isnt that prominent in this post#and so therefore i shouldnt clog their tags with this post but like#idk man 😭#also tumblr ruined the colors of the two annotated images and i tried to fix it but i couldnt and i am so
268 notes
·
View notes
Text

#I love him sm#pete wentz#fall out boy#americas suitehearts#folie a deux#fob#image not mine#got it from genius annotations lol
98 notes
·
View notes
Text
Not Jordana's orb having bad wifi in Episode 8
#the fucking image lag of the destiny's bounty was crazy#ninjago#ninjago dragons rising#ninjago spoilers#ninjago dragons rising spoilers#ninjago dragons rising season 2#ninjago jordana#toasty's show annotating#finally made this post after watching season 2 with my brother
20 notes
·
View notes
Text

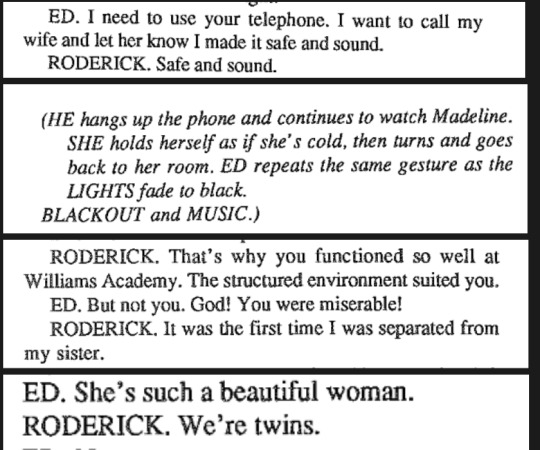
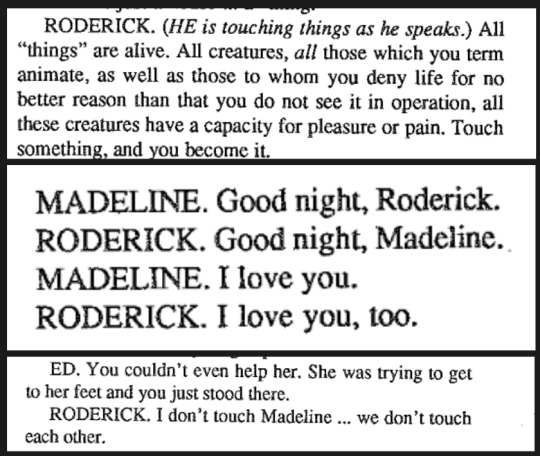

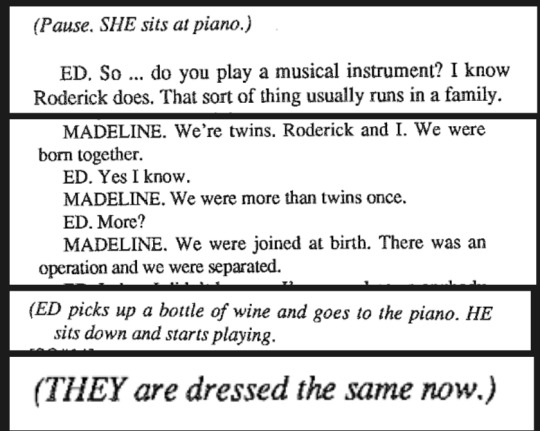
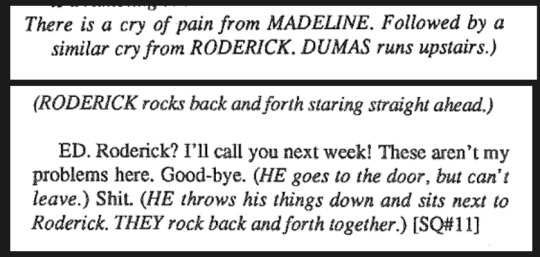


WHEN YOU ARE HER AND HE IS YOU AND SHE IS HIM : gip hoppe's the fall of the house of usher
#webweaving is so hard actually. what the fuck. sorry the images dont align i really do not care anymore i wanted to annotate them too#the fall of the house of usher#webweaving#web weaving#my insane best friend madelineedroderick. they are one person.#madeline usher#roderick usher#edgar allan poe#undescribed#i feel like i need to make a disclaimer that i do not think anything that happens in this play should happen irl because this is tumblr.#usher
33 notes
·
View notes
Text
i've already written about these quotes in my own drrr novel notes but i have to post about it here too just because i need to speak about it again but
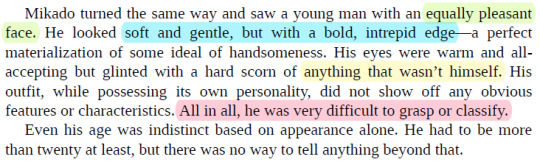
narita describing izaya as 'very difficult to grasp or classify' here in his first real appearance and introduction is so UGHHHHH it's so fucking good. izaya is like an enigma and he is so complex and he's got all these things going on with him that all work to make him so so so beautiful and so i just really like that narita worded it like that. i love to observe izaya like he's a specimen under the microscope.
the other things i highlighted were also very important to me i think the 'anything that wasn't himself' is also a good glimpse into izaya's personality and the way his mind works. 'equally pleasant face' i just like that one cause i like when they call him beautiful in the story . <3
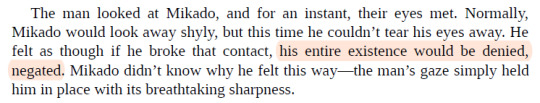
this also made me feel like i was going to ascend from my couch first time i reread it a while back. how interesting is it that narita describes mikado's feeling as though his 'entire existence would be denied' by the very man who so obviously struggles with facing his own humanity and instead chooses to see himself as an omnipotent figure. i just idk i'm not even going to try and get further into it bc i'm already like just feeling like i need to start rolling around and pulling my hair out but my god i love izaya orihara so much he truly is the goat he is MY goat 🙏🙏🙏
#do u know how hard it was for me to type out coheremt thoughts on this instead of just going#RAHHHHHHHHHHHHHHHHHHHHHHHHHHHHHHHHHHHHHHHH and adding 30 reaction images#anyways. opened up adobe acrobat just to highlight the text in cute colors.#i need to get back to my drrr novel reread/annotating bc i have so many thoughts about izaya#but the main thing stopping me other than school is that#i have it all on my izaya site... and i dont even have a set layout for it yet...#if anything i am really unhappy with how it currently is because the quote(s) and my annotations are all together#and i want them separate.#actually the way i did the shizaya fob lyrics thing is inspiring me to just go and use tooltips but like.#i dont like to use js when i dont need to...#i might just try doing a side by side thing but then i'd have to use scrollboxes to ensure the sdame height#sorry. sorrey. rambling again. i will be quite now#mine
9 notes
·
View notes
Text

Rome_Visit_July_1974_-_Visitors_in_the_Colisuem.jpg
#wikimedia commons#1970s#1974#July 1974 in Rome#Interior of the Colosseum - Details#Tourism in Rome#People with Kodak Pocket Instamatic cameras#Fashion in 1974#Tourists in 1974#CC-BY-SA-4.0#Self-published work#Infrogmation in the 1970s#Images with annotations
2 notes
·
View notes
Text

i can’t believe they invented love
#rowan blood series#prince of the sorrows#kellen graves#books#tarot#they have been on my mind non-stop all week long#i read the books on my kindle but i’m gonna get the physical copy of vol.1 in the mail today just so i can annotate properly#click image for better quality i’ve been on this site for 12 years yet i still don’t know how to post pics properly
6 notes
·
View notes
Text
Because I am insane, I wanted to know the exact route the elves took from Cuiviénen to Beleriand. And then I had to make it on a map so I could understand. Source for everything is Tolkien Gateway

Explanation and thoughts under the cut
The Blue line represents the majority of the elves. From Cuiviénen, the elves journey south and pass under the smoke of Utumno. They continue south until they reach the edge of Mirkwood.
Most of the Elves pass through Mirkwood and cross to the eastern bank of the Anduin river.
The Teleri, represented by the Yellow line, chose to go south and circumvent Mirkwood, but they rejoin the others on the Anduin bank.
I couldn't find a reason for this. Perhaps because they were the largest group and travelling through the woods was too hard?
At this point, the elves were loving Middle-Earth. They did not want to move on and made a second home on the bank of the Anduin, protected by Oromë's power and some maiar.
Oromë eventually got them to move.
Except for the Nandor. Represented by the Green line, they split from the Teleri and travelled down the Anduin to... somewhere, I don't know. I hope they had fun.
As the Blue line shows, everyone is back together again. The Elves cross the Misty Mountains via the High Pass, passing through where Rivendell would later be built.
Then they pass through the southern part of Arnor/north Eriador - along what would later become the Great West Raod / The Greenway.
Side note: Most of Eriador was covered by forest at this point, so it would probably be a lot more time-consuming to travel.
Finally they cross Ered Luin / The Blue Mountains and go into Beleriand.
Now, my thoughts:
The journey is long and the elves aren't moving with much urgency. I expect many elves are born and grow to adulthood entirely on Journey. This would be the first generation of elves to have not seen Cuiviénen. I wonder how they (and their relatives) felt about that.
I wonder if there was a lot of mixing between the three groups at first, and then when groups started to split after leaving the home they'd built on the Anduin, they start to become more distinct and separate than ever before.
I think this might have started with the Teleri going around Mirkwood, because this means in all that time (months? years?) they aren't in contact with the others. Perhaps this is why most of those who chose to stay/turn back come from the Teleri - was there something about their culture that they developed in this time that made them more attached to Middle Earth?
It would be interesting I think if there was a divide between those who wanted to stick to Cuiviénen traditions and those who were more attached to the new ones that had developed - whether they had known the old ones or not. Did this effect which individuals split off and which stayed? Did this effect who was chosen for cultural leadership roles? Did Finwë/Ingwë/Elwë have the final say in what traditions were followed on a group scale, or was it mostly down to individual desire?
#never written an image id before ah hope its ok#the text is so small so i just wrote out all my annotations anyway lol#the silmarillion#elves#silm meta#i guess idk what to tag this but i wanna hear what ppl think#Cuiviénen
22 notes
·
View notes
Text
oh before i forget i meant to share
[mirage 11 eastman& laird, letters steve lavigne]

[ID from alt: April, her upper face completely in shadow, she sits wrapped in a blanket, solemnly writing in her journal. END ID]
#some shit#turbles...#this image file is 'mirage 11 dark april'#they got SOO good at drawing her in this issue which is insane cause eastmans annotations were like. eh i dont like them.#all artists is the same. (also didnt seem to like drawing her yknow. emote Strongly but i like to SEE IT. so.)#wifi blogs mirage
4 notes
·
View notes
Text
Help 💀💀 i lost my writing flow and i need to turn in two documentations and one portfolio tomorrow
#honestly surprised at how much i actually did get done tbh#but i desperately need to finish all i can bc the rest needs to be done at uni tomorrow so i simoly can not do the rest tomorrow#and now im at the point where my idiot brain is going 'oh but youre almost done you can do the rest tomorrow'#WHICH I CAN NOT THIS IS STILL LIKE ABOUT 5H OF WORK#i need to add and annotate all images [and take some more tomorrow 🙃 because i forgot to take 'after' images]#i need to write the ENTIRE restoration account and part of the description of the object in the big docu#NOT TO FORGET FORMATTING WHICH WILL COST ME AT LEAST 1H AND 1000000 NERVES#but god then i am free#portfolio is shit but it's not graded is just needs to be turned in
3 notes
·
View notes
Text

someone stop zhuge liang he keeps roasting people so bad they wanna kill him
#yes i've shifted from rotk shitposts to here from twitter bc twitter's image crops annoy me#anw the chapter where zhuge liang just roasts all of sun quan's advisors for being cowards who care about being solitary scholars than#anything useful#was fun#romance of the three kingdoms#also continue to love the annotations#ur so right CaoCaofan is it is a#BURN!!#jaggedwolf reads rotk
6 notes
·
View notes
Text
prepared an Antigone Brainrot centenary thasmin thing for tomorrow & it will post at a less godless hour than this one
#the quality of images used is mediocre and it will stay that way unless i find nicer ones before 10am#which i probably won't seeing as i plan to sleep until at least 1pm#i've also ranted about antigone x thoschei at dimitri who makes better decisions regarding bedtimes afaik#and have saved my pencil-annotated images from antigonick#hyperfixation babyyyyy
4 notes
·
View notes
Text
Image Annotation Work Online: Essential Skills and Tools for Success in the Digital Age | CallCite

In today’s data-driven world, image annotation has become a crucial component for training machine learning models, particularly in AI-driven applications like computer vision, autonomous driving, and facial recognition. To master this art, working with reliable platforms like Callcite can make all the difference. Here’s how to elevate your image annotation skills and thrive in this growing field.
1. Understanding Image Annotation
Image annotation involves labeling images with metadata to help AI models recognize patterns. It’s the backbone of training datasets that AI systems rely on for tasks like object detection, image segmentation, and classification. Knowing how to apply annotations accurately and consistently is key to success.
2. Key Skills to Develop
To become proficient in image annotation, you must possess attention to detail and a deep understanding of the task at hand. Annotators need to know the specific objects, regions, or features they are marking, and be familiar with various annotation types such as bounding boxes, polygons, and semantic segmentation.
Skills to master:
Label consistency: Ensuring uniform labeling across datasets.
High attention to detail: Minimizing errors that could mislead AI models.
Adaptability: Handling different project requirements and diverse datasets.
3. Tools and Technology
Callcite offers a suite of intuitive, scalable annotation tools designed to handle complex annotation projects with ease. Its AI-driven platform enhances efficiency by automating repetitive tasks, allowing annotators to focus on more intricate labeling needs.
Callcite’s features include:
Easy-to-use interface for manual and automatic annotations.
Support for a wide range of image formats and annotation types.
Seamless collaboration and quality control options.
Conclusion
Mastering image annotation with Callcite ensures that you can contribute to high-quality AI datasets efficiently. By honing essential skills and utilizing top-tier tools, you can thrive in this fast-evolving industry.
0 notes
Last Seen Blogs

tansims78
The Journey of Bendtsen 722

cynicalarchitect
Cynical Architect

sirjustice1140
Untitled
sirjustice1140
Untitled
