#FishboneDiagram
Text
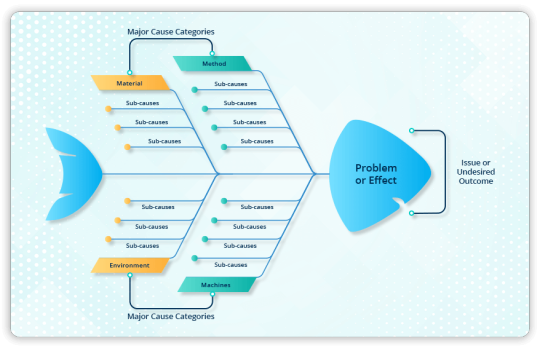
A Guide to Using the Fishbone Tool for Root Cause Analysis
Use the Fishbone Diagram to methodically analyze potential problem causes and identify the root cause, driving continuous improvement.
#Fishbonediagram#Rootcauseanalysis#Problemsolvingtool#Ishikawadiagram#Causeandeffectdiagram#Fishboneanalysis#Rootcauseidentification#Fishbonechart#Qualityimprovement#Continuousimprovement
0 notes

Text

What factors affect students' grade in school? Let us view this fishbone diagram showing different aspects that contributed effects towards students' performance.
by Flores
#FailingGrades?#FishboneDiagram#readingcomprehension#studentproblem#environment#education#cause and effect#my edit
0 notes
Photo

Ishikawa Diagram - Slidebazaar
Find the best fishbone diagram templates for PowerPoint to create modern presentations. Fishbone Diagram PowerPoint template and Keynote slide is available in the black and white background and can be used to represent management hierarchy, a continuous process or departmental divisions; it will surely be a novel presentation idea. To exhibit cause and effect relationship of the theories variables and concepts; fishbone diagramPowerPoint template and keynote slide is a perfect one.This fishbone PowerPoint templates is used to classify the facts behind an occurrence. Here, the presenter can give details of different causes and their possibilities to create an effect; the cause and effect relationship between a product and consumer attitude can be analyzed and verified through this three-layered fishbonediagram powerpoint template. Download now!
0 notes
Text
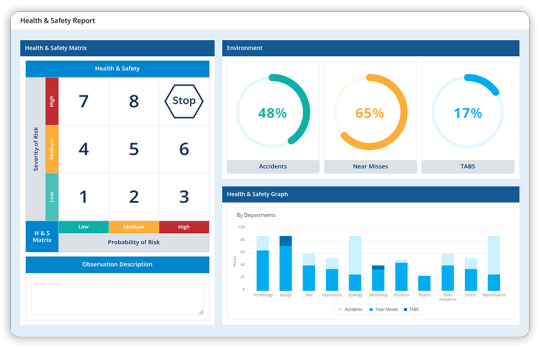
Why is the Balanced Scorecard important for Healthcare Management?
The Balanced Scorecard is indispensable for healthcare management because it provides a holistic and balanced approach to strategic planning, execution, and performance measurement.
Read More: https://balancedscorecard.ltslean.com/medical-health-balanced-scorecard-software#Why-is-the-Balanced-Scorecard-important-for-Healthcare-Management
#balancedscorecard#kpiscorecard#businessscorecard#BSCforHealthcare#KPIs#healthcarekpis#visualmanagement#processmanagement#StrategicPlanning#HealthcareManagement#processflow#flowchart#kpidashboard#fishbonediagram#performancescorecard#flowdiagram#kpimetrics#BSC#datapoint#Lean#lts#Industry4.0#Leantransitionsolutions
0 notes
Text
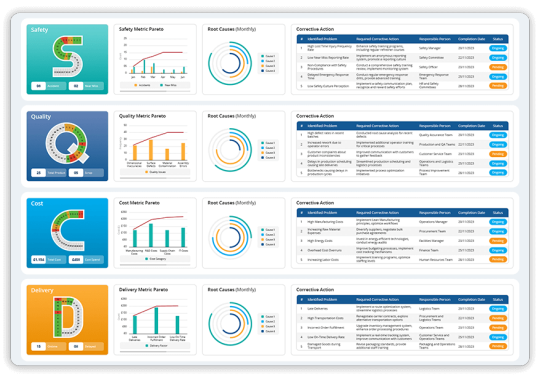
Gemba Board: Enhancing Visual Management for Operational Excellence
Elevating Visual Management with Gemba Boards to Achieve Operational Excellence through enhanced process visibility and efficiency.
Read More: https://balancedscorecard.ltslean.com/gemba-board
#balancedscorecard#Gemba#Gembaboard#Gembaboards#GembaChecklists#Gembaprocess#kpi#lean#SWOTAnalysis#FishboneDiagram#Leanmanufacturing#VisualManagement#Kaizen#TaskBoard#Kanban#WorkinProgress#Transparency#ContinuousImprovement#TeamCollaboration#Efficiency#gembawalk#gembalean#leaderstandardwork#dailymanagementsystem#leandailymanagementsystem#PerformanceMetrics#Visualisation#ProblemIdentification#BSC#datapoint
0 notes
Text
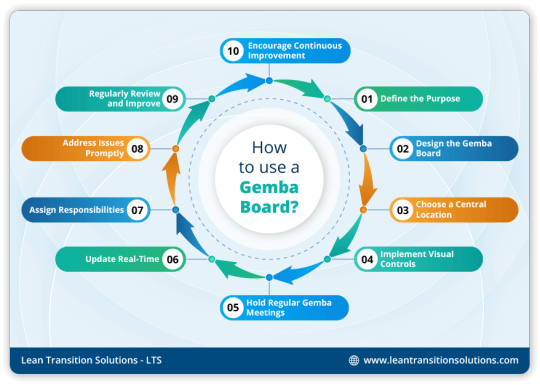
How to use a Gemba board?
Elevating Visual Management with Gemba Boards to Achieve Operational Excellence through enhanced process visibility and efficiency.
Read More: https://balancedscorecard.ltslean.com/gemba-board
#balancedscorecard#Gemba#Gembaboard#Gembaboards#GembaChecklists#Gembaprocess#kpi#lean#SWOTAnalysis#FishboneDiagram#Leanmanufacturing#VisualManagement#Kaizen#TaskBoard#Kanban#WorkinProgress#Transparency#ContinuousImprovement#TeamCollaboration#Efficiency#PerformanceMetrics#Visualisation#ProblemIdentification#BSC#datapoint#Lean#lts#Industry4.0#Leantransitionsolutions
0 notes
Text
Mastering Problem Solving with Fishbone Diagram: 5 Tips for Success in 2024
Drive Continuous Improvement with Fishbone Diagram by systematically analysing potential causes of a problem and uncovering its root cause.
Read More: https://balancedscorecard.ltslean.com/Fishbone-diagram


#Fishbonediagram#Rootcauseanalysis#Problemsolvingtool#Ishikawadiagram#Causeandeffectdiagram#Fishboneanalysis#Rootcauseidentification#Fishbonechart#Qualityimprovement#Continuousimprovement#Problemsolvingtechnique#teamcollaboration#Processanalysis#SixSigma#Kaizen#Brainstorming#Factoridentification#Fishbonecategories#Fishbonemethodology#Problemsolvingworkshop#BSC#datapoint#Lean#lts#Industry4.0#Leantransitionsolutions
0 notes
Text
Fishbone Diagram: A Powerful Problem- Solving Tool for Root Cause Analysis
Drive Continuous Improvement with Fishbone Diagram by systematically analysing potential causes of a problem and uncovering its root cause.
Read More: https://balancedscorecard.ltslean.com/Fishbone-diagram
#Fishbonediagram#Rootcauseanalysis#Problemsolvingtool#Ishikawadiagram#Causeandeffectdiagram#Fishboneanalysis#Rootcauseidentification#Fishbonechart#Qualityimprovement#Continuousimprovement#Problemsolvingtechnique#Teamcollaboration#Processanalysis#SixSigma#Kaizen#Brainstorming#Factoridentification#Fishbonecategories#Fishbonemethodology#Problemsolvingworkshop#Fishbonediagramforrootcauseanalysis#Problemsolvingwiththefishbonediagram#Ishikawadiagraminrootcauseanalysis#datapoint#balancedscorecard#lts#lean#leantransitionsolutions
0 notes
Text
Analysing with Precision: 5 Root Cause Analysis Techniques
Implementing Root Cause Analysis techniques in organisations helps to enhance organisational efficiency, resolve issues, and drive continuous improvement.
Read More: https://balancedscorecard.ltslean.com/software-blogs-details/analysing-with-precision-root-cause-analysis-techniques

#lts#lean#leantransitionsolutions#Datapoint#balancedscorecard#balancedscorecardsoftware#rootcause#fishbonediagram#fmea#ishikawadiagram#paretoanalysis#paretochart#5whys#processmapping#ishikawa#fishboneanalysis#paretodiagram#fmeaanalysis#paretograph#fmeaprocess#fishbonechart#5whysmethod#faulttree#rcaanalysis#rcareport#fivewhysanalysis#causeeffectanalysis#fmeatool#fishbonemodel#paretoplot
0 notes
Last Seen Blogs

hornybadapple-3
HornyBadApple-3

mmk538sk1-blog
Veteriner

speedrunnerfw-fr
Welcome to the Cainaka Clan

andrasmaria
Let’s Be Real

sssn-neptune-vasilias
Renora Won