#SQL server to snowflake
Explore tagged Tumblr posts
Visit Tumblr Blog
Explore Tumblr blogs with no restrictions, modern design and the best experience.
Last Seen Tumblr Blogs


Fun Fact
Forty percent of Tumblr users are between the ages of 18 to 25.
Text
Benefits of Snowflake for enterprise database management
The importance of data for businesses cannot be overstated as the world continues to run on data-intensive, hyper-connected and real-time applications.
Businesses of all scale and capabilities rely on data to make future decisions and derive useful insights to create growth.
However, with the rising volume, complexity and dependency on data rich applications and platforms, it has become imperative for companies and enterprises to make use of scalable, flexible and robust tools and technologies.

This is where database management solutions help businesses implement data pipelines for storing, modifying and analysing data in real-time.
Although there are many tools and solutions to make use of real-time data processing and analysis, not all tools are created equal.
While many companies rely on legacy systems like Microsoft SQL server to power a wide range of applications, modern day businesses are increasingly adapting to cloud-based data warehousing platforms.
One such name in the database management sphere is called Snowflake which is a serverless, cloud-native infrastructure as a service platform.
Snowflake supports Microsoft Azure, Google Cloud and Amazon AWS and is fully scalable to meet your computing and data processing needs.
If you are interested in leveraging the power and capabilities of Snowflake’s cloud based data warehousing solution, it’s time to prepare for migrating your existing SQL server to Snowflake with the help of tools like Bryteflow. Bryteflow allows fully automated, no-code replication of SQL server database to a Snowflake data lake or data warehouse.
0 notes
Text
As companies grow, so does their data, leading to a surge in demand for more scalable and powerful data platforms. Here, in this blog, we are talking about one of the most sought-after topics of migration from SQL Server to Snowflake.
0 notes
Text
Why Tableau is Essential in Data Science: Transforming Raw Data into Insights

Data science is all about turning raw data into valuable insights. But numbers and statistics alone don’t tell the full story—they need to be visualized to make sense. That’s where Tableau comes in.
Tableau is a powerful tool that helps data scientists, analysts, and businesses see and understand data better. It simplifies complex datasets, making them interactive and easy to interpret. But with so many tools available, why is Tableau a must-have for data science? Let’s explore.
1. The Importance of Data Visualization in Data Science
Imagine you’re working with millions of data points from customer purchases, social media interactions, or financial transactions. Analyzing raw numbers manually would be overwhelming.
That’s why visualization is crucial in data science:
Identifies trends and patterns – Instead of sifting through spreadsheets, you can quickly spot trends in a visual format.
Makes complex data understandable – Graphs, heatmaps, and dashboards simplify the interpretation of large datasets.
Enhances decision-making – Stakeholders can easily grasp insights and make data-driven decisions faster.
Saves time and effort – Instead of writing lengthy reports, an interactive dashboard tells the story in seconds.
Without tools like Tableau, data science would be limited to experts who can code and run statistical models. With Tableau, insights become accessible to everyone—from data scientists to business executives.
2. Why Tableau Stands Out in Data Science
A. User-Friendly and Requires No Coding
One of the biggest advantages of Tableau is its drag-and-drop interface. Unlike Python or R, which require programming skills, Tableau allows users to create visualizations without writing a single line of code.
Even if you’re a beginner, you can:
✅ Upload data from multiple sources
✅ Create interactive dashboards in minutes
✅ Share insights with teams easily
This no-code approach makes Tableau ideal for both technical and non-technical professionals in data science.
B. Handles Large Datasets Efficiently
Data scientists often work with massive datasets—whether it’s financial transactions, customer behavior, or healthcare records. Traditional tools like Excel struggle with large volumes of data.
Tableau, on the other hand:
Can process millions of rows without slowing down
Optimizes performance using advanced data engine technology
Supports real-time data streaming for up-to-date analysis
This makes it a go-to tool for businesses that need fast, data-driven insights.
C. Connects with Multiple Data Sources
A major challenge in data science is bringing together data from different platforms. Tableau seamlessly integrates with a variety of sources, including:
Databases: MySQL, PostgreSQL, Microsoft SQL Server
Cloud platforms: AWS, Google BigQuery, Snowflake
Spreadsheets and APIs: Excel, Google Sheets, web-based data sources
This flexibility allows data scientists to combine datasets from multiple sources without needing complex SQL queries or scripts.
D. Real-Time Data Analysis
Industries like finance, healthcare, and e-commerce rely on real-time data to make quick decisions. Tableau’s live data connection allows users to:
Track stock market trends as they happen
Monitor website traffic and customer interactions in real time
Detect fraudulent transactions instantly
Instead of waiting for reports to be generated manually, Tableau delivers insights as events unfold.
E. Advanced Analytics Without Complexity
While Tableau is known for its visualizations, it also supports advanced analytics. You can:
Forecast trends based on historical data
Perform clustering and segmentation to identify patterns
Integrate with Python and R for machine learning and predictive modeling
This means data scientists can combine deep analytics with intuitive visualization, making Tableau a versatile tool.
3. How Tableau Helps Data Scientists in Real Life
Tableau has been adopted by the majority of industries to make data science more impactful and accessible. This is applied in the following real-life scenarios:
A. Analytics for Health Care
Tableau is deployed by hospitals and research institutions for the following purposes:
Monitor patient recovery rates and predict outbreaks of diseases
Analyze hospital occupancy and resource allocation
Identify trends in patient demographics and treatment results
B. Finance and Banking
Banks and investment firms rely on Tableau for the following purposes:
✅ Detect fraud by analyzing transaction patterns
✅ Track stock market fluctuations and make informed investment decisions
✅ Assess credit risk and loan performance
C. Marketing and Customer Insights
Companies use Tableau to:
✅ Track customer buying behavior and personalize recommendations
✅ Analyze social media engagement and campaign effectiveness
✅ Optimize ad spend by identifying high-performing channels
D. Retail and Supply Chain Management
Retailers leverage Tableau to:
✅ Forecast product demand and adjust inventory levels
✅ Identify regional sales trends and adjust marketing strategies
✅ Optimize supply chain logistics and reduce delivery delays
These applications show why Tableau is a must-have for data-driven decision-making.
4. Tableau vs. Other Data Visualization Tools
There are many visualization tools available, but Tableau consistently ranks as one of the best. Here’s why:
Tableau vs. Excel – Excel struggles with big data and lacks interactivity; Tableau handles large datasets effortlessly.
Tableau vs. Power BI – Power BI is great for Microsoft users, but Tableau offers more flexibility across different data sources.
Tableau vs. Python (Matplotlib, Seaborn) – Python libraries require coding skills, while Tableau simplifies visualization for all users.
This makes Tableau the go-to tool for both beginners and experienced professionals in data science.
5. Conclusion
Tableau has become an essential tool in data science because it simplifies data visualization, handles large datasets, and integrates seamlessly with various data sources. It enables professionals to analyze, interpret, and present data interactively, making insights accessible to everyone—from data scientists to business leaders.
If you’re looking to build a strong foundation in data science, learning Tableau is a smart career move. Many data science courses now include Tableau as a key skill, as companies increasingly demand professionals who can transform raw data into meaningful insights.
In a world where data is the driving force behind decision-making, Tableau ensures that the insights you uncover are not just accurate—but also clear, impactful, and easy to act upon.
#data science course#top data science course online#top data science institute online#artificial intelligence course#deepseek#tableau
3 notes
·
View notes
Text
Top 10 Database Management Systems in 2025

Top 10 Database Management Systems in 2025
Oracle Database — Secure, scalable, and widely used in enterprises.
MySQL — Fast, reliable, and popular for web applications.
Microsoft SQL Server — Best for businesses using the Microsoft ecosystem.
PostgreSQL — Open-source, highly extensible, supports SQL & NoSQL.
MongoDB — NoSQL database ideal for handling large unstructured data.
Snowflake — Cloud-based, excellent for analytics and big data.
Redis — In-memory, ultra-fast database for real-time applications.
Elasticsearch — Powerful search engine for logs and analytics.
IBM Db2 — Enterprise-grade, secure, and scalable database.
SQLite — Lightweight, serverless, ideal for mobile and embedded apps.
These DBMS solutions offer top-tier performance, security, and scalability for various applications. 🚀
0 notes
Text
Power Bi Training with Placement | Call : +91 98407 62315

🔥 Supercharge Your Career with Power BI & SQL in Just 8 Weeks! 🚀
🎯 Launching a New Microsoft Power BI Batch
✅ For IT & NON-IT Professionals
📊 Covers: Power BI, SQL Server, SSIS, Python & BI Basics to Advanced Concepts
🎯 100% Placement Assurance
🤝 Partnered with: Snowflake ❄️ | AWS ☁️ | Microsoft 💻
📞 Contact: +91 98407 62315
📈 Elevate your data skills and boost your career prospects!
#PowerBI #SQL #DataAnalytics #CareerGrowth #BITraining #PowerBITraining #DataVisualization #ITTraining #PlacementAssurance #SQLServer #Snowflake #AWS #Microsoft #CareerDevelopment #powerbitraining #powerbi #dataanalytics #sql #datascience #dataanalysis #datavisualization #excel #msexceltraining #python #tableau #microsoftpowerbi #powerbicourseonline #dataanalyst #exceltraining #powerbidesktop #powerbicourse #datasciencetraining #sqlserver #sqldatabase #sqldeveloper #powerquery #excelonlinecourse #powerbionline #vbamacrostraining #powerbideveloper #powerquerry #vba #dax #vbaexcel
#placement #job #jobs #career #training #hiring #recruitment #jobsearch #education #engineering #college #success #india #students #placements #motivation #admission #coding #internship #java #placementdrive #vacancy #student #mba #employment #university #pune #mumbai #jobseekers #interview
0 notes
Text
Understanding Data Movement in Azure Data Factory: Key Concepts and Best Practices
Introduction
Azure Data Factory (ADF) is a fully managed, cloud-based data integration service that enables organizations to move and transform data efficiently. Understanding how data movement works in ADF is crucial for building optimized, secure, and cost-effective data pipelines.
In this blog, we will explore: ✔ Core concepts of data movement in ADF ✔ Data flow types (ETL vs. ELT, batch vs. real-time) ✔ Best practices for performance, security, and cost efficiency ✔ Common pitfalls and how to avoid them
1. Key Concepts of Data Movement in Azure Data Factory
1.1 Data Movement Overview
ADF moves data between various sources and destinations, such as on-premises databases, cloud storage, SaaS applications, and big data platforms. The service relies on integration runtimes (IRs) to facilitate this movement.
1.2 Integration Runtimes (IRs) in Data Movement
ADF supports three types of integration runtimes:
Azure Integration Runtime (for cloud-based data movement)
Self-hosted Integration Runtime (for on-premises and hybrid data movement)
SSIS Integration Runtime (for lifting and shifting SSIS packages to Azure)
Choosing the right IR is critical for performance, security, and connectivity.
1.3 Data Transfer Mechanisms
ADF primarily uses Copy Activity for data movement, leveraging different connectors and optimizations:
Binary Copy (for direct file transfers)
Delimited Text & JSON (for structured data)
Table-based Movement (for databases like SQL Server, Snowflake, etc.)
2. Data Flow Types in ADF
2.1 ETL vs. ELT Approach
ETL (Extract, Transform, Load): Data is extracted, transformed in a staging area, then loaded into the target system.
ELT (Extract, Load, Transform): Data is extracted, loaded into the target system first, then transformed in-place.
ADF supports both ETL and ELT, but ELT is more scalable for large datasets when combined with services like Azure Synapse Analytics.
2.2 Batch vs. Real-Time Data Movement
Batch Processing: Scheduled or triggered executions of data movement (e.g., nightly ETL jobs).
Real-Time Streaming: Continuous data movement (e.g., IoT, event-driven architectures).
ADF primarily supports batch processing, but for real-time processing, it integrates with Azure Stream Analytics or Event Hub.
3. Best Practices for Data Movement in ADF
3.1 Performance Optimization
✅ Optimize Data Partitioning — Use parallelism and partitioning in Copy Activity to speed up large transfers. ✅ Choose the Right Integration Runtime — Use self-hosted IR for on-prem data and Azure IR for cloud-native sources. ✅ Enable Compression — Compress data during transfer to reduce latency and costs. ✅ Use Staging for Large Data — Store intermediate results in Azure Blob or ADLS Gen2 for faster processing.
3.2 Security Best Practices
🔒 Use Managed Identities & Service Principals — Avoid using credentials in linked services. 🔒 Encrypt Data in Transit & at Rest — Use TLS for transfers and Azure Key Vault for secrets. 🔒 Restrict Network Access — Use Private Endpoints and VNet Integration to prevent data exposure.
3.3 Cost Optimization
💰 Monitor & Optimize Data Transfers — Use Azure Monitor to track pipeline costs and adjust accordingly. 💰 Leverage Data Flow Debugging — Reduce unnecessary runs by debugging pipelines before full execution. 💰 Use Incremental Data Loads — Avoid full data reloads by moving only changed records.
4. Common Pitfalls & How to Avoid Them
❌ Overusing Copy Activity without Parallelism — Always enable parallel copy for large datasets. ❌ Ignoring Data Skew in Partitioning — Ensure even data distribution when using partitioned copy. ❌ Not Handling Failures with Retry Logic — Use error handling mechanisms in ADF for automatic retries. ❌ Lack of Logging & Monitoring — Enable Activity Runs, Alerts, and Diagnostics Logs to track performance.
Conclusion
Data movement in Azure Data Factory is a key component of modern data engineering, enabling seamless integration between cloud, on-premises, and hybrid environments. By understanding the core concepts, data flow types, and best practices, you can design efficient, secure, and cost-effective pipelines.
Want to dive deeper into advanced ADF techniques? Stay tuned for upcoming blogs on metadata-driven pipelines, ADF REST APIs, and integrating ADF with Azure Synapse Analytics!
WEBSITE: https://www.ficusoft.in/azure-data-factory-training-in-chennai/
0 notes
Text
Why You Should Hire Power BI Developers for Apps with Advanced Data Modeling
In today’s data-driven world, businesses rely heavily on advanced data modeling to make informed decisions, optimize operations, and gain a competitive edge. However, building apps with robust data modeling capabilities requires specialized expertise. This is where the role of Power BI developers becomes crucial.
If you’re wondering why you should hire Power BI developers for your next project, this blog will provide you with all the insights you need. From their technical skills to the benefits they bring, we’ll explore why Power BI developers are indispensable for apps with advanced data modeling.
What is Power BI and Why is it Important?
Power BI is a business analytics tool developed by Microsoft that enables organizations to visualize and analyze data from various sources. It offers interactive dashboards, real-time analytics, and advanced data modeling capabilities, making it a popular choice for businesses worldwide.
When you hire Power BI developers, you gain access to professionals who can transform raw data into actionable insights, helping you make data-driven decisions with confidence.
Advanced data modeling involves creating complex data structures, relationships, and calculations to support sophisticated analytics. Power BI developers excel in this area, leveraging their expertise to build apps that deliver accurate, real-time, and visually appealing insights.
Key Reasons to Hire Power BI Developers
Here are some compelling reasons why you should hire Power BI developers for apps with advanced data modeling:
1. Expertise in Data Visualization
One of the standout features of Power BI is its ability to create stunning visualizations. Power BI developers are skilled at designing interactive dashboards and reports that make complex data easy to understand. Whether it’s bar charts, pie charts, or heat maps, they can present data in a way that resonates with stakeholders.
2. Advanced Data Modeling Capabilities
Power BI developers are proficient in creating data models that support complex calculations, hierarchies, and relationships. They can integrate data from multiple sources, such as SQL databases, Excel files, and cloud services, to build a unified and scalable data model.
3. Real-Time Analytics
In today’s fast-paced business environment, real-time insights are critical. Power BI developers can configure your app to provide real-time analytics, enabling you to monitor key metrics and respond to changes promptly.

4. Customization and Scalability
Every business has unique data needs. Power BI developers can customize your app to meet specific requirements, ensuring it aligns with your goals and workflows. Additionally, they can design scalable solutions that grow with your business.
5. Integration with Other Tools
Power BI seamlessly integrates with other Microsoft tools like Azure, Excel, and Dynamics 365. Developers can leverage these integrations to enhance your app’s functionality and provide a seamless user experience.
Skills to Look for When You Hire Power BI Developers
To ensure you hire the right talent, it’s important to evaluate the skills and expertise of Power BI developers. Here are some key skills to look for:
1. Proficiency in Power BI Tools
A skilled Power BI developer should be well-versed in Power BI Desktop, Power BI Service, and Power BI Mobile. They should also have experience with DAX (Data Analysis Expressions) and M language for data transformation.
2. Strong Understanding of Data Modeling
Advanced data modeling requires a deep understanding of concepts like star schema, snowflake schema, and relationships between tables. Ensure the developers you hire have a solid grasp of these principles.
3. Experience with Data Integration
Power BI developers should be able to connect and integrate data from various sources, including databases, APIs, and cloud platforms. Look for experience with tools like SQL Server, Azure, and SharePoint.
4. Problem-Solving and Analytical Skills
Data modeling often involves solving complex problems and optimizing performance. Developers should demonstrate strong analytical skills and the ability to troubleshoot issues effectively.
5. Communication and Collaboration
Power BI developers often work closely with stakeholders, data analysts, and other team members. Strong communication and collaboration skills are essential to ensure the project runs smoothly.
Steps to Hire Power BI Developers
Now that you know what to look for, let’s explore the steps to hire Power BI developers for your project:
1. Define Your Project Requirements
Start by outlining your project’s goals, scope, and technical requirements. Specify the type of data you’ll be working with, the desired visualizations, and any integration needs.
2. Choose the Right Hiring Model
You can hire Power BI developers on a full-time, part-time, or freelance basis. If you need ongoing support, a full-time developer might be the best option. For short-term projects, consider hiring freelancers or a development agency.
3. Search for Talent on Reputable Platforms
There are several platforms where you can find skilled Power BI developers. Some popular options include:
LinkedIn: A professional network with a vast pool of developers.
Upwork: A freelance platform with experienced Power BI professionals.
Toptal: A platform that connects you with top-tier developers.
Microsoft Power BI Community: A forum where you can find certified Power BI experts.
4. Evaluate Portfolios and Past Projects
When you hire Power BI developers, always review their portfolios and past projects. Look for examples of advanced data modeling, custom visualizations, and successful integrations.
5. Conduct Technical Interviews
A technical interview is essential to assess a developer’s skills. Ask questions about Power BI tools, data modeling techniques, and their approach to solving common challenges.
6. Check References and Reviews
Before making a final decision, check the developer’s references and online reviews. This will help you gauge their reliability, communication skills, and ability to meet deadlines.
Best Practices for Working with Power BI Developers
Once you’ve hired the right developers, it’s important to establish a smooth workflow. Here are some best practices to ensure your project’s success:
1. Use Agile Development Methodology
Agile methodology promotes collaboration, flexibility, and iterative progress. Break your project into smaller tasks or sprints, and hold regular meetings to track progress and address any issues.
2. Provide Clear Documentation
Clear and detailed documentation is crucial for advanced data modeling. Provide your developers with data dictionaries, schema diagrams, and a list of key metrics to ensure alignment.
3. Test Thoroughly
Testing is a critical phase in app development. Ensure your developers conduct rigorous testing, including data validation, performance testing, and user acceptance testing (UAT).
4. Foster Open Communication
Maintain open lines of communication with your developers. Use tools like Slack, Zoom, or Microsoft Teams to facilitate collaboration and ensure everyone is on the same page.
5. Plan for Post-Launch Support
App development doesn’t end at launch. Plan for post-launch support, including updates, bug fixes, and additional features. This will help you maintain a high-quality user experience.
Conclusion
Hiring Power BI developers is a strategic move for businesses looking to build apps with advanced data modeling capabilities. Their expertise in data visualization, modeling, and integration can transform your data into actionable insights, driving better decision-making and business growth. By following a structured hiring process and implementing best practices, you can ensure your project’s success and achieve your goals.
0 notes
Text
Snowflake vs Traditional Databases: What Makes It Different?

Data management has evolved significantly in the last decade, with organizations moving from on-premise, traditional databases to cloud-based solutions. One of the most revolutionary advancements in cloud data warehousing is Snowflake, which has transformed the way businesses store, process, and analyze data. But how does Snowflake compare to traditional databases? What makes it different, and why is it gaining widespread adoption?
In this article, we will explore the key differences between Snowflake and traditional databases, highlighting the advantages of Snowflake and why businesses should consider adopting it. If you are looking to master this cloud data warehousing solution, Snowflake training in Chennai can help you gain practical insights and hands-on experience.
Understanding Traditional Databases
Traditional databases have been the backbone of data storage and management for decades. These databases follow structured approaches, including relational database management systems (RDBMS) like MySQL, Oracle, PostgreSQL, and SQL Server. They typically require on-premise infrastructure and are managed using database management software.
Key Characteristics of Traditional Databases:
On-Premise or Self-Hosted – Traditional databases are often deployed on dedicated servers, requiring physical storage and management.
Structured Data Model – Data is stored in predefined tables and schemas, following strict rules for relationships.
Manual Scaling – Scaling up or out requires purchasing additional hardware or distributing workloads across multiple databases.
Fixed Performance Limits – Performance depends on hardware capacity and resource allocation.
Maintenance-Intensive – Requires database administrators (DBAs) for management, tuning, and security.
While traditional databases have been effective for years, they come with limitations in terms of scalability, flexibility, and cloud integration. This is where Snowflake changes the game.
What is Snowflake?
Snowflake is a cloud-based data warehousing platform that enables businesses to store, manage, and analyze vast amounts of data efficiently. Unlike traditional databases, Snowflake is designed natively for the cloud, providing scalability, cost-efficiency, and high performance without the complexities of traditional database management.
Key Features of Snowflake:
Cloud-Native Architecture – Built for the cloud, Snowflake runs on AWS, Azure, and Google Cloud, ensuring seamless performance across platforms.
Separation of Storage and Compute – Unlike traditional databases, Snowflake separates storage and computing resources, allowing independent scaling.
Automatic Scaling – Snowflake scales up and down dynamically based on workload demands, optimizing costs and performance.
Pay-As-You-Go Pricing – Organizations pay only for the storage and computing resources they use, making it cost-efficient.
Zero Management Overhead – No need for database administration, as Snowflake handles maintenance, security, and updates automatically.
Key Differences Between Snowflake and Traditional Databases
To understand what makes Snowflake different, let’s compare it to traditional databases across various factors:
1. Architecture
Traditional Databases: Follow a monolithic architecture, where compute and storage are tightly coupled. This means that increasing storage requires additional compute power, leading to higher costs.
Snowflake: Uses a multi-cluster, shared data architecture, where compute and storage are separate. Organizations can scale them independently, allowing cost and performance optimization.
2. Scalability
Traditional Databases: Require manual intervention to scale. Scaling up involves buying more hardware, and scaling out requires adding more database instances.
Snowflake: Offers instant scalability without any manual effort. It automatically scales based on the workload, making it ideal for big data applications.
3. Performance
Traditional Databases: Performance is limited by fixed hardware capacity. Queries can slow down when large volumes of data are processed.
Snowflake: Uses automatic query optimization and multi-cluster computing, ensuring faster query execution, even for large datasets.
4. Storage & Cost Management
Traditional Databases: Storage and compute are linked, meaning you pay for full capacity even if some resources are unused.
Snowflake: Since storage and compute are separate, businesses only pay for what they use, reducing unnecessary costs.
5. Data Sharing & Collaboration
Traditional Databases: Sharing data requires manual exports, backups, or setting up complex replication processes.
Snowflake: Enables secure, real-time data sharing without data movement, allowing multiple users to access live datasimultaneously.
6. Security & Compliance
Traditional Databases: Require manual security measures such as setting up encryption, backups, and access controls.
Snowflake: Provides built-in security features, including encryption, role-based access, compliance certifications (GDPR, HIPAA, etc.), and automatic backups.
7. Cloud Integration
Traditional Databases: Cloud integration requires additional tools or custom configurations.
Snowflake: Natively supports cloud environments and seamlessly integrates with BI tools like Power BI, Tableau, and Looker.
Why Businesses Are Moving to Snowflake
Companies across industries are transitioning from traditional databases to Snowflake due to its unparalleled advantages in scalability, performance, and cost efficiency. Some key reasons include:
Big Data & AI Adoption: Snowflake’s ability to handle massive datasets makes it ideal for AI-driven analytics and machine learning.
Reduced IT Overhead: Organizations can focus on analytics instead of database maintenance.
Faster Time to Insights: With high-speed querying and real-time data sharing, businesses can make quick, data-driven decisions.
How to Get Started with Snowflake?
If you are looking to switch to Snowflake or build expertise in cloud data warehousing, the best way is through structured training. Snowflake training in Chennai provides in-depth knowledge, practical labs, and real-world use cases to help professionals master Snowflake.
What You Can Learn in Snowflake Training?
Snowflake Architecture & Fundamentals
Data Loading & Processing in Snowflake
Performance Tuning & Optimization
Security, Access Control & Governance
Integration with Cloud Platforms & BI Tools
By enrolling in Snowflake training in Chennai, you gain hands-on experience in cloud data warehousing, making you industry-ready for high-demand job roles.
Conclusion
Snowflake has emerged as a game-changer in the world of data warehousing, offering cloud-native architecture, automated scalability, cost efficiency, and superior performance compared to traditional databases. Businesses looking for a modern data platform should consider Snowflake to enhance their data storage, analytics, and decision-making capabilities.
1 note
·
View note
Text
Automating Tableau Reports Validation: The Easy Path to Trusted Insights
Automating Tableau Reports Validation is essential to ensure data accuracy, consistency, and reliability across multiple scenarios. Manual validation can be time-consuming and prone to human error, especially when dealing with complex dashboards and large datasets. By leveraging automation, organizations can streamline the validation process, quickly detect discrepancies, and enhance overall data integrity.
Going ahead, we’ll explore automation of Tableau reports validation and how it is done.
Importance of Automating Tableau Reports Validation
Automating Tableau report validation provides several benefits, ensuring accuracy, efficiency, and reliability in BI reporting.
Automating the reports validation reduces the time and effort, which allows analysts to focus on insights rather than troubleshooting the errors
Automation prevents data discrepancies and ensures all reports are pulling in consistent data
Many Organizations deal with high volumes of reports and dashboards. It is difficult to manually validate each report. Automating the reports validation becomes critical to maintain efficiency.
Organizations update their Tableau dashboards very frequently, sometimes daily. On automating the reports validation process, a direct comparison is made between the previous and current data to detect changes or discrepancies. This ensures metrics remain consistent after each data refresh.
BI Validator simplifies BI testing by providing a platform for automated BI report testing. It enables seamless regression, stress, and performance testing, making the process faster and more reliable.
Tableau reports to Database data comparison ensures that the records from the source data are reflected accurately in the visuals of Tableau reports.
This validation process extracts data from Tableau report visuals and compares it with SQL Server, Oracle, Snowflake, or other databases. Datagaps DataOps Suite BI Validator streamlines this by pulling report data, applying transformations, and verifying consistency through automated row-by-row and aggregate comparisons (e.g., counts, sums, averages).
The errors detected usually identify missing, duplicate or mismatched records.
Automation ensures these issues are caught early, reducing manual effort and improving trust in reporting.
Tableau Regression
In the DataOps suite, Regression testing is done by comparing the benchmarked version of tableau report with the live version of the report through Tableau Regression component.
This Tableau regression component can be very useful for automating the testing of Tableau reports or Dashboards during in-place upgrades or changes.
A diagram of a process AI-generated content may be incorrect.
Tableau Upgrade
Tableau Upgrade Component in BI validator helps in automated report testing by comparing the same or different reports of same or different Tableau sources.
The comparison is done in the same manner as regression testing where the differences between the reports can be pointed out both in terms of text as well as appearance.
Generate BI DataFlows is a handy and convenient feature provided by Datagaps DataOps suite to generate multiple dataflows at once for Business Intelligence components like Tableau.
Generate BI DataFlows feature is beneficial in migration scenarios as it enables efficient data comparison between the original and migrated platforms and supports the validations like BI source, Regression and Upgrade. By generating multiple dataflows based on selected reports, users can quickly detect discrepancies or inconsistencies that may arise during the migration process, ensuring data integrity and accuracy while minimizing potential errors. Furthermore, when dealing with a large volume of reports, this feature speeds up the validation process, minimizes manual effort, and improves overall efficiency in detecting and resolving inconsistencies.
As seen from the image, the wizard starts by generating the Dataflow details. The connection details like the engine, validation type, Source-Data Source and Target-Data Source are to be provided by users.
Note: BI source validation and Regression validation types do not prompt for Target-Data source
Let’s take a closer look at the steps involved in “Generate BI Dataflows”
Reports
The Reports section prompts users to select pages from the required reports in the validation process. For Data Compare validation and Upgrade Validation, both source and target pages will be required. For other cases, only the source page will be needed.
Here is a sample screenshot of the extraction of source and target pages from the source and target report respectively
Visual Mapping and Column Mapping (only in Data Compare Validation)
The "Visual Mapping" section allows users to load and compare source and target pages and then establish connections between corresponding tables.
It consists of three sections namely Source Page, Target Page, and Mapping.
In the source page and target page, respective Tableau worksheets are loaded and on selecting the worksheets option, users can preview the data.
After loading the source and target pages, in the mapping section, the dataset columns of source and target will be automatically mapped for each mapping.
After Visual Mapping, the "Column Mapping" section displays the columns of the source dataset and target dataset that were selected for the data comparison. It provides a count of the number of dataset columns that are mapped and unmapped in the "Mapped" and "Unmapped" tabs respectively.
Filters (for the rest of the validation types)
The filters section enables users to apply the filters and parameters on the reports to help in validating them. These filters can either be applied and selected directly through reports or they can be parameterized as well.
Options section varies depending on the type of validation selected by the user. Options section is the pre final stage of generating the flows where some of the advanced options and comparison options are prompted to be selected as per the liking of the user to get the results as they like.
Here’s a sample screenshot of options section before generating the dataflows
This screenshot indicates report to report comparison options to be selected.
Generate section helps to generate multiple dataflows with the selected type of validation depending on the number of selected workbooks for tableau.
The above screenshot indicates that four dataflows are set to be generated on clicking the Generate BI Dataflows button. These dataflows are the same type of validation (Tableau Regression Validation in this case)
Stress Test Plan
To automate the stress testing and performance testing of Tableau Reports, Datagaps DataOps suite BI Validator comes with a component called Stress Test Plan to simulate the number of users actively accessing the reports to analyze how Tableau reports and dashboards perform under heavy load. Results of the stress test plan can be used to point out performance issues, optimize data models and queries to ensure the robustness of the Tableau environment to handle heavy usage patterns. Stress Test Plan allows users to perform the stress testing for multiple views from multiple workbooks at once enabling the flexibility and automation to check for performance bottlenecks of Tableau reports.
For more information on Stress Test Plan, check out “Tableau Performance Testing”.
Integration with CI/CD tools and Pipelines
In addition to these features, DataOps Suite comes with other interesting features like application in built pipelines where the set of Tableau BI dataflows can be run automatically in a certain order either in sequence or parallel.
Also, there’s an inbuilt scheduler in the application where the users can schedule the run of these pipelines involving these BI dataflows well in advance. The jobs can be scheduled to run once or repeatedly as well.
Achieve the seamless and automated Tableau report validation with the advanced capabilities of Datagaps DataOps Suite BI Validator.
0 notes
Text
Migrating from SQL Server to Snowflake Essential Steps and Benefits
Transitioning from SQL Server to Snowflake can significantly enhance your data management capabilities. Snowflake's cloud-native architecture offers numerous advantages, including scalability, flexibility, and cost-efficiency, making it a popular choice for modern data warehousing needs. This article outlines the essential steps and benefits of migrating from SQL Server to Snowflake.
Key Steps for Migration
1. Initial Assessment and Planning
Start with a thorough assessment of your existing SQL Server environment. Identify the databases, tables, and other objects that need to be migrated. Understand the data volume, dependencies, and specific requirements of your applications. Develop a comprehensive migration plan that includes timelines, resources, and risk mitigation strategies.
2. Choosing the Right Migration Tools
Select migration tools that facilitate a smooth transition from SQL Server to Snowflake. Tools such as Azure Data Factory, Matillion, and Fivetran can help automate the extraction, transformation, and loading (ETL) processes. These tools ensure data integrity and minimize downtime during the migration.
3. Schema Conversion
SQL Server and Snowflake have different schema structures. Use schema conversion tools to translate SQL Server schemas into Snowflake-compatible formats. Pay attention to data types, indexing, and partitioning strategies to optimize performance in Snowflake.
4. Data Transformation and Migration
Transform your data to align with Snowflake’s architecture. This might involve data cleansing, reformatting, and converting stored procedures and T-SQL code into Snowflake’s SQL dialect. Leverage Snowflake’s capabilities, such as support for semi-structured data and time travel features, to enhance your data operations.
5. Testing and Validation
Perform thorough testing and validation to ensure that the data has been accurately migrated and that all applications function as expected. Validate data integrity, check for any discrepancies, and conduct performance testing to ensure that Snowflake meets your performance requirements.
6. Security and Compliance
Implement robust security measures to protect your data during and after the migration. Ensure that access controls, encryption, and compliance requirements are met in the Snowflake environment. Snowflake provides extensive security features, including role-based access control and end-to-end encryption.
Benefits of Migrating to Snowflake
1. Scalability and Performance
Snowflake’s architecture allows for automatic scaling of compute resources to handle varying workloads efficiently. This elasticity ensures consistent performance without manual intervention, making it ideal for businesses with growing and fluctuating data needs.
2. Cost Efficiency
With Snowflake’s pay-as-you-go pricing model, you only pay for the storage and compute resources you use. This can lead to significant cost savings, especially for organizations with variable data workloads. Snowflake's separation of storage and compute allows you to optimize resource usage and reduce costs.
3. Simplified Data Management
Snowflake offers a fully managed service, reducing the burden of database administration. Automatic updates, maintenance, and performance tuning are handled by Snowflake, allowing your IT team to focus on more strategic tasks and innovations.
4. Advanced Analytics Capabilities
Snowflake supports diverse data types and integrates seamlessly with various data analytics tools. This enables advanced analytics and machine learning applications, allowing you to gain deeper insights from your data. Snowflake’s support for semi-structured data like JSON, Avro, and Parquet enhances your analytical capabilities.
5. Enhanced Data Sharing and Collaboration
Snowflake’s secure data sharing capabilities facilitate seamless collaboration across departments and with external partners. Real-time data sharing without the need for complex ETL processes improves efficiency and enables better decision-making.
6. Robust Security Features
Snowflake incorporates comprehensive security measures, including end-to-end encryption, role-based access control, and detailed auditing capabilities. These features ensure that your data remains secure and compliant with regulatory standards.
1 note
·
View note
Text
Seamless Migration from SQL Server to Snowflake: A Comprehensive Guide
0 notes
Text
Qlik SaaS: Transforming Data Analytics in the Cloud
In the era of digital transformation, businesses need fast, scalable, and efficient analytics solutions to stay ahead of the competition. Qlik SaaS (Software-as-a-Service) is a cloud-based business intelligence (BI) and data analytics platform that offers advanced data integration, visualization, and AI-powered insights. By leveraging Qlik SaaS, organizations can streamline their data workflows, enhance collaboration, and drive smarter decision-making.
This article explores the features, benefits, and use cases of Qlik SaaS and why it is a game-changer for modern businesses.

What is Qlik SaaS?
Qlik SaaS is the cloud-native version of Qlik Sense, a powerful data analytics platform that enables users to:
Integrate and analyze data from multiple sources
Create interactive dashboards and visualizations
Utilize AI-driven insights for better decision-making
Access analytics anytime, anywhere, on any device
Unlike traditional on-premise solutions, Qlik SaaS eliminates the need for hardware management, allowing businesses to focus solely on extracting value from their data.
Key Features of Qlik SaaS
1. Cloud-Based Deployment
Qlik SaaS runs entirely in the cloud, providing instant access to analytics without requiring software installations or server maintenance.
2. AI-Driven Insights
With Qlik Cognitive Engine, users benefit from machine learning and AI-powered recommendations, improving data discovery and pattern recognition.
3. Seamless Data Integration
Qlik SaaS connects to multiple cloud and on-premise data sources, including:
Databases (SQL, PostgreSQL, Snowflake)
Cloud storage (Google Drive, OneDrive, AWS S3)
Enterprise applications (Salesforce, SAP, Microsoft Dynamics)
4. Scalability and Performance Optimization
Businesses can scale their analytics operations without worrying about infrastructure limitations. Dynamic resource allocation ensures high-speed performance, even with large datasets.
5. Enhanced Security and Compliance
Qlik SaaS offers enterprise-grade security, including:
Role-based access controls
End-to-end data encryption
Compliance with industry standards (GDPR, HIPAA, ISO 27001)
6. Collaborative Data Sharing
Teams can collaborate in real-time, share reports, and build custom dashboards to gain deeper insights.
Benefits of Using Qlik SaaS
1. Cost Savings
By adopting Qlik SaaS, businesses eliminate the costs associated with on-premise hardware, software licensing, and IT maintenance. The subscription-based model ensures cost-effectiveness and flexibility.
2. Faster Time to Insights
Qlik SaaS enables users to quickly load, analyze, and visualize data without lengthy setup times. This speeds up decision-making and improves operational efficiency.
3. Increased Accessibility
With cloud-based access, employees can work with data from any location and any device, improving flexibility and productivity.
4. Continuous Updates and Innovations
Unlike on-premise BI solutions that require manual updates, Qlik SaaS receives automatic updates, ensuring users always have access to the latest features.
5. Improved Collaboration
Qlik SaaS fosters better collaboration by allowing teams to share dashboards, reports, and insights in real time, driving a data-driven culture.
Use Cases of Qlik SaaS
1. Business Intelligence & Reporting
Organizations use Qlik SaaS to track KPIs, monitor business performance, and generate real-time reports.
2. Sales & Marketing Analytics
Sales and marketing teams leverage Qlik SaaS for:
Customer segmentation and targeting
Sales forecasting and pipeline analysis
Marketing campaign performance tracking
3. Supply Chain & Operations Management
Qlik SaaS helps optimize logistics by providing real-time visibility into inventory, production efficiency, and supplier performance.
4. Financial Analytics
Finance teams use Qlik SaaS for:
Budget forecasting
Revenue and cost analysis
Fraud detection and compliance monitoring
Final Thoughts
Qlik SaaS is revolutionizing data analytics by offering a scalable, AI-powered, and cost-effective cloud solution. With its seamless data integration, robust security, and collaborative features, businesses can harness the full power of their data without the limitations of traditional on-premise systems.
As organizations continue their journey towards digital transformation, Qlik SaaS stands out as a leading solution for modern data analytics.
1 note
·
View note
Text
[Fabric] Fast Copy con Dataflows gen2
Cuando pensamos en integración de datos con Fabric está claro que se nos vienen dos herramientas a la mente al instante. Por un lado pipelines y por otro dataflows. Mientras existía Azure Data Factory y PowerBi Dataflows la diferencia era muy clara en audiencia y licencias para elegir una u otra. Ahora que tenemos ambas en Fabric la delimitación de una u otra pasaba por otra parte.
Por buen tiempo, el mercado separó las herramientas como dataflows la simple para transformaciones y pipelines la veloz para mover datos. Este artículo nos cuenta de una nueva característica en Dataflows que podría cambiar esta tendencia.
La distinción principal que separa estas herramientas estaba basado en la experiencia del usuario. Por un lado, expertos en ingeniería de datos preferían utilizar pipelines con actividades de transformaciones robustas d datos puesto que, para movimiento de datos y ejecución de código personalizado, es más veloz. Por otro lado, usuarios varios pueden sentir mucha mayor comodidad con Dataflows puesto que la experiencia de conectarse a datos y transformarlos es muy sencilla y cómoda. Así mismo, Power Query, lenguaje detrás de dataflows, ha probado tener la mayor variedad de conexiones a datos que el mercado ha visto.
Cierto es que cuando el proyecto de datos es complejo o hay cierto volumen de datos involucrado. La tendencia es usar data pipelines. La velocidad es crucial con los datos y los dataflows con sus transformaciones podían ser simples de usar, pero mucho más lentos. Esto hacía simple la decisión de evitarlos. ¿Y si esto cambiara? Si dataflows fuera veloz... ¿la elección sería la misma?
Veamos el contexto de definición de Microsoft:
Con la Fast Copy, puede ingerir terabytes de datos con la experiencia sencilla de flujos de datos (dataflows), pero con el back-end escalable de un copy activity que utiliza pipelines.
Como leemos de su documentación la nueva característica de dataflow podría fortalecer el movimiento de datos que antes frenaba la decisión de utilizarlos. Todo parece muy hermoso aun que siempre hay frenos o limitaciones. Veamos algunas consideraciones.
Origenes de datos permitidos
Fast Copy soporta los siguientes conectores
ADLS Gen2
Blob storage
Azure SQL DB
On-Premises SQL Server
Oracle
Fabric Lakehouse
Fabric Warehouse
PostgreSQL
Snowflake
Requisitos previos
Comencemos con lo que debemos tener para poder utilizar la característica
Debe tener una capacidad de Fabric.
En el caso de los datos de archivos, los archivos están en formato .csv o parquet de al menos 100 MB y se almacenan en una cuenta de Azure Data Lake Storage (ADLS) Gen2 o de Blob Storage.
En el caso de las bases de datos, incluida la de Azure SQL y PostgreSQL, 5 millones de filas de datos o más en el origen de datos.
En configuración de destino, actualmente, solo se admite lakehouse. Si desea usar otro destino de salida, podemos almacenar provisionalmente la consulta (staging) y hacer referencia a ella más adelante. Más info.
Prueba
Bajo estas consideraciones construimos la siguiente prueba. Para cumplir con las condiciones antes mencionadas, disponemos de un Azure Data Lake Storage Gen2 con una tabla con información de vuelos que pesa 1,8Gb y esta constituida por 10 archivos parquet. Creamos una capacidad de Fabric F2 y la asignaciones a un área de trabajo. Creamos un Lakehouse. Para corroborar el funcionamiento creamos dos Dataflows Gen2.
Un dataflow convencional sin FastCopy se vería así:

Podemos reconocer en dos modos la falta de fast copy. Primero porque en el menú de tabla no tenemos la posibilidad de requerir fast copy (debajo de Entable staging) y segundo porque vemos en rojo los "Applied steps" como cuando no tenemos query folding andando. Allí nos avisaría si estamos en presencia de fast copy o intenta hacer query folding:
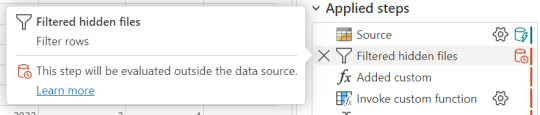
Cuando hace query folding menciona "... evaluated by the datasource."
Activar fast copy
Para activarlo, podemos presenciar el apartado de opciones dentro de la pestaña "Home".
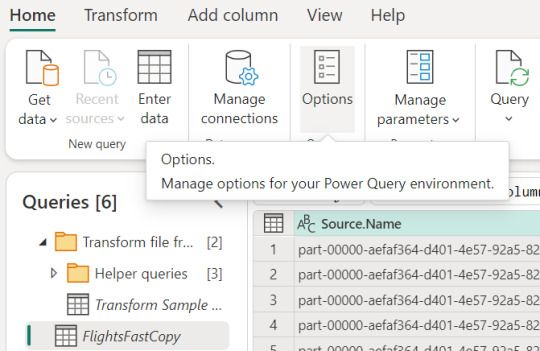
Allí podemos encontrarlo en la opción de escalar o scale:
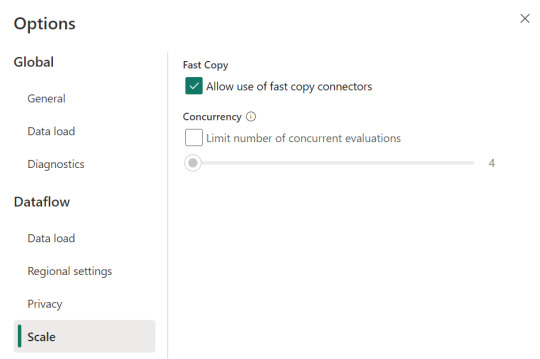
Mientras esa opción esté encendida. El motor intentará utilizar fast copy siempre y cuando la tabla cumpla con las condiciones antes mencionadas. En caso que no las cumpla, por ejemplo la tabla pese menos de 100mb, el fast copy no será efectivo y funcionaría igual que un dataflow convencional.
Aquí tenemos un problema, puesto que la diferencia de tiempos entre una tabla que usa fast copy y una que no puede ser muy grande. Por esta razón, algunos preferiríamos que el dataflow falle si no puede utilizar fast copy en lugar que cambie automaticamente a no usarlo y demorar muchos minutos más. Para exigirle a la tabla que debe usarlo, veremos una opción en click derecho:

Si forzamos requerir fast copy, entonces la tabla devolverá un error en caso que no pueda utilizarlo porque rompa con las condiciones antes mencionadas a temprana etapa de la actualización.
En el apartado derecho de la imagen tambien podemos comprobar que ya no está rojo. Si arceramos el mouse nos aclarará que esta aceptado el fast copy. "Si bien tengo otro detalle que resolver ahi, nos concentremos en el mensaje aclarando que esta correcto. Normalmente reflejaría algo como "...step supports fast copy."
Resultados
Hemos seleccionado exactamente los mismos archivos y ejecutado las mismas exactas transformaciones con dataflows. Veamos resultados.
Ejecución de dataflow sin fast copy:

Ejecución de dataflow con fast copy:
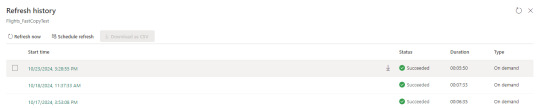
Para validar que tablas de nuestra ejecución usan fast copy. Podemos ingresar a la corrida

En el primer menú podremos ver que en lugar de "Tablas" aparece "Actividades". Ahi el primer síntoma. El segundo es al seleccionar una actividad buscamos en motor y encontramos "CopyActivity". Así validamos que funcionó la característica sobre la tabla.
Como pueden apreciar en este ejemplo, la respuesta de fast copy fue 4 veces más rápida. El incremento de velocidad es notable y la forma de comprobar que se ejecute la característica nos revela que utiliza una actividad de pipeline como el servicio propiamente dicho.
Conclusión
Seguramente esta característica tiene mucho para dar e ir mejorando. No solamente con respecto a los orígenes sino tambien a sus modos. No podemos descargar que también lo probamos contra pipelines y aqui esta la respuesta:
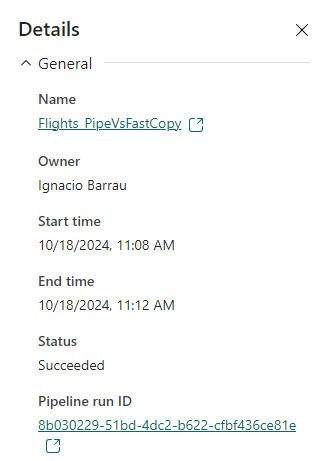
En este ejemplo los Data Pipelines siguen siendo superiores en velocidad puesto que demoró 4 minutos en correr la primera vez y menos la segunda. Aún tiene mucho para darnos y podemos decir que ya está lista para ser productiva con los origenes de datos antes mencionados en las condiciones apropiadas. Antes de terminar existen unas limitaciones a tener en cuenta:
Limitaciones
Se necesita una versión 3000.214.2 o más reciente de un gateway de datos local para soportar Fast Copy.
El gateway VNet no está soportado.
No se admite escribir datos en una tabla existente en Lakehouse.
No se admite un fixed schema.
#fabric#microsoft fabric#fabric training#fabric tips#fabric tutorial#data engineering#dataflows#fabric dataflows#fabric data factory#ladataweb
0 notes
Text
7 Best Data Warehouse Tools to Explore in 2025

What is a Data Warehouse?
A data warehouse is a centralized repository designed to store large volumes of data from various sources in an organized, structured format. It facilitates efficient querying, analysis, and reporting of data, serving as a vital component for business intelligence and analytics.
Types of Data Warehouses
Data warehouses can be classified into the following categories:
Enterprise Data Warehouse (EDW): A unified storage hub for all enterprise data.
Operational Data Store (ODS): Stores frequently updated, real-time data.
Online Analytical Processing (OLAP): Designed for complex analytical queries on large datasets.
Data Mart: A focused subset of a data warehouse for specific departments or business units.
Why Use Data Warehouses?
The primary purpose of data warehouses is to store and organize data centrally, enabling faster and more efficient analysis of large datasets. Other benefits include:
Improved Data Quality: Processes ensure data integrity and consistency.
Historical Data Storage: Supports trend analysis and forecasting.
Enhanced Accessibility: Allows seamless access and querying of data from multiple sources.
Who Uses Data Warehouses?
Data warehouses cater to various professionals across industries:
Data Analysts: Query and analyze data for actionable insights.
Data Engineers: Build and maintain the underlying infrastructure.
Business Intelligence Analysts: Generate reports and visualizations for stakeholders.
Analytics Engineers: Optimize data pipelines for efficient loading.
Companies often use data warehouses to store vast amounts of customer data, sales information, and financial records. Modern trends include adopting data lakes and data lake houses for advanced analytics.
Top Data Warehouse Tools to Watch in 2025
1. Snowflake
Snowflake is a cloud-native data warehouse renowned for its flexibility, security, and scalability.
Key Features:
Multi-cluster Architecture: Supports scalability and separates compute from storage.
Virtual Warehouses: On-demand setup for parallel workload handling.
Data Sharing: Facilitates secure data sharing across organizations.
Snowflake integrates seamlessly with tools like dbt, Tableau, and Looker, making it a cornerstone of the modern data stack.
2. Amazon S3
Amazon S3 is a highly scalable, object-based storage service, widely used as a data warehousing solution.
Key Features:
Scalability: Capable of handling any data volume.
AWS Ecosystem Integrations: Enhances processing and analytics workflows.
Cost-effectiveness: Pay-as-you-go pricing model.
Ideal for organizations already leveraging AWS services, Amazon S3 offers unparalleled flexibility and durability.
3. Google Big Query
Google Big Query is a server less, highly scalable solution designed for real-time insights.
Key Features:
Fast Querying: Processes petabytes of data in seconds.
Automatic Scaling: No manual resource management required.
Integrated Machine Learning: Supports advanced analytics.
Big Query’s seamless integration with Google Cloud services and third-party tools makes it a top choice for modern data stacks.
4. Data bricks
Data bricks is a unified analytics platform combining data engineering, science, and business intelligence.
Key Features:
Spark-based Engine: Enables fast, large-scale data processing.
ML flow: Streamlines machine learning lifecycle management.
Real-time Analytics: Processes streaming data effortlessly.
Data bricks supports Python, SQL, R, and Scala, appealing to diverse data professionals.
5. Amazon Redshift
Amazon Redshift is a fully managed, high-performance data warehouse tailored for structured and semi-structured data.
Key Features:
Columnar Storage: Optimized query performance.
Massively Parallel Processing (MPP): Accelerates complex queries.
AWS Integrations: Works well with S3, DynamoDB, and Elastic MapReduce.
Its scalability and cost-effectiveness make it popular among startups and enterprises alike.
6. Oracle Autonomous Data Warehouse
Oracle Autonomous Data Warehouse automates the creation and management of data warehouses using machine learning.
Key Features:
Autonomous Operations: Self-tuning and optimized storage.
Elastic Scalability: Adjusts resources dynamically based on workload.
Built-in ML Algorithms: Facilitates advanced analytics.
Best suited for enterprises seeking robust, automated solutions with high performance.
7. PostgreSQL
PostgreSQL is a versatile, open-source relational database that supports data warehousing needs.
Key Features:
ACID Compliance: Ensures data integrity.
Multi-version Concurrency Control (MVCC): Allows simultaneous access.
Extensibility: Offers plugins like PostgreSQL Data Warehousing by Citus.
Its robust community support and adaptability make PostgreSQL a reliable choice for organizations of all sizes.
Next Steps
Key Takeaways:
Data warehouses enable efficient organization and analysis of large datasets.
Popular tools include Snowflake, Amazon S3, Google BigQuery, Databricks, Amazon Redshift, Oracle, and PostgreSQL.
How to Advance Your Knowledge:
Explore Data Analytics Tools: Get acquainted with platforms like Tableau and dbt.
Learn Data Analytics: Try Career Foundry’s free, 5-day data analytics short course.
Join Live Events: Participate in online events with industry experts.
Take the first step towards becoming a data analyst. Enroll in Career Foundry’s data analytics program and unlock a new career path today.
0 notes
Text
Technical Consultant Int. - Middleware Support/SQL/Python/MuleSoft
to include support and administration of Platform & Integration services components – Python based, Blue Yonder Connect (using… environment: Software: Python, MuleSoft, API’s Database: MS SQL Server, Snowflake Cloud Architecture: MS Azure Frameworks… Apply Now
0 notes
Text
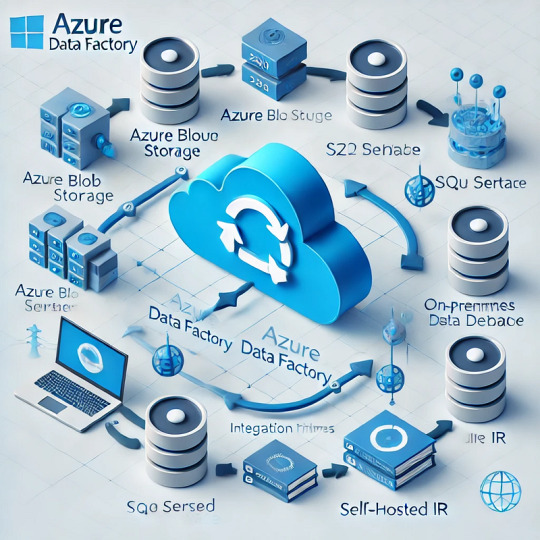
Exploring the Role of Azure Data Factory in Hybrid Cloud Data Integration

Introduction
In today’s digital landscape, organizations increasingly rely on hybrid cloud environments to manage their data. A hybrid cloud setup combines on-premises data sources, private clouds, and public cloud platforms like Azure, AWS, or Google Cloud. Managing and integrating data across these diverse environments can be complex.
This is where Azure Data Factory (ADF) plays a crucial role. ADF is a cloud-based data integration service that enables seamless movement, transformation, and orchestration of data across hybrid cloud environments.
In this blog, we’ll explore how Azure Data Factory simplifies hybrid cloud data integration, key use cases, and best practices for implementation.
1. What is Hybrid Cloud Data Integration?
Hybrid cloud data integration is the process of connecting, transforming, and synchronizing data between: ✅ On-premises data sources (e.g., SQL Server, Oracle, SAP) ✅ Cloud storage (e.g., Azure Blob Storage, Amazon S3) ✅ Databases and data warehouses (e.g., Azure SQL Database, Snowflake, BigQuery) ✅ Software-as-a-Service (SaaS) applications (e.g., Salesforce, Dynamics 365)
The goal is to create a unified data pipeline that enables real-time analytics, reporting, and AI-driven insights while ensuring data security and compliance.
2. Why Use Azure Data Factory for Hybrid Cloud Integration?
Azure Data Factory (ADF) provides a scalable, serverless solution for integrating data across hybrid environments. Some key benefits include:
✅ 1. Seamless Hybrid Connectivity
ADF supports over 90+ data connectors, including on-prem, cloud, and SaaS sources.
It enables secure data movement using Self-Hosted Integration Runtime to access on-premises data sources.
✅ 2. ETL & ELT Capabilities
ADF allows you to design Extract, Transform, and Load (ETL) or Extract, Load, and Transform (ELT) pipelines.
Supports Azure Data Lake, Synapse Analytics, and Power BI for analytics.
✅ 3. Scalability & Performance
Being serverless, ADF automatically scales resources based on data workload.
It supports parallel data processing for better performance.
✅ 4. Low-Code & Code-Based Options
ADF provides a visual pipeline designer for easy drag-and-drop development.
It also supports custom transformations using Azure Functions, Databricks, and SQL scripts.
✅ 5. Security & Compliance
Uses Azure Key Vault for secure credential management.
Supports private endpoints, network security, and role-based access control (RBAC).
Complies with GDPR, HIPAA, and ISO security standards.
3. Key Components of Azure Data Factory for Hybrid Cloud Integration
1️⃣ Linked Services
Acts as a connection between ADF and data sources (e.g., SQL Server, Blob Storage, SFTP).
2️⃣ Integration Runtimes (IR)
Azure-Hosted IR: For cloud data movement.
Self-Hosted IR: For on-premises to cloud integration.
SSIS-IR: To run SQL Server Integration Services (SSIS) packages in ADF.
3️⃣ Data Flows
Mapping Data Flow: No-code transformation engine.
Wrangling Data Flow: Excel-like Power Query transformation.
4️⃣ Pipelines
Orchestrate complex workflows using different activities like copy, transformation, and execution.
5️⃣ Triggers
Automate pipeline execution using schedule-based, event-based, or tumbling window triggers.
4. Common Use Cases of Azure Data Factory in Hybrid Cloud
🔹 1. Migrating On-Premises Data to Azure
Extracts data from SQL Server, Oracle, SAP, and moves it to Azure SQL, Synapse Analytics.
🔹 2. Real-Time Data Synchronization
Syncs on-prem ERP, CRM, or legacy databases with cloud applications.
🔹 3. ETL for Cloud Data Warehousing
Moves structured and unstructured data to Azure Synapse, Snowflake for analytics.
🔹 4. IoT and Big Data Integration
Collects IoT sensor data, processes it in Azure Data Lake, and visualizes it in Power BI.
🔹 5. Multi-Cloud Data Movement
Transfers data between AWS S3, Google BigQuery, and Azure Blob Storage.
5. Best Practices for Hybrid Cloud Integration Using ADF
✅ Use Self-Hosted IR for Secure On-Premises Data Access ✅ Optimize Pipeline Performance using partitioning and parallel execution ✅ Monitor Pipelines using Azure Monitor and Log Analytics ✅ Secure Data Transfers with Private Endpoints & Key Vault ✅ Automate Data Workflows with Triggers & Parameterized Pipelines
6. Conclusion
Azure Data Factory plays a critical role in hybrid cloud data integration by providing secure, scalable, and automated data pipelines. Whether you are migrating on-premises data, synchronizing real-time data, or integrating multi-cloud environments, ADF simplifies complex ETL processes with low-code and serverless capabilities.
By leveraging ADF’s integration runtimes, automation, and security features, organizations can build a resilient, high-performance hybrid cloud data ecosystem.
WEBSITE: https://www.ficusoft.in/azure-data-factory-training-in-chennai/
0 notes