#Types of Candlestick Patterns
Explore tagged Tumblr posts
Visit Tumblr Blog
Explore Tumblr blogs with no restrictions, modern design and the best experience.
Last Seen Tumblr Blogs


Fun Fact
China blocked Tumblr because of pornography and censorship problems in 2013.
Text
Types of Candlestick Patterns Explained Simply

Types of Candlestick Patterns: A Beginner-Friendly Guide
Have you ever looked at a stock chart and felt like it was speaking a foreign language? Those little red and green bars—known as candlesticks—aren’t just random shapes. They tell stories. Stories of fear, greed, hesitation, and opportunity. If you've ever wished to understand those stories, you're in the right place.
In this article, we’re going to explore the types of candlestick patterns in a way that’s easy to grasp, even if you're brand new to trading. Think of candlestick patterns like emojis—small symbols packed with emotional context. Just as means happiness, a Hammer candlestick might signal a bullish reversal.
Explore types of candlestick patterns in simple terms. A complete guide to all types of candlestick patterns for beginners and curious traders.
Introduction to Candlestick Patterns
Candlestick patterns are visual tools used in stock trading to predict potential price movements. Each candlestick shows four key details: the opening price, closing price, highest price, and lowest price for a specific time frame.
These patterns originated in 18th-century Japan—yes, that far back!—when rice traders used them to predict future prices.
Why Candlestick Patterns Matter
Understanding candlestick patterns is like learning to read body language. While price tells you what happened, candlesticks hint at why. Are traders getting scared? Is there confidence building up? Candlestick patterns provide these answers through easy-to-spot formations.
Single Candlestick Patterns
Let’s begin with the simplest types. These involve only one candlestick and are often the first step for beginners.
The Hammer & Hanging Man
These two look nearly identical but mean very different things.
Hammer: Appears at the bottom of a downtrend. Think of it as the market “hammering out” a bottom. It has a small body and a long lower shadow.
Hanging Man: Shows up after an uptrend. Same shape as the hammer but signals a potential drop in price.
Tip: The color of the body isn’t as important as the position and size of the shadow.
Doji – The Market's Pause Button
The Doji is like a moment of hesitation. The opening and closing prices are nearly the same, forming a tiny body.
Types of Doji:
Neutral Doji: Price goes up and down, but ends unchanged.
Long-legged Doji: Large wicks on both sides, signaling major indecision.
Gravestone Doji: Looks like an upside-down “T” and suggests bearish pressure.
Dragonfly Doji: Resembles a “T” and may signal bullish strength.
Spinning Top – Indecision Alert
A Spinning Top has a small body and long upper and lower shadows. It signals that buyers and sellers fought hard but neither won.
It usually shows up during a trend and indicates a possible reversal or slowdown.
Marubozu – Full of Confidence
This candlestick has no shadows—just a solid body.
Bullish Marubozu: Opens at the low and closes at the high. Total buyer control.
Bearish Marubozu: Opens at the high and closes at the low. Total seller control.
Think of it like someone shouting, “I’m all in!” without hesitation.
Engulfing Patterns – Power Shifts
These are two-candlestick patterns that reflect changing momentum.
Bullish Engulfing: A small red candle followed by a large green one that "engulfs" it. Suggests a reversal to the upside.
Bearish Engulfing: Opposite of the above, often indicating a drop ahead.
Morning Star & Evening Star
These are three-candle patterns that often signal major turning points.
Morning Star: Appears after a downtrend. A long red candle, then a small one (any color), followed by a strong green candle. Signals a bullish reversal.
Evening Star: The bearish cousin. Appears after an uptrend.
Three White Soldiers & Three Black Crows
These are sequences of three strong candles.
Three White Soldiers: Three long green candles in a row. Very bullish.
Three Black Crows: Three long red candles. Very bearish.
These patterns indicate strong sentiment, either positive or negative.
Harami – Inside Moves
The Harami pattern looks like a small candle hiding inside a larger one.
Bullish Harami: Small green candle inside a large red one. Signals a possible reversal upward.
Bearish Harami: Small red inside a green. Signals a potential downturn.
Piercing Line & Dark Cloud Cover
These two-candle patterns are also all about reversal signals.
Piercing Line: A red candle followed by a green one that opens lower but closes past the midpoint of the previous red. Bullish sign.
Dark Cloud Cover: The opposite. Bearish sentiment taking over.
Tweezer Tops and Bottoms
Tweezer Top: Two or more candles with identical highs. Suggests price resistance and a possible drop.
Tweezer Bottom: Identical lows over two or more candles. Suggests price support and possible rise.
Think of tweezers picking the top or bottom out of a price trend.
How to Read Candlestick Patterns Together
One candle alone doesn't tell the full story. It's like reading just one sentence of a novel. To truly understand the plot, you need context. Combine patterns with:
Volume
Trend direction
Support and resistance levels
Tips for Using Candlestick Patterns Effectively
Don’t trade patterns in isolation. Always confirm with other indicators.
Practice makes perfect. Use demo accounts to test your pattern-reading skills.
Stay patient. Candlestick patterns are signals, not guarantees.
Conclusion
Candlestick patterns are like the facial expressions of the stock market. They give you hints, nudges, and sometimes loud warnings about what might happen next. Whether you’re just curious or planning to dive deeper into trading, understanding these patterns will help you navigate the charts with confidence.
Remember, while this article covers all types of candlestick patterns, experience and context make all the difference in using them effectively.
FAQs
What are candlestick patterns in simple terms? Candlestick patterns are visual tools on price charts that show how a stock's price moves during a certain period, helping predict future movements.
How many types of candlestick patterns are there? There are over 30 commonly used candlestick patterns, including single, double, and triple candlestick formations.
Are candlestick patterns reliable for trading? They can be helpful indicators but should always be used with other tools like volume and trend analysis for accuracy.
What is the most bullish candlestick pattern? The “Morning Star” and “Three White Soldiers” are among the most bullish, often indicating a strong reversal to the upside.
Can I use candlestick patterns in all markets? Yes! These patterns work in stocks, forex, commodities, and crypto markets, thanks to their universal price action behavior.
#types of candlestick patterns#all types of candlestick patterns#types of candlesticks#types of candlesticks and their meaning
0 notes
Link
Crypto Trading with Candlestick Charts
Crypto Trading
0 notes
Text
Candlestick Chart Patterns - An Essential to Earn Money Through Trading in Stock Market
Traders have been using Candlestick chart patterns for centuries to analyse price trends and predict market reversals. Developed in Japan during the 18th century, this technique gained popularity among rice traders before finding its way into modern financial markets. You might also like : Nifty 50 Prediction for Tomorrow What is a Candlestick Chart Pattern? A candlestick is a candle-like…

View On WordPress
#Bearish Candlestick Patterns#Bullish Candlestick Patterns#Candlestick Chart Patterns#Reversal Candlestick Patterns#Trading Candlestick Patterns#Types of Candlestick Patterns
0 notes
Text
Ghidul complet pentru înțelegerea formațiunilor de lumânări japoneze în trading
Așa cum am promis episodul trecut videoclipul de azi va fi despre formațiunile de lumânări japoneze.Rămâneți până la finalul videoclipului pentru că arăt exemple de formațiuni de lumânări și explic interpretarea graficelor în funcție de ele.
youtube
View On WordPress
#Acțiuni#administrare capital#brokeri#candlesticks patterns#clasele de active#Cătălin D. Iamandi#Cătălin Daniel Iamandi#dezvoltare personala#dividende#domeniu financiar#educatie financiara#ETF#Financial Education#Financial Success#finante personale#Fonduri mutuale#formațiuni de lumânări#independență financiară#investiții#investiții în acțiuni#investiții în ETF#Investing#investitor#motivatie#R-type Evolution#risc-randament#România#română#subtirare#surse suplimentare venit
1 note
·
View note
Text
How to Trade with Engulfing Candlestick Patterns
Engulfing Candlestick Patterns are a type of chart pattern used in technical analysis to predict market trends. They occur when a larger candlestick completely covers or “engulfs” the previous smaller one, signalling a potential reversal in price direction. There are two types of engulfing candlestick patterns, i.e., bullish engulfing pattern and bearish engulfing pattern. These patterns are a useful tool in determining entry and exit points for trade or understanding the market behaviour to make informed portfolio decisions.

Types of Engulfing Candlestick Patterns
How to Trade Using Engulfing Candlestick Patterns
Pros and Cons of Bullish Engulfing Candlestick Pattern
Pros and Cons of Bearish Engulfing Candlestick Pattern
#engulfing candlestick#types of engulfing candlestick pattern#bullish engulfing candlestick#bearish engulfing candlestick pattern
0 notes
Text
Dirty Work 2

Warnings: this fic will include dark content such as bullying, familial discord/abuse, and possible untagged elements. My warnings are not exhaustive, enter at your own risk.
This is a dark!fic and explicit. 18+ only. Your media consumption is your own responsibility. Warnings have been given. DO NOT PROCEED if these matters upset you.
Summary: You start a new gig and find one of your clients to be hard to please.
Characters: Loki
Note: Let me know if you want more. Didn't get too much on Part 1 but I have ideas so...
As per usual, I humbly request your thoughts! Reblogs are always appreciated and welcomed, not only do I see them easier but it lets other people see my work. I will do my best to answer all I can. I’m trying to get better at keeping up so thanks everyone for staying with me.
Your feedback will help in this and future works (and WiPs, I haven’t forgotten those!)
I love you all immensely. Take care. 💖

Your third week begins in the same place. Before the iron gate, the code unlocking the green maze within. You’re still just as impressed as your first day there. To you, it’s like a fantasy. Entirely unattainable but it’s right there. You can look, but you can’t touch… not beyond cleaning.
You linger outside, not thinking. You admire the tall tulips and the hedge trimmed to resemble some landmark you can’t quite place. You could see a place like this in an Austenian film or perhaps something Victorian. You don’t have an eye for the difference.
You key in the code for the backdoor and continue on. You put covers on your shoes and grab a fresh set of gloves. You’re getting into a pattern, though each client differs slightly. You put your things away and bring your water bottle with you. You bought a cool strap that keeps it against your hip, a small splurge with your first paycheck. The rest went to bills.
As you start on your usual journey through the many rooms of the airy house, you wonder how its sole resident isn’t lonely. Or perhaps he is. He doesn’t seem the type to admit to it. You turn your thoughts back to your work. You try not to think of him, truly, you don’t know much of him.
You take a candlestick and polish it. You move on the small globe; an ivory orb on a silver axes, the outlines of the continent carved into the surface. As you put it back, you notice something. An item you can’t recall being there before. You reach for it but stop as you realise it’s a camera.
You retract your hand and move on to dust the shelf itself. Does he not trust you or was it there before? Of course, somewhere like this would need security. There was a story just the other day about a break-in, but that was closer to your father’s where those culprits dwell.
The second floor is always easier. It seems even less lived-in than below. All but the study and the main bedroom. You flit in and out, checking points off the list until you’re content. You can only hope he will be too.
As you descend, the epiphany tickles your brain. It’s the first shift he hasn’t appeared. It’s easy to assume he’s busy. You don’t expect him to hang around. As if he would supervise you. Besides, that’s probably what the cameras are for.
You pack up and get your single refill of water. You leave the way you came, as you have twice before. The keypad flashes red to signal the lock is in place. You haul your kit higher on your shoulder and tread slowly along the little path along the side of the house.
You look at the gazebo trimmed in hanging ivy. It’s beautiful. You’d like to venture up and sit on that bench. Just sit and watch and smell and feel. You force the thought away and turn back along the stonework.
You’re going home. Not to pollen but tobacco smoke. Not to lush gardens but wilting strands in soggy mud. Not to immaculate floors and pristine decor but to stained walls and broken springs in your mattress.
Home, to another man that makes you nervous.
🧹
Your father is as he always is, smoking on the couch. You say hi as you come in with a bag of groceries, the prize for what was left of your check. He grumbles and flicks through the channels. You go to the kitchen to put away the food.
You’re almost at the end of your first month, a third of the way through your probationary period. Hopefully after that, you can pick up more clients. You shut the cupboard and go back to the living room. Your father coughs into a crumpled tissue. He sounds horrible. You can’t say so, he doesn’t seem to care.
“I got some fresh produce,” you announce proudly, “I’ll steam some veggies with the chops.”
“You get fries?” He growls.
“Uh, no,” you admit, “I thought we could eat something healthier–”
“I don’t like steamed veggies,” he drops the remote and grabs his pack of smokes.
“Oh, sorry, I was only thinking–”
“Don’t lie and say you were,” he snorts as he pulls out a cigarette and taps the end of the pack. “Go on, I’m tryna watch this.”
He nods at the television and you follow his gaze to the rerun of All in the Family. He’s seen them all before. You take the dismissal and retreat up to your room. Like you always do.
It’s always been like this. You don’t hate your father but sometimes it feels like he hates you. You put your kit and your water bottle on your dress and change into clean clothes. You lay in bed and close your eyes, trying to let go of the tension in your muscles.
You don’t remember your mom but he does. You assume that’s why he’s like this. It’s not you, it’s what happened. Tragic. A loss he won’t talk about.
You rub your forehead and let your arms fall to bend on either side of your head. You only ever saw one picture of your mother. You don’t think you look like her. She was pretty. And young. You were always too afraid to ask about her but you could tell she was younger than him. No one could’ve expected her to go so soon.
You close your eyes. It’s a strange sort of grief to miss someone who is only a shadow in your mind. Not even a voice, just this ghost you know by name. Mommy…
You blow out a deep breath in an effort to bid away the sadness. That was so long ago. This is now and you have a lot to worry about.
🧹
The Laufeyson house greets you once more with its elaborate brickwork. It’s starting to feel familiar, like a habit to put in the new code and walk along the winding path around to the back door. Six more numbers and you’re inside; shoe covers, gloves, bottle, and the list.
You always check the new email sent by the agency. There’s always something small and new squeezed into the bullet points. This week, you notice the first task is laundry.
‘Retrieve hamper from hallway. When hamper is left outside door, it means clothes must be washed.’
Easy enough. You go upstairs first and take the tall hamper from beside the door frame. It’s heavy and there’s no wheels to aid in your struggle. The laundry room is downstairs. Your descent is treacherous, one step at a time as you haul the basket down step by step. If Mr. Laufeyson is there, he can’t happy with the noise.
You finally get to the machine and follow the instructions about cycle type and separating colours from whites. However, there is only the bedding to be cleaned. You load the linens in and take a moment to figure out the touchscreen. Your father’s machine has a dial that only works on one setting and gives off a dingy stench.
You leave the basket in front of the washer and retreat to start your usual progression through the urban manse. Mop, sweep, dust, vacuum, polish; hallway, kitchen, dining room, sitting room… Nothing unusual or unexpected.
As you cross the narrow foyer to the den, the sunshine glows a warm orange through the slender windows on either side of the front door. The patterning of the glass reflects prettily on the floor. Despite your best efforts, you can’t help but imagine residing somewhere so brilliant.
You sigh and carry on. You’re sure to open the long drapes to let in the late spring sunshine. It’s not so bad working in the light and you can see where the rare spec of dust is hiding. You go to the tall shelf beside the record player and pull out the albums to wipe beneath them. Music would be jarring in a place always so silent.
You slip the albums back into place, pulling out one to admire the cover; Ane Brun. You’ve never heard of them. You read the track list curiously. You know you shouldn’t be wasting time.
“I don’t believe I’d have anything to your taste on my shelf,” the mocking slither has you pushing the album in line with the rest.
You almost apologise but you remember. You don’t speak. You just clean. So clean.
You glance over at Mr. Laufeyson as he struts in, a book held in one hand as his other is tucked in his pocket. He wears his usual pressed attire; a dark button-up and even darker slacks. You note that he has no tie that day. A single curl dangles by his temple as the rest of his black hair is precisely combed back.
You return to your tasks, gently wiping the cover of the record player and along the stand. You hear the book drop onto the low table before the sofa before his footsteps continue on; closer. He approaches as you get to the next shelf, a collection of EPs in unmarked sleeves.
You wince as he stops near you, flipping up the cover of the sleek record player before stepping back to peruse his selection. You do your best to keep on as he looms. The air is thick and suffocating. Should you go to the next room and come back?
He slips a record free of its sleeve and places it carefully on the players. He moves the needle over and flips the switch, a crackle before the sound drones from the tall standing speakers. Acoustic guitar with a gritty feel to it. The sudden addition of a woman’s voice jolts you; her tone is peculiar but not unpleasant.
When I woke I took the backdoor to my mind And then I spoke I counted all of the good things you are
He backs away without a word. Not an explanation. You finish cleaning the second shelf and dare to glance over. He reads his book on the couch, unbothered by your existence. That isn’t too unfamiliar.
You finish the space but leave the vacuuming for later. You wouldn’t want to ruin the music. You go into what you can only call a sunroom. The french doors peek out onto the garden and a patio set with a large dining set in white iron and glass.
The music drifts in and keeps you company. It almost makes the work easier. You make quick work and go to check the washer to switch over the load. Once you have the dryer figured out, you begin on the second floor.
It’s only as you come out of one of the guestrooms that you notice the silence is returned. You turn down the hallway and near the next door. You enter the study with your usual reverence. Something about the space is intimidating.
The large leather chair with its dimpled back and the even bigger desk; slabs of marble set into polished ebony. Shelves of a similar material, decked out with numerous volumes and the occasional ornament. Some appear even to be genuine artifacts. The rug at the centre is patterned in Persian style.
Behind the desk are a set of doors that open onto a balcony. The drapes are drawn shut. You find that is often the case. It’s a sombre and dark space hidden from the bright gardens without. Your tasks here are minimal. You use the hand vacuum and dust the shelves. You aren’t to touch the desk at all.
A shadow startles you as you drag the cloth along the edge of the bookshelf. Your eyes round and you look over as Mr. Laufeyson enters. You blanch but he doesn’t acknowledge you. He sighs and goes to the desk, sitting in the chair and wheeling it closer. You narrow your sights on the shelves; focus.
You feel a tremble but quickly shake it away. This is his home, he must be able to exist within it, but this feels strange, almost deliberate. Is he trying to make some point? To scare you? You remember the mention of those who came before you. Did they quit or did he dismiss them? Regardless, you can’t afford either.
It isn’t that difficult to follow the rules. Don’t speak? You haven’t much to say. You get closer as you advance along the shelves to the back of the office. He lets out another long exhale. His chair creaks, once, twice, and again.
“Hm,” he rolls back and swivels, an action you observe from the corner of your eye. He tuts and wheels back to the desk, resuming tapping on the keys of his slender laptop. The glow limns his silhouette sinisterly.
You rustle the drapes as you pass them and cross to the opposite shelves. As you brush over the spines of the books, you nearly drop the cloth. His low hum frightens you as he mimics the same melody that played from the speakers below. His tone is deep and sonorous, even delightful.
You squeeze the cloth and pause before regaining your composure. This cannot be a coincidence. The camera and now he’s following you. Or so it seems. Does he distrust you? What reason have you given him?
You are mindful to wipe down the bronze statue of what you assume is a viking warrior. You place it back staunchly, making sure your work is entirely visible to him. You are honest and you like to think you do your work well. Or at least, you try to. Perhaps if he sees that effort, he won’t be so suspicious.
As you head for the door, he quits his humming. His chair squeaks again.
“You are rather more thorough than the last,” he muses.
You stop and turn your head. You nod. He’s baiting you to break his number one rule.
“And you take orders well,” he adds blithely, “that is rare these days.” He taps a key again, “as you were.”
You take the dismissal in stride and flit off to your next task. It isn’t much, maybe only a statement of fact, but it’s something. He isn’t unhappy with your work. So far, neither are you.
#loki#dark loki#dark!loki#loki x reader#fic#dark fic#dark!fic#series#au#maid au#marvel#mcu#thor#avengers
320 notes
·
View notes
Link
#CandlestickAnalysis#candlestickpatterns#chartpatterns#ForexTrading#markettrends#MomentumTrading#priceaction#ReversalPatterns#riskmanagement#StockMarket#supportandresistance#technicalanalysis#TradingSignals#TradingStrategy#TrendContinuation
2 notes
·
View notes
Text
Hammer Candlestick: Make Reversal Opportunities
In the world of technical analysis, identifying potential market reversals is important for traders seeking to maximize their profits and minimize their losses. One of the most reliable patterns for spotting these reversals is candlestick patterns, especially hammer candlestick
What Is a Hammer Candlestick?
A hammer candlestick pattern is a specific type of candlestick pattern used in technical analysis to indicate a potential reversal in a downtrend. It appears at the bottom of a downward trend and is characterized by a small body at the upper end of the trading range with a long lower shadow. The length of the lower shadow is at least twice the length of the body. This pattern suggests that despite the sellers pushing prices down significantly during the trading period, strong buying pressure drove the prices back up near the opening price by the end of the period, indicating a possible reversal to the upside.
Types of Hammer Candlestick
Hammer Candlestick The hammer candlestick pattern appears at the bottom of a downtrend and is characterized by a small body with a long lower shadow and little to no upper shadow. The lower shadow should be at least twice the length of the body.
Inverted Hammer Candlestick The inverted hammer candlestick pattern also appears at the bottom of a downtrend but is characterized by a small body with a long upper shadow and little to no lower shadow. The upper shadow should be at least twice the length of the body.
Limitations of Hammer Candlestick
Confirmation Required: A hammer candlestick alone does not guarantee a trend reversal. Subsequent bullish price action is needed to validate it.
No Price Target: The pattern does not provide a specific price target for the potential reversal, requiring other tools for determining exit points.
Context-Dependent: The hammer pattern is most reliable at the bottom of a downtrend and may not be valid in other market conditions.
False Signals: In highly volatile markets, hammer patterns can occur frequently without indicating a true reversal.
Additional Indicators Needs: It will be more effective with other technical analysis tools, rather than relying solely on the hammer candlestick.
Learn more: https://finxpdx.com/hammer-candlestick-how-to-spot-reversal-opportunities/

5 notes
·
View notes
Text
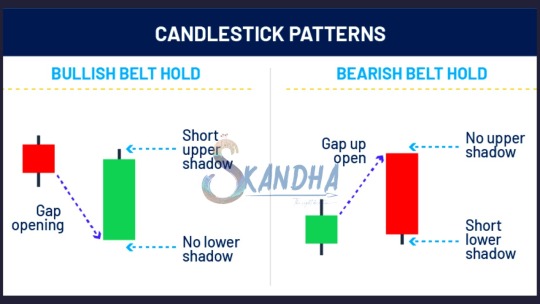
A belt hold pattern suggests that a trend may be reversing and indicates investor sentiment may have changed. When looking at them historically, there will often be a clear trend in one direction, followed by a clear trend in the other direction as the color of the candlestick changes.
There are two types of belt hold candlestick: one bullish and one bearish.
#skandhatrade #belthold #support #resistance #stock #chart #Trade #signal #patterns
#trend #Technicals #analysis #strategies #candlestick #priceaction #entry #supply #demand
To Learn More DM us
We Offer Paid Courses And Training Contact us Via
Email : [email protected]
https://forms.gle/8rWzz1gUuerxwVM49
Website: https://skandhatrade.com/
To Register for Learning:
2 notes
·
View notes
Text
What to Expect from the Best Stock Market Institute in Chandigarh: Courses, Trainers & More
In recent years, the Indian stock market has become more accessible than ever before. With the rise of user-friendly trading platforms, apps, and online brokers, more people are turning towards the stock market to build wealth or explore new career paths. But jumping into the market without the right education can be risky. That’s where finding the best stock market training institute in Chandigarh or Tricity becomes crucial.
If you're considering stepping into the world of share trading, enrolling in a structured training program can make a world of difference. Let’s walk you through what to expect from the Best Stock Market Institute in Chandigarh, including the kinds of courses offered, the expertise of trainers, and the real value you get.
1. Comprehensive Share Market Training in Chandigarh
Whether you’re a beginner or someone who already knows the basics, a great training institute will provide structured, step-by-step guidance. You can expect to start with the fundamentals—understanding how the stock market works, key terminologies, trading platforms, types of markets, and how to interpret data.
The best share market training in Chandigarh doesn’t just stop at theory. It helps you get practical exposure to:
Live market sessions
Technical analysis
Fundamental analysis
Portfolio building
Risk management
These components form the foundation of a solid Share Marketing Course in Chandigarh. The idea is to develop confidence, improve decision-making skills, and become an informed trader or investor.
2. Diverse Range of Courses for Every Level
One of the main features that define the best stock market training institute in Chandigarh is the variety of courses it offers. Every learner is different—some are freshers trying to understand the basics, while others are intermediate or even semi-experienced traders looking to sharpen their edge.
Here’s what you can usually expect:
a) Beginner Courses
Perfect for those starting from scratch. These focus on:
Introduction to stock markets
NSE/BSE structure
Basics of equity, derivatives, and mutual funds
Types of trading (Intraday, Delivery, Futures & Options)
b) Technical Analysis Courses
Technical analysis helps you read charts, study patterns, and make decisions based on historical price movements.
Topics include:
Candlestick patterns
Support & resistance
Indicators like RSI, MACD, Moving Averages
Trend lines and chart formations
c) Advanced Trading Strategies
Ideal for those who want to take trading seriously and develop strategies with a strong probability of success.
What you’ll learn:
Advanced charting tools
Algo trading basics
Trading psychology
Risk-reward ratio analysis
Managing volatility
The Best Stock Market Courses in Chandigarh are structured to give you a well-rounded education that goes beyond what you find in books or videos.
3. Qualified & Experienced Trainers
When searching for the Best Stock Market Institute in Chandigarh, you’ll want to know who’s teaching you.
A good institute hires experienced mentors who have not only taught trading but have also traded themselves. That practical knowledge is invaluable. The trainers should be approachable, open to questions, and passionate about helping you grow.
Some qualities to look for in trainers:
SEBI-registered professionals (if applicable)
Years of experience in live markets
Strong knowledge of both technical and fundamental analysis
Ability to simplify complex concepts
In the best institutes, trainers make sure you’re not just memorizing definitions—you’re learning how to apply knowledge in real-time market conditions.
4. Live Trading Sessions & Market Exposure
Theory is important, but in the world of share trading, practical exposure is everything.
The best share market training institute in Chandigarh will offer live market sessions where students can apply what they’ve learned in class. These sessions are conducted during actual trading hours, under the supervision of expert trainers.
You’ll get hands-on experience with:
Real-time chart reading
Entry and exit strategies
Managing trades during market volatility
Using trading platforms (like Zerodha, AngelOne, Upstox, etc.)
This kind of exposure helps you become market-ready and boosts your confidence as a trader.
5. Certification and Career Support
Some learners aim to become full-time traders. Others want to work as research analysts, investment advisors, or stockbrokers. The best stock market institute in Mohali and Chandigarh will support both goals.
Here’s what you can expect:
Certificate of completion
Assistance with SEBI exams (if you’re pursuing a career in finance)
Placement support or internship opportunities
Access to alumni networks and trading communities
These add-ons are incredibly helpful if you're looking to grow professionally in the stock trading or financial services industry.
6. Flexible Batches & Online Options
Life can be busy, especially if you're working or studying. The best stock market training institute in Tricity understands this and offers flexible class timings.
You may find:
Weekend and evening batches
Online live sessions
Recorded lectures for revision
One-on-one mentoring (in some cases)
This flexibility ensures you don’t have to put your career or studies on hold to pursue your interest in the stock market.
7. Affordability with Value
When evaluating a share and stock market training in Chandigarh, look for a balance between cost and quality. A good institute won't necessarily be the cheapest—but it will offer real value for your money.
What to look for:
Transparent fee structure
No hidden costs
Trial sessions or demo classes
Learning materials included
Avoid any institute that over-promises quick profits. Instead, choose one that is honest about market risks and focuses on your long-term learning.
8. Support Beyond the Classroom
Learning doesn’t stop once the course ends. The best stock market training institute Chandigarh continues to offer guidance even after the sessions are over.
Look for institutes that offer:
Telegram or WhatsApp groups for market discussions
Ongoing webinars or refresher sessions
Email/phone support from trainers
Access to updated resources
This kind of post-course support keeps you updated with market changes and helps build a sense of community among learners.
9. Candila Stock Trading in Chandigarh: Real Results, Real Learning
Institutes like Candila Education are setting benchmarks in providing high-quality Candila share trading in Chandigarh. The focus is not only on making you technically sound but also emotionally prepared for the ups and downs of the market.
You can expect:
Realistic expectations
Strong technical foundation
Focus on risk management
Exposure to both short-term and long-term trading styles
Candila’s training programs are designed with the learner in mind, combining education, mentorship, and experience to guide you through the market confidently.
Conclusion: Why Candila Education is the Right Choice
Whether you’re just starting out or looking to sharpen your trading strategies, finding the Best Stock Market Institute in Chandigarh can be a game-changer. From detailed courses and expert trainers to hands-on practice and post-course support, everything plays a role in shaping your trading journey.
Candila Education stands out as one of the best stock market training institutes in Chandigarh and across the Tricity region—including Mohali. With a variety of courses, live trading sessions, and knowledgeable mentors, Candila share trading in Chandigarh offers a complete package for aspiring traders and investors.
So if you're looking for Share Market Training in Chandigarh that actually prepares you for the real world, Candila Education is definitely worth exploring.

0 notes
Text
How Many Candlestick Patterns Are There

How Many Candlestick Patterns Are There? A Friendly Guide to Understanding the Basics
Understanding the world of trading can feel like learning a new language. And if you’ve ever seen a candlestick chart, you might’ve wondered, “What am I even looking at?” Don’t worry—you're not alone! Whether you're someone just getting into trading or simply curious about how it all works, this article will walk you through the mysterious world of candlestick patterns. We’ll break it down in a way that makes sense, no financial dictionary required.
Imagine candlestick patterns like traffic signals on the road of trading—they give hints about what might happen next. Some say, “Hey, the market might go up!” Others hint, “Watch out, things could go south.” So, how many candlestick patterns are there? Great question—let’s find out.
Learn how many candlestick patterns are there, different types of candlestick patterns, and what is candlestick patterns in simple language for beginners.
Introduction to Candlestick Patterns
Let’s start at the beginning. If you’ve ever seen a stock or cryptocurrency chart, you’ve probably noticed those little red and green rectangles—they're called candlesticks. They're not just colorful bars; they tell a story about price movement.
What is Candlestick Patterns?
Candlestick patterns are specific formations of these candles on a chart. Think of them as facial expressions of the market. Just like a smile can tell you someone’s happy, a certain pattern in candles can suggest whether the market is feeling bullish (going up) or bearish (going down).
Each candlestick gives four main pieces of information:
Open Price
Close Price
High Price
Low Price
Why Are Candlestick Patterns Important?
Imagine driving with your eyes closed. Sounds scary, right? That’s what trading without understanding patterns is like. Candlestick patterns act like headlights—they help traders see where the road might lead. While they don't guarantee success, they give valuable clues that many traders use to make decisions.
How Many Candlestick Patterns Are There?
Here’s the big question: how many candlestick patterns are there? Well, in total, there are more than 50 recognized patterns, but most traders focus on about 30 key ones. These patterns are grouped into:
Single Candlestick Patterns
Double Candlestick Patterns
Triple Candlestick Patterns
Each category offers insight into different possible future movements of the market.
Types of Candlestick Patterns
To make things easier, let’s break them down:
Single Candlestick Patterns
These involve just one candlestick. They're quick and simple.
Double Candlestick Patterns
These involve two candles and often signal a trend reversal.
Triple Candlestick Patterns
These use three candles to tell a more complete story about what the market might do next.
Let’s dig deeper into each one.
Single Candlestick Patterns
These are the building blocks of chart reading. They’re easy to spot and understand.
Doji
A Doji looks like a cross. It happens when the open and close prices are almost the same. It shows market indecision—like the market saying, “I’m not sure which way to go.”
Hammer
A Hammer looks like—you guessed it—a hammer! It has a small body with a long lower wick. It usually shows up at the bottom of a downtrend, signaling a potential reversal upward.
Inverted Hammer
Similar to the Hammer, but flipped upside down. It also signals a possible trend reversal, but needs confirmation from the next candles.
Double Candlestick Patterns
These patterns give a stronger message since they involve two candles working together.
Bullish Engulfing
This happens when a small red candle is followed by a big green candle that completely “engulfs” it. It signals a potential move upward.
Bearish Engulfing
The opposite of bullish. A small green candle is followed by a larger red one. This can signal a downward move ahead.
Tweezer Tops and Bottoms
These are two candles with matching highs (tops) or lows (bottoms). They can suggest that a trend is losing strength.
Triple Candlestick Patterns
When three candles join forces, the pattern becomes even stronger and more reliable.
Morning Star
This is a bullish reversal pattern made of three candles: a bearish candle, a small-bodied candle (which can be a Doji), and a bullish candle. It's like a sunrise—things are looking up!
Evening Star
The opposite of Morning Star. It begins with a bullish candle, followed by a small one, and ends with a bearish candle. It's a sign the sun is setting on an uptrend.
Three White Soldiers
This pattern consists of three strong green candles in a row. It’s a very bullish sign, showing continued buying pressure.
Three Black Crows
You guessed it—this one's bearish. It’s made of three long red candles in a row, suggesting strong selling pressure.
Common Mistakes When Reading Patterns
Let’s face it, we all mess up sometimes. Here are some pitfalls to avoid:
Relying on patterns alone: Always use other tools too.
Ignoring the bigger trend: A bullish pattern in a strong downtrend may not hold up.
Overtrading: Just because you see a pattern doesn’t mean you must act on it.
Tips for Learning Candlestick Patterns
Learning candlestick patterns is like learning to read emotions. Start small:
Practice with paper trading.
Use flashcards to memorize patterns.
Review historical charts to see how patterns played out.
Keep a trading journal to track your learning.
Conclusion
So, how many candlestick patterns are there? There are over 50—but don’t panic! You really only need to master about 30 core patterns to start making smarter decisions. Whether you’re an aspiring trader or just a curious learner, understanding these patterns is like having a window into the market’s soul.
Remember, candlestick patterns are tools—not magic tricks. Use them wisely, and always double-check with other indicators and research.
FAQs
How many candlestick patterns are there?
There are over 50 recognized candlestick patterns, but traders mostly use 30 key ones regularly.
What is candlestick patterns in simple terms?
They are visual representations of price movements in a chart. Each pattern gives clues about where the market might go next.
Are candlestick patterns accurate?
They can be helpful, but no pattern is 100% accurate. They're best used with other tools and indicators.
Can beginners learn candlestick patterns easily?
Absolutely! With practice, even beginners can understand and use them to make better trading choices.
What's the difference between bullish and bearish patterns?
Bullish patterns suggest prices may rise, while bearish patterns indicate a possible decline in prices.
#how many candlestick patterns are there#what is candlestick patterns#how to read candlestick pattern#types of candlestick patterns
1 note
·
View note
Text
What to Expect from the Best Stock Market Institute in Chandigarh: Courses, Trainers & More
In recent years, the Indian stock market has become more accessible than ever before. With the rise of user-friendly trading platforms, apps, and online brokers, more people are turning towards the stock market to build wealth or explore new career paths. But jumping into the market without the right education can be risky. That’s where finding the best stock market training institute in Chandigarh or Tricity becomes crucial.
If you're considering stepping into the world of share trading, enrolling in a structured training program can make a world of difference. Let’s walk you through what to expect from the Best Stock Market Institute in Chandigarh, including the kinds of courses offered, the expertise of trainers, and the real value you get.
1. Comprehensive Share Market Training in Chandigarh
Whether you’re a beginner or someone who already knows the basics, a great training institute will provide structured, step-by-step guidance. You can expect to start with the fundamentals—understanding how the stock market works, key terminologies, trading platforms, types of markets, and how to interpret data.
The best share market training in Chandigarh doesn’t just stop at theory. It helps you get practical exposure to:
Live market sessions
Technical analysis
Fundamental analysis
Portfolio building
Risk management
These components form the foundation of a solid Share Marketing Course in Chandigarh. The idea is to develop confidence, improve decision-making skills, and become an informed trader or investor.
2. Diverse Range of Courses for Every Level
One of the main features that define the best stock market training institute in Chandigarh is the variety of courses it offers. Every learner is different—some are freshers trying to understand the basics, while others are intermediate or even semi-experienced traders looking to sharpen their edge.
Here’s what you can usually expect:
a) Beginner Courses
Perfect for those starting from scratch. These focus on:
Introduction to stock markets
NSE/BSE structure
Basics of equity, derivatives, and mutual funds
Types of trading (Intraday, Delivery, Futures & Options)
b) Technical Analysis Courses
Technical analysis helps you read charts, study patterns, and make decisions based on historical price movements.
Topics include:
Candlestick patterns
Support & resistance
Indicators like RSI, MACD, Moving Averages
Trend lines and chart formations
c) Advanced Trading Strategies
Ideal for those who want to take trading seriously and develop strategies with a strong probability of success.
What you’ll learn:
Advanced charting tools
Algo trading basics
Trading psychology
Risk-reward ratio analysis
Managing volatility
The Best Stock Market Courses in Chandigarh are structured to give you a well-rounded education that goes beyond what you find in books or videos.
3. Qualified & Experienced Trainers
When searching for the Best Stock Market Institute in Chandigarh, you’ll want to know who’s teaching you.
A good institute hires experienced mentors who have not only taught trading but have also traded themselves. That practical knowledge is invaluable. The trainers should be approachable, open to questions, and passionate about helping you grow.
Some qualities to look for in trainers:
SEBI-registered professionals (if applicable)
Years of experience in live markets
Strong knowledge of both technical and fundamental analysis
Ability to simplify complex concepts
In the best institutes, trainers make sure you’re not just memorizing definitions—you’re learning how to apply knowledge in real-time market conditions.
4. Live Trading Sessions & Market Exposure
Theory is important, but in the world of share trading, practical exposure is everything.
The best share market training institute in Chandigarh will offer live market sessions where students can apply what they’ve learned in class. These sessions are conducted during actual trading hours, under the supervision of expert trainers.
You’ll get hands-on experience with:
Real-time chart reading
Entry and exit strategies
Managing trades during market volatility
Using trading platforms (like Zerodha, AngelOne, Upstox, etc.)
This kind of exposure helps you become market-ready and boosts your confidence as a trader.
5. Certification and Career Support
Some learners aim to become full-time traders. Others want to work as research analysts, investment advisors, or stockbrokers. The best stock market institute in Mohali and Chandigarh will support both goals.
Here’s what you can expect:
Certificate of completion
Assistance with SEBI exams (if you’re pursuing a career in finance)
Placement support or internship opportunities
Access to alumni networks and trading communities
These add-ons are incredibly helpful if you're looking to grow professionally in the stock trading or financial services industry.
6. Flexible Batches & Online Options
Life can be busy, especially if you're working or studying. The best stock market training institute in Tricity understands this and offers flexible class timings.
You may find:
Weekend and evening batches
Online live sessions
Recorded lectures for revision
One-on-one mentoring (in some cases)
This flexibility ensures you don’t have to put your career or studies on hold to pursue your interest in the stock market.
7. Affordability with Value
When evaluating a share and stock market training in Chandigarh, look for a balance between cost and quality. A good institute won't necessarily be the cheapest—but it will offer real value for your money.
What to look for:
Transparent fee structure
No hidden costs
Trial sessions or demo classes
Learning materials included
Avoid any institute that over-promises quick profits. Instead, choose one that is honest about market risks and focuses on your long-term learning.
8. Support Beyond the Classroom
Learning doesn’t stop once the course ends. The best stock market training institute Chandigarh continues to offer guidance even after the sessions are over.
Look for institutes that offer:
Telegram or WhatsApp groups for market discussions
Ongoing webinars or refresher sessions
Email/phone support from trainers
Access to updated resources
This kind of post-course support keeps you updated with market changes and helps build a sense of community among learners.
9. Candila Stock Trading in Chandigarh: Real Results, Real Learning
Institutes like Candila Education are setting benchmarks in providing high-quality Candila share trading in Chandigarh. The focus is not only on making you technically sound but also emotionally prepared for the ups and downs of the market.
You can expect:
Realistic expectations
Strong technical foundation
Focus on risk management
Exposure to both short-term and long-term trading styles
Candila’s training programs are designed with the learner in mind, combining education, mentorship, and experience to guide you through the market confidently.
Conclusion: Why Candila Education is the Right Choice
Whether you’re just starting out or looking to sharpen your trading strategies, finding the Best Stock Market Institute in Chandigarh can be a game-changer. From detailed courses and expert trainers to hands-on practice and post-course support, everything plays a role in shaping your trading journey.
Candila Education stands out as one of the best stock market training institutes in Chandigarh and across the Tricity region—including Mohali. With a variety of courses, live trading sessions, and knowledgeable mentors, Candila share trading in Chandigarh offers a complete package for aspiring traders and investors.
So if you're looking for Share Market Training in Chandigarh that actually prepares you for the real world, Candila Education is definitely worth exploring.

0 notes
Text
How to Use Technical Analysis in CFD Trading

In the world of financial markets, the use of technical analysis has become a cornerstone for many traders looking to predict future price movements and make informed decisions. Whether you're new to the world of trading or you're a seasoned investor, technical analysis can be a powerful tool for navigating the complexities of the markets, particularly when it comes to Contract for Difference (CFD) trading.
CFD trading offers traders the opportunity to speculate on the price movement of a wide range of assets without actually owning the underlying asset. This makes it a versatile and appealing option for both novice and experienced traders. However, in a market that moves rapidly and can be unpredictable, knowing how to read the charts, interpret the data, and make the right trading decisions can make all the difference. That's where technical analysis comes in.
Understanding Technical Analysis
At its core, technical analysis is the study of past market data, primarily price and volume, to forecast future price movements. It is based on the belief that historical price trends tend to repeat themselves, which allows traders to make educated predictions about future trends. While fundamental analysis looks at the intrinsic value of an asset by evaluating things like earnings reports and economic indicators, technical analysis focuses on price movements and chart patterns.
In CFD trading, technical analysis becomes an essential component of the decision-making process. Since CFDs allow traders to take advantage of both rising and falling markets, using technical analysis to spot potential entry and exit points is crucial for success.
The Tools of the Trade
Technical analysis in CFD trading involves a variety of tools and indicators designed to help traders interpret price movements and trends. Some of the most commonly used tools include:
Charts – Charts are the backbone of technical analysis. They visually represent price movements over time and allow traders to spot trends, patterns, and potential turning points in the market. The most popular types of charts used in CFD trading are line charts, bar charts, and candlestick charts.
Candlestick Patterns – Candlestick charts are widely used in CFD trading due to their ability to offer more detailed information about price movements. These charts display the open, high, low, and close prices for a given time period. By analyzing candlestick patterns, traders can identify signals of potential market reversals, continuation patterns, or trend strength.
Moving Averages – Moving averages smooth out price data to create a trend-following indicator. A simple moving average (SMA) is calculated by averaging the price of an asset over a specific time period, while an exponential moving average (EMA) gives more weight to recent price data. Moving averages are used to identify trends, support and resistance levels, and potential entry and exit points.
Relative Strength Index (RSI) – The RSI is a momentum oscillator that measures the speed and change of price movements. It helps traders assess whether an asset is overbought or oversold, which can indicate potential reversals or trend continuations. An RSI reading above 70 suggests an overbought condition, while a reading below 30 suggests an oversold condition.
Support and Resistance Levels – Support and resistance levels are key concepts in technical analysis, and they play a significant role in EpixFund. Support is a price level at which an asset tends to find buying interest, preventing the price from falling further. Resistance, on the other hand, is a level at which selling pressure tends to emerge, preventing the price from rising further. Identifying these levels helps traders anticipate potential price reversals or breakouts.
How to Use Technical Analysis in CFD Trading
Now that we understand the basic tools of technical analysis, let’s dive into how you can apply them in CFD trading to improve your chances of success.
1. Identifying Market Trends The first step in applying technical analysis to CFD trading is to identify the overall market trend. Trends can be classified as upward (bullish), downward (bearish), or sideways (neutral). Recognizing the direction of the trend is crucial for making informed decisions, as you’ll want to trade in the direction of the prevailing trend.
To spot a trend, traders often rely on moving averages and trend lines. For example, if the price of an asset is consistently above its 50-day moving average, it’s considered to be in an uptrend. On the other hand, if the price is below the moving average, it’s in a downtrend. Trend lines can also be drawn to connect higher lows in an uptrend or lower highs in a downtrend, helping traders visually confirm the trend’s direction.
2. Spotting Reversals with Candlestick Patterns Candlestick patterns are a powerful tool in CFD trading when it comes to identifying potential reversals. Certain candlestick formations, such as the hammer, engulfing, or doji patterns, can signal that a trend is about to change direction. For example, a bullish engulfing pattern, where a small bearish candle is followed by a larger bullish candle, often suggests that the market is about to reverse and start an uptrend.
By analyzing these patterns in conjunction with support and resistance levels, traders can make better-informed decisions on when to enter or exit trades. It’s important to combine candlestick patterns with other technical indicators to confirm signals before making any trading moves.
3. Using RSI to Confirm Overbought and Oversold Conditions The RSI is an essential tool for gauging market momentum and potential reversals. When the RSI reaches overbought or oversold conditions, it can indicate that the asset is due for a correction. For example, if the RSI exceeds 70, it may suggest that the asset is overbought, and a pullback could be imminent. Conversely, if the RSI drops below 30, it may indicate that the asset is oversold, potentially signaling an opportunity for a reversal to the upside.
However, it’s crucial to remember that the RSI should not be used in isolation. Combining the RSI with other technical analysis tools, such as support and resistance levels, can improve its accuracy in predicting potential price movements.
4. Identifying Breakouts and Breakdowns In CFD trading, breakouts and breakdowns represent key moments when an asset’s price breaks through a significant support or resistance level. These events often lead to large price movements, making them ideal opportunities for traders to capitalize on.
To spot a breakout or breakdown, traders often look for consolidations or price squeezes where the price is trapped between support and resistance. When the price finally breaks through one of these levels, it can signal the start of a strong trend. Using technical analysis tools such as trend lines, moving averages, and volume analysis can help confirm these breakouts and breakdowns, allowing traders to enter the market with confidence.
Conclusion
Technical analysis is a vital tool for traders involved in CFD trading, helping them make sense of market data, spot trends, and predict price movements. By using a combination of chart patterns, indicators, and technical tools, traders can enhance their decision-making process and improve their chances of success in the markets. Whether you are a beginner or an experienced CFD trader, mastering technical analysis is essential for navigating the ever-changing landscape of financial markets. As with all trading strategies, it’s crucial to practice, refine, and adapt your approach to maximize your potential for success in the world of CFD trading.
1 note
·
View note
Text
Master Basic Knowledge of Trading With ICFM

Build a strong foundation in financial markets through ICFM's Basic Knowledge of Trading program, offered by the renowned Institute of Career in Financial Markets. This essential course breaks down complex market concepts into digestible modules, perfect for beginners starting their trading journey. The curriculum covers fundamental principles including market terminology, candlestick patterns, and order types - the core basic knowledge of trading every investor needs.
The Institute of Career in Financial Markets teaches this basic knowledge of trading through practical, market-relevant examples rather than theoretical concepts alone. Students learn to read price charts, understand volume trends, and identify support/resistance levels through interactive sessions. The program emphasizes risk management fundamentals, teaching proper position sizing and stop-loss strategies early to develop disciplined trading habits.
What makes ICFM's approach unique is how they transform basic knowledge of trading into actionable skills. Participants practice on historical charts first, then progress to analyzing live market conditions under expert guidance. The course also covers trading psychology essentials, helping students avoid common emotional pitfalls that affect new traders.
ICFM's expert faculty simplify complex topics like technical indicators and market trends without overwhelming beginners. Many students use this basic knowledge of trading program as a stepping stone to ICFM's advanced courses in derivatives and algorithmic trading. The institute provides certificates upon completion, validating your foundational market understanding.
Start your financial markets education right with the Institute of Career in Financial Markets. Their structured approach to teaching basic knowledge of trading gives beginners the confidence to progress to more sophisticated strategies. Enroll today to build your trading competence on a solid foundation crafted by market professionals.
0 notes
Text
Certificate in Technical Analysis | Learn Market Trends
Unlock the secrets of smart trading with our Certificate in Technical Analysis course — a complete guide to understanding price action, market trends, and trading indicators. This program is ideal for beginners, intermediate traders, and finance professionals who want to master the art of analyzing charts, patterns, and technical signals to make informed trading decisions.
The course covers key topics such as chart types, support & resistance, trendlines, moving averages, RSI, MACD, candlestick patterns, and trading psychology. With a mix of theoretical instruction and real-time market examples, you’ll gain practical skills that are directly applicable in stocks, commodities, forex, and crypto markets.
Led by experienced market analysts, the course includes live sessions, recorded modules, quizzes, and a certificate upon completion. Whether you're trading part-time or looking to build a career in financial markets, this certification will give you the confidence and tools to analyze markets effectively and trade smartly.
0 notes
Text
How to Read Market Charts: A Beginner’s Tutorial
Most tools that are used in trading and investing involve charts as one of their main components hence the need to better understand them. Regardless of whether one is conducting forex trading or stocks trading or cryptocurrency trading involving commodities, it would always be very useful to understand how the charts work. Here are the main steps outlined in this tutorial:
1) Understanding basic market chart elements;
2) How to read various charts;
3) Practical recommendations on employing charts successfully.
A brief guide into the Concept of Charts in Market realization
A market chart is basically a graphical representation of the price change of a specific traded financial product over a defined period of time. From the information highlighted above, there are several forms of market charts, some of which are line charts, bar charts, and candle stick charts. Every type of chart gives a unique vision of the price data achieved in terms of supporting the traders in analyzing the trends, patterns, and possible trade opportunities. A line chart is the most basic form of the market chart where a straight line is plotted on a graph connecting the closing price of a security to the next at a given time period.
The advantage of this type of chart is that it helps the trader acquire a wider view of the market by indicating the price level trends, but its tendency has limited detail as regards the variations in the prices within the trading intervals. It should be noted that bar charts and candlestick charts give a broader perspective. A bar chart can also be used to represent the OHLC prices for each period, in which the vertical bars give results of the price extent. The Candlestick chart is as same as OHLC but expresses them with color. Candles are used to express data and provide a simplistic user interface. According to the color code, the green or the white candle represents the bullish trend since the closing price is higher than the opening price whereas the red or black Coloradoans represent the bearish trend due to the lower closing price as compared to the opening price.
Interpreting Key Chart Components
It is important to note that the primary components of each displayed chart, as well as the overall meaning of these items, should be identified in order to read the charts appropriately. These aspects are time horizon, price scale, and volume. The time axis in a chart means how long a single data point in a chart refers to. They could take as little as one minute or as long as one month. One-minute or five-minute charts can be effective when used by day traders to get the opportunity to make gains from short-term shifts in prices. Among the approaches that are used by investors, one of the most common is the approach of looking at the charts in order to find a way of indicating the changes in the prices in the future. Like any other indicator, trends function in the same capacity they convey the general directional movement of a specific market and may either be bullish, bearish, or a sideways trend. The price scale located on the left side of the chart represents the prices of the security that is been charted. There are two main types of price scales: This is incurred by either linear or logarithmic. The linear price scale features uniform intervals between the price values and can be appropriate in case the price transitions are small and the price analysis is conducted over a short-term period.
Identifying Trends and Patterns
Looking at market charts is one of the techniques that investors use when they want to develop a way of anticipating the changes in the prices in the future. Trends work in the same way that they represent the overall tendency of a particular market, which could either be an upward or bullish trend, a downward or bearish trend, or a horizontal or sideways trend. One of the key benefits of analyzing trends is, therefore, identifying them at their early stage to increase the chances of getting good returns when seeking to trade. They remain one of the most effective and powerful instruments even though they are relatively uncomplicated to explain and use.
The Up Trending Channel is constructed by joining the higher low points whereas the down Trending channel is established by joining the lower high points. By saying so, the nearer the Price Touches the Trend Line, without penetrating it the more frequently the trend is considered to be confirmed. One of the identification patterns for future market trends is the reversal patterns that include the head and shoulders, double tops or bottoms, and triangles. For example, the head and shoulders pattern is commonly used to show that a new trend of a downtrend is about to occur when there has been an uptrend, and the double bottom is used to show that a new trend of an uptrend is likely to occur from a downtrend. It is helpful to the trading activity in the same way that it is helpful to understand weather patterns – it helps one anticipate major price swings in an asset.
Using Technical Indicators
An appropriate technical indicator is a quantifiable figure computed from the price, volume, or open interest chart data. They are utilized in trading to demarcate areas of entry and exit and the primary direction of a trend. Some of the commonly used indicators include the moving averages, Relative Strength index (RSI) and Bollinger bands. Moving averages are useful in analyzing prices because they remove noises in price data to reveal the imitated trend. The two primary types of moving averages are the simple moving average (SMA) and the exponential moving average (EMA). While SMA calculates the average of the prices in a given span of time, EMA gives more weight to the more recent price and therefore is more suggestive of changes in price. The Relative Strength Index or RSI, as it is commonly known, calculates a stock’s strength and the rate of its change, ranging from 0 to 100.
When the RSI figure stands above 70, it means that the stock is overbought and is in need of correction downward; whereas if the figure stands below 30, then, it is a sell signal which indicates that the security is oversold and due for revival. This indicator, called the Bollinger Bands, has a center line to which two other bands are drawn, normally one standard value above and below the middle band which is generally set at 20 days SMA. The bands adjust depending on the movement of the market, thereby making it easier to predict it. Where the price is nearer the upper band it may be overbought, whereas if the price shifts nearer to the lower band then it may be oversold.
Practical Tips for Reading Market Charts
Many new entrants are often unable to clearly understand what exactly is being said in the charting of the various markets. But if one pays attention to it, with time and with some useful everyday techniques, it is easier to understand. Begin by choosing one type of charting technique and only a few indicators at first. When working with the stock prices, one should begin with Candlestick charts with Moving Averages and RSI. Altogether, these elements offer a clear picture of price movements, long-term trends, and even potential entries and exits. Create specific daily guidelines for the analysis of charts. First, you need to find out the trend and then try to look for the behavior in an effort to try and use technical analysis simply to filter occurrences. Rational thinking involves a systematic approach to making decisions as opposed to emotional ones.
Conclusion
Fundamental knowledge of a particular market as well as understanding of its behavior in the form of market charts is an important aspect for any trader or investor. Generally, an appreciation of the fundamental features of different sorts of charts, including key components, trends, patterns, and technical indicators will pave the way for making a good beginning in trading for new entrants into the trading fraternity. It is however important to understand that learning how to use those charts is one skill that requires time, resource, s and practice. Market charts help you to identify trends and signals for buying or selling a certain security, and the more you trade, the more you shall get familiar with the charts and thus be able to interpret them powerfully. It is recommended to audit the trades and the chartist research made by you to assess the fields where you are strong and which areas are lacking. It is actually important that you record everything that you do in the field of trading, essentially because this will help you figure out if you are making any mistakes or not, and it will also help you keep track of your progress more or less.
For More Info:-
online trading platform
economic calendar
0 notes