
Don't wanna be here? Send us removal request.
Statistics
We looked inside some of the posts by codingforcreativepractices and here's what we found interesting.
Average Info
Notes Per Post
0
Likes Per Post
0
Reblog Per Post
0
Reply Per Post
0
Time Between Posts
3 days
Number of Posts By Type
Text
15
Video
2
Last Seen Tumblr Blogs


Fun Fact
Tumblr’s reach among the 26-to-35-year-olds in the US is 11%.
Text
Week 12 - Exhibition and Reflection
This week was the time of the exhibition. I used my final tangent stitch attempt as my final design and I displayed all of my previous development attempts as I picture the patch being sold by a charitable organisation and my previous attempts although no my favourite could be part of a range of different patches.

We walked around and looked at everyones work and they were all very cool and creative!! I really enjoyed getting to see everyones work finished and get feedback on my own.

I wrote my finalised workflow on the name tag given to me.

Reflection
I am overall very happy with how my design turned out. I thinking that it showed the data in an interesting and creative way in a method that is aesthetically pleasing. Most people agreed that the tangent stitch appear more clear than the perpendicular stitch so I am very pleased that I explored that option. I like the colour choice and how it is relevant to the data I sampled and the feedback I got from the exhibition was very positive!
Although, what I think could have been improved in my work was if I had the resources available to try and see how the patch would have looked using black thread. I feel as though that may have elevated the design on the white fabric and it would have then incorporated all of the colours of the Syrian flag. Furthermore, If I could have had a plain back pack that I could sew the patch onto that would have made the entourage images look even better!
0 notes
Text
Week 11 - Entourage images
All below are examples of where the product could go, how it can be used etc.

This is a plain tilted picture of the design with shadowing to display the design without distraction.
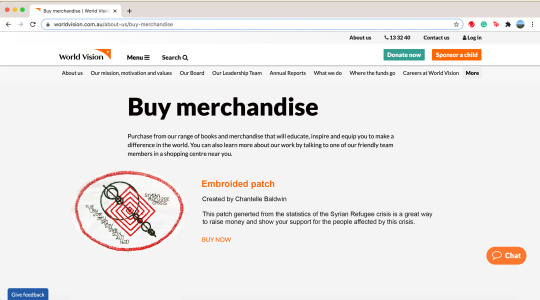
I want to use it so it is used as a way to fundraise money and for people to show their support. So, above is an example of what it would look like if it were sold on the World Vision Website.


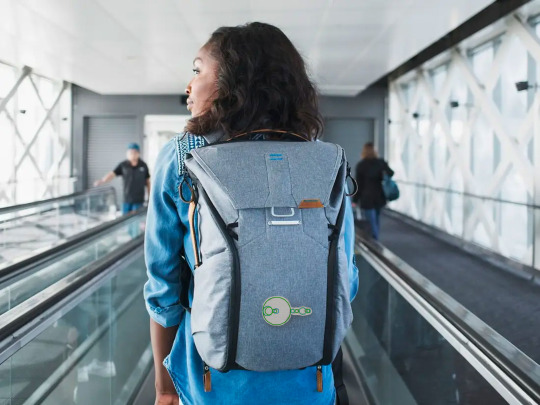
Above is images of the patch being placed on different areas of my backpack showing that it could go in multiple places. Connecting to the original idea I had for this patch.

A blanket could be another option of where the patch could be placed. This connects again with this idea of the challenges that the refugees would face.

Same concept as the blanket by putting the patch on a jacket has the same connections with necessities and connects whoever purchases the patch back to the original issue.
0 notes
Text
Week 11 - FINAL INFORMATION
WORKFLOW
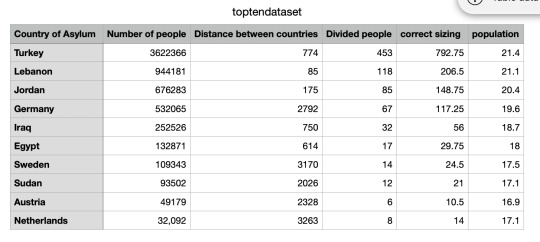
Data set (Number of people escaping Syria and how many fleeing to each country (top ten amount of people, also each of those countries distance from Syria and Syria’s population stats over the past 10 years) ->
Processing ->
.dst file ->
Digital embroider ->
Create a patch that can be sold through charitable organisations to the public to raise awareness, fundraise and show support for the people in this situation.
CODE
import processing.embroider.*;
PEmbroiderGraphics E;
Table dataSheet;
void setup() {
background(255);
fullScreen();
float cx = width/2;
float cy = height/2 - 40;
E = new PEmbroiderGraphics(this, width, height);
String outputFilePath = sketchPath("PEmbroider_tangent.dst");
E.setPath(outputFilePath);
E.beginDraw();
dataSheet = loadTable("toptendataset.csv", "header");
println (dataSheet.getRowCount());
println (dataSheet.getInt(0, 4));
E.fill(0, 0, 0);
E.strokeSpacing(5);
E.setStitch(10, 50, 0);
E.strokeMode(PEmbroiderGraphics.PERPENDICULAR);
E.textSize(1.5);
E.stroke(125,125,125);
E.text("TUR", 350, 370);
E.text("LBN", 390, 410);
E.text("JOR", 430, 450);
E.text("DEU", 470, 490);
E.text("IRQ", 510, 530);
E.text("EGY", 550, 570);
E.text("SWE", 590, 610);
E.text("SDN", 630, 650);
E.text("AUT", 670, 690);
E.text("NLD", 710, 730);
E.text("SYRIAN", 970, 250);
E.text("REFUGEE", 1010, 290);
E.text("CRISIS", 1050, 330);
E.stroke(255,0,0);
E.strokeWeight(10);
E.line(550, 150, 1080, 680);
E.noFill();
E.stroke(0, 255, 0);
E.strokeWeight(30);
E.strokeSpacing(5);
E.ellipse (cx+80, cy, 1100, 780);
E.translate(width/2, 0);
E.rotate(radians(45));
E.scale(0.5);
E.strokeSpacing(6.5);
E.strokeMode(PEmbroiderGraphics.TANGENT);
E.beginCull();
for (int i=0; i<10; i++) {
float value1 = dataSheet.getInt(i, 2);
float m = map(value1, 85, 3263, 170, width-80);
float value2 = dataSheet.getInt(i, 4);
float n = map(value2, 14, 792.75, 100, 800);
float value3 = dataSheet.getInt(i, 5);
float o = map(value3, 16.9, 21.4, 100, 800);
E.strokeWeight(20);
E.stroke(0, 0, 0);
E.noFill();
E.ellipse(m, height/2, n, n);
E.stroke(0, 100, 100);
//rect((width/2)-dataSheet.getInt(i,5)*10,(height/2)-dataSheet.getInt(i,5)*10,dataSheet.getInt(i,5)*20,dataSheet.getInt(i,5)*20);
E.rect(((width/2)-(o/2)), (height/2)-(o/2), o, o);
}
E.endCull();
E.optimize();
E.endDraw();
E.visualize();
}
void draw() {
}

FINAL OUTPUT

0 notes
Text
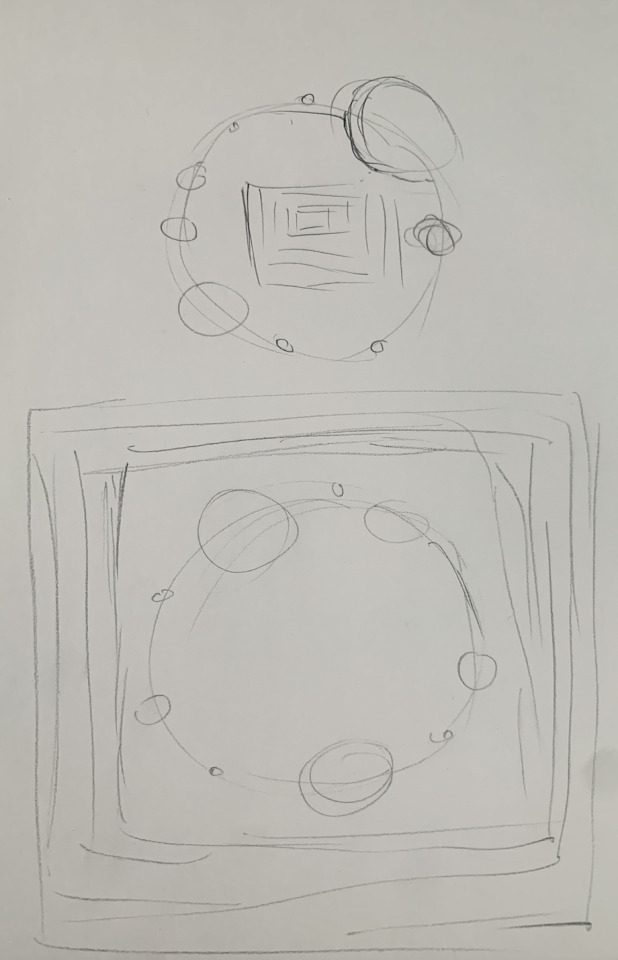
Week 11 - Final Development
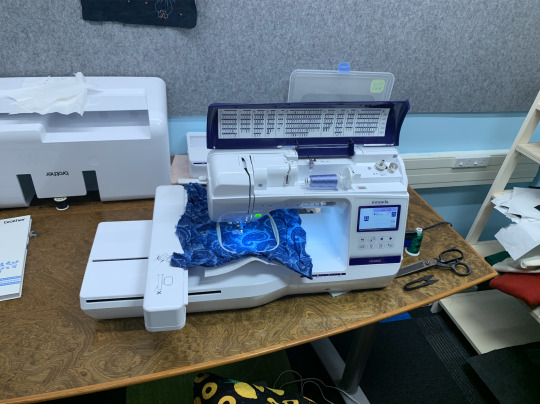
FIRST BOOKING
On the Friday after week 10′s class I was suspicious that the scaling might be affecting the embroidery which is why it wasn’t smoothly going on so I did a quick test run adjusting the settings for the scaling to see if it would work correctly.
Below is the code that I quickly created at the end of last class to see how it when
import processing.embroider.*; PEmbroiderGraphics E;
void setup() {
fullScreen(); background (255); E = new PEmbroiderGraphics(this, width, height);
String outputFilePath = sketchPath("line_test4.dst"); E.setPath(outputFilePath); E.beginDraw();
E.strokeSpacing(5); E.setStitch(10, 50, 0); E.strokeMode(PEmbroiderGraphics.PERPENDICULAR);
E.stroke(100,0,200); E.strokeWeight(15); E.line (100,100,100,400);
E.stroke(150,100,0); E.strokeSpacing(2.5); E.setStitch(5, 25, 0); E.ellipse (100,500,100,100);
E.stroke(0,130,100); E.scale (2); E.line (150,100,150,400);
E.stroke(150,100,0); E.strokeSpacing(2.5); E.setStitch(5, 25, 0); E.line (200,100,200,400);
E.optimize(); E.endDraw();
E.visualize(); }


The output was what was shown above and it worked perfectly creating this so I then decided to create the code without the so I then had some extra time so I decided to attempt my updated design the edit from the last embroidery was that Tim mentioned that it might be a good idea to create some sort of boarder around the design to make it more obvious that it is a patch.
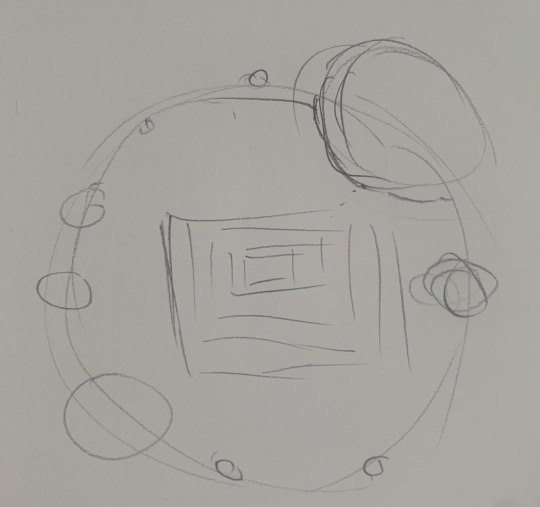
So, I went onto the PEmbroider library a got the hello world outline of the smiley face so I had an outline that I know works in code. It then took quite a few attempts at resizing so that the design was in the middle of the design.
It was also suggested to me that the writing was quite small on my last attempt and not fully visible so I increased the sizing of that from 1 to E.textSize(1.5); and created a space between the lines of the rows.
Because of the increase in the size of the text and the ellipses shape it meant that in the previous position some of the words went out of the boundaries of the patch. So, to make it fit an introduced them on an angle to follow the flow of the design. And by doing that I also changed the title to be on a sloping between the rows as it made if work better compositionally.


Above is me trying to find the position I want it in

Changing the stroke spacing that so that it can be done on the embroidery machine.


Also to help with the overlapping of the stitches I introduced the E.beginCull(); function this flattens it into one image basically and so there is no overlaps of stitches. it then has E.endCull(); after the code of what you want to be flattened.


The issues with this one was it for some reason didn’t stop for the biggest circle and incorporated it as part of the line meaning it was a different colour from the rest of the circles. Also the thread broke whilst doing the surrounding edges and although I backed it up a few stitches to join them back together it was further enough back creating the gap in the badge.
SECOND BOOKING


To try and incorporate the black as well I attempted to put it on black fabric and use some white thread. The white thread I soon found out was not good for embroidery it continuously broke and created uneven pattern and most of it the green bobbin thread was showing through the other side. But asides from the technical problems I also was not sure about having all of the squares and the circles red as I do want to create some contrast between the two which translated to my next attempts.and the black fabric overall I didn’t think was anywhere near as effective as white fabric.
My last attempt of that day was transferring it back onto white fabric and I tested out the different colour combinations.


Unfortunately, as you can see if you look closely at the centre of the second image on the last 30 stitches of the design there was an issue with the bobbin thread and it caused it to build up like that. Which was sad on an otherwise very cool design.
I still wasn’t completely convinced on that colour through as I felt as though it brought too much attention to the squares as with the darkness of the green contrasted from the red. and the red of the circles did not stand out as much.
FINAL BOOKING


This was the final test of colours and a absolutely loved how this one looks and so when I was finished with this one I was curious about how the patch would look if it were to be rectangular so I edited the code (positioning of the text and the outline). The code is shown below.
import processing.embroider.*; PEmbroiderGraphics E;
Table dataSheet; void setup() {
background(255); fullScreen();
E = new PEmbroiderGraphics(this, width, height);
String outputFilePath = sketchPath("PEmbroider_square.dst"); E.setPath(outputFilePath); E.beginDraw();
dataSheet = loadTable("toptendataset.csv", "header"); println (dataSheet.getRowCount()); println (dataSheet.getInt(0, 4));
E.fill(0, 0, 0); E.strokeSpacing(5); E.setStitch(10, 50, 0); E.strokeMode(PEmbroiderGraphics.PERPENDICULAR); E.textSize(1.5); E.stroke(125,125,125);
E.text("TUR", 390, 320); E.text("LBN", 390, 360); E.text("JOR", 390, 400);
E.text("DEU", 390, 440); E.text("IRQ", 390, 480); E.text("EGY", 390, 520);
E.text("SWE", 390, 560); E.text("SDN", 390, 600); E.text("AUT", 390, 640); E.text("NLD", 390, 680);
E.text("SYRIAN", 970, 160); E.text("REFUGEE", 970, 200); E.text("CRISIS",970, 240);
E.stroke(255,0,0); E.strokeWeight(10); E.line(550, 150, 1080, 680);
E.noFill(); E.stroke(0, 255, 0); E.strokeWeight(30); E.strokeSpacing(5); E.rect (320,60, 925,680);
E.translate(width/2, 0); E.rotate(radians(45)); E.scale(0.5); E.strokeSpacing(6.5); E.beginCull(); for (int i=0; i<10; i++) { float value1 = dataSheet.getInt(i, 2); float m = map(value1, 85, 3263, 170, width-80); float value2 = dataSheet.getInt(i, 4); float n = map(value2, 14, 792.75, 100, 800); float value3 = dataSheet.getInt(i, 5); float o = map(value3, 16.9, 21.4, 100, 800);
E.strokeWeight(20); E.stroke(0, 0, 0); E.noFill();
E.ellipse(m, height/2, n, n); E.stroke(0, 100, 100); E.rect(((width/2)-(o/2)), (height/2)-(o/2), o, o);
}
E.endCull(); E.optimize(); E.endDraw();
E.visualize(); }
void draw() { }


Although I do like the design I do think that the circle one is more successful in my opinion although we could always create a range of different style variations and it could be sold as a range of different patches.
Although this is not my final it was still worth having a look at.
I had a revelation at the end of my last booking that the stitches do look quite rough in the inner pattern and maybe I could change it to a tangent stroke style and see if that will make the image even more punchy.
I kept the surrounding outline stitch as perpendicular as that is what stops the fabric from fraying.


And it showed up so much more clear than before in previous versions and is a lot smoother with no sign of the colour of the bobbin thread below. In the code the line that changed in order for this to happen was that E.strokeMode(PEmbroiderGraphics.PERPENDICULAR); was changed to E.strokeMode(PEmbroiderGraphics.TANGENT);
0 notes
Text
Week 10 - Further Artist Research
I am looking more so at people who work in data visualisation as they can always be transferred into an embroidered design.
Jer Thorp
He is a data artist born in Canada. I looked into his work as he centres his work around circles and a thread like structure that could possible translate very nicely into an embroidery format.
His use of colours within the work makes it very engaging and separates between the different pieces of data. Furthermore, the use of text allows the view to gain context as to what this is representing.
Below the visualizations show the top organizations and personalities for every year from 1985 to 2001. Connections between these people & organizations are indicated by lines.
https://www.jerthorp.com/365


The two following images is the word frequency of the New York Times shown in different times.


Above is the data for the New York times word frequencies but shown only using RGB colours in the data.
Below are links to videos, articles etc. about is work...
https://www.youtube.com/watch?v=-q6aA5qdCzU&feature=emb_logo
https://mashable.com/2012/12/11/data-visualization-jer-thorp/
https://www.jerthorp.com/
Giorgia Lupi
http://giorgialupi.com/
Giorgia Lupi is a very talented information designer who explores many different topics of data to create pieces of art that also have a message. Although, her stuff does not look similar to mine I LOVE ALL HER WORKS. So, this is more about me fangirlling over this amazing artist! I highly recommend going to her website and reading through some of her creations.


All I can say about the piece above is it’s amazing click the link and read!!!
http://giorgialupi.com/a-dialogue-between-four-hands-my-ongoing-collaboration-with-kaki-king

Blurb on piece above - Clinical records alone hardly capture the impact the illness of a child has on a family. This is how we used music and art to understand and communicate the information that was missing.
She has also created a data driven fashion collection http://giorgialupi.com/giorgia-lupi-otherstories and it is incredible the garments that she is making!
0 notes
Text
Week 10 - First Embroidery Attempt
Colour choices for the thread...

Above is just a composition that I liked. However, it occurred to me that those colours do not have anything to do with the issue that it is on and by having five colours combined with the design being slightly complex. It could result in it being way too busy for it to be aesthetically pleasing. Lastly the neutral tones may be not bold enough for a patch that could potentially go on a bag for example with existing colours and patterns.

Above is the flag of Syria and also the newly developed flag that was developed for refugee and have no flag to represent them. A colour scheme based on either of these flags is much more relevant than the one I liked.


I was undecided when I arrived at the embroidery machine, so I decided to see what colour and tones of thread they had on offer before I finalised my colour scheme. On hand they had every colour except for the black and were running extremely low on the white thread. So I decided that to have the option to to the multicolour and see how it looks in the design I will go with the second option. I could involve the black by putting the design on a black fabric, but if I were to chose the other option the design would have to be solid orange.
This soon became irrelevant, as you may tell.
My first try at the embroidery machine after the induction I had MANY difficulties. I found out that the code translated into 5cm by 6cm design on the fabric and although this was slightly smaller than I had anticipate in comparison to a backpack it actually was a good size.
But, before I got to that point of having it finished I firstly could not get it working as the bobbing and upper thread kept breaking. And furthermore, the blue colour of the bobbin thread was coming through to the top layer despite having a reasonably thick backing layer.
First, we went back to my code where we looked and found that the strokeSpacing; was way too small that the embroidery machine could not handle it so by scaling that up from 2 to 5 I then proceeded to try again and the same issues kept occurring. After changing the setting in my code multiple times we looked at the bobbin. And someone had left sewing thread instead of embroidery thread on it explaining why it kept breaking and showing through the top fabric.

All of my attempts including my semi successful one.

So, by this attempted we had edited all of the setting in my code multiple times because I was under the time pressure I totally forgot to screenshot the code in it’s different states.
But, the last attempt the thread kept breaking, so I decided to do a test run from one of the designs from the PEmbroider library to see if there was something wrong with the machine or with my code.


Although the thread broke multiple times the end test run came out pretty good. Although because of all the difficulties I didn’t get to try out the different colour combinations.
0 notes
Text
Week 10 - Turning into embroidery file
I will not insert every change in code with the full code as this will take a ridiculous amount of room on my blog. But I will explain what code changed between the edits.
For many and I do mean MANY attempts it did not work but soon it gave the output shown below the letters had changed size dramatically so I will need to attempt to format how to fix that.
But also with this example the shapes have an embroidery fill. I do want to experiment with the type of hatching used and also whether the shapes should have hatching at all or they should remain the outlines.
Below is the first successful attempt at the code producing an output.
import processing.embroider.*; PEmbroiderGraphics E;
Table dataSheet; void setup() {
background(255); fullScreen();
E = new PEmbroiderGraphics(this, width, height);
String outputFilePath = sketchPath("PEmbroider_test.dst"); E.setPath(outputFilePath); E.beginDraw();
dataSheet = loadTable("toptendataset.csv","header"); println (dataSheet.getRowCount()); println (dataSheet.getInt(0,4));
E.fill(0,0,0); E.strokeSpacing(10); E.textSize(32);
E.text("TUR", 510, 500); E.text("LBN", 510, 520); E.text("JOR", 510, 540); E.text("DEU", 510, 560); E.text("IRQ", 510, 580); E.text("EGY", 510, 600); E.text("SWE", 510, 620); E.text("SDN", 510, 640); E.text("AUT", 510, 660); E.text("NLD", 510, 680);
E.strokeWeight(7); E.line(515, 110, 1080, 680);
E.translate(width/2, 0); E.rotate(radians(45)); E.scale(0.5); for(int i=0; i<10; i++) { float value1 = dataSheet.getInt(i,2); float m = map(value1, 85, 3263 , 170, width-80); float value2 = dataSheet.getInt(i,4); float n = map(value2, 14, 792.75 , 100, 800); float value3 = dataSheet.getInt(i,5); float o = map(value3, 16.9, 21.4 , 100, 800); //ellipse(m, 200, 10, 10); //ellipse(n, 200, 10, 10); //ellipse((dataSheet.getInt(i,2)/3)+140, height/2, dataSheet.getInt(i,4), dataSheet.getInt(i,4)); //ellipse(m, height/2, dataSheet.getInt(i,4), dataSheet.getInt(i,4)); E.fill(100,200,0); E.strokeWeight(15); E.stroke(i * 10,200,i*20);
E.ellipse(m, height/2, n, n); //rect((width/2)-dataSheet.getInt(i,5)*10,(height/2)-dataSheet.getInt(i,5)*10,dataSheet.getInt(i,5)*20,dataSheet.getInt(i,5)*20); E.rect(((width/2)-(o/2)),(height/2)-(o/2),o,o);
} E.optimize(); E.endDraw();
E.visualize();
}
void draw() { }

The change that was made from the attempt above to the one previous was the change in text size. It changed from E.textSize(32); to E.textSize(10); which still the text was unusually large compared to the view before the embroidery.

This is a result of reduction of the strokeSpacing from E.strokeSpacing(10); to E.strokeSpacing(2); to see if that would help the lettering.
And it did not this is because the stroke spacing is just changing the distance between each of the strokes so it changes the size of the stitches instead of the size of the lettering or shapes itself.

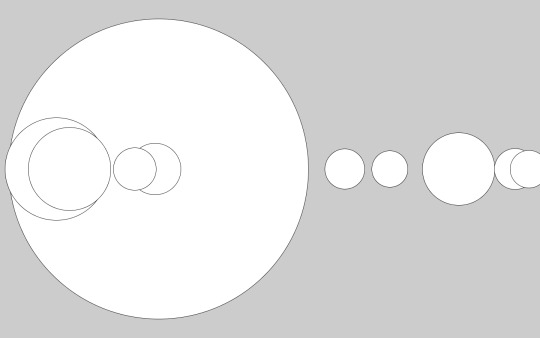
The transformation from the above to the code below was just the addition of the no fill function E.noFill();. This means that there is no hatching of the shapes and the end product will only show the outlines.
This initially was to help me see the lettering, but I do like the appearance of it much better without the fill. It allows for the individual shapes to stand out more so from a compositional POV.

I managed to get the text down to its original size by setting the text size down to 1 E.textSize(1); to be completely honest I don’t know why this is and why the text become so disproportionately large. I am assuming that the number within the brackets multiplied with the original size of the text instead of being the value of the text itself.

I then added the text of the Syrian Refugee crisis. I did this for purpose of if someone were to see the badge they would know the context immediately. Furthermore, helping bring light to the issue and fulfilling the initial purpose of the badge. E.text("SYRIAN REFUGEE CRISIS", 700, 800);

Change in positioning of the code this was more so for the aesthetics of the badge and try to balance out the design. Pulling into my initial words that I was focusing on Balance and Movement.
I mimicked the overlapping of the countries when pushing “crisis” onto the row below.
This is were I left the code for my first attempt on the embroidery machine.

import processing.embroider.*;
PEmbroiderGraphics E;
Table dataSheet; void setup() {
background(255); fullScreen();
E = new PEmbroiderGraphics(this, width, height);
String outputFilePath = sketchPath("PEmbroider_test.dst"); E.setPath(outputFilePath); E.beginDraw();
dataSheet = loadTable("toptendataset.csv","header"); println (dataSheet.getRowCount()); println (dataSheet.getInt(0,4)); E.fill(0,0,0); E.strokeSpacing(2.5); E.textSize(1); fill(0, 102, 153); E.text("TUR", 510, 500); E.text("LBN", 510, 520); E.text("JOR", 510, 540); E.text("DEU", 510, 560); E.text("IRQ", 510, 580); E.text("EGY", 510, 600); E.text("SWE", 510, 620); E.text("SDN", 510, 640); E.text("AUT", 510, 660); E.text("NLD", 510, 680); E.text("SYRIAN REFUGEE",850,120); E.text("CRISIS",1010,140); E.strokeWeight(7); E.line(515, 110, 1080, 680); E.translate(width/2, 0); E.rotate(radians(45)); E.scale(0.5); for(int i=0; i<10; i++) { float value1 = dataSheet.getInt(i,2); float m = map(value1, 85, 3263 , 170, width-80); float value2 = dataSheet.getInt(i,4); float n = map(value2, 14, 792.75 , 100, 800); float value3 = dataSheet.getInt(i,5); float o = map(value3, 16.9, 21.4 , 100, 800); //ellipse(m, 200, 10, 10); //ellipse(n, 200, 10, 10); //ellipse((dataSheet.getInt(i,2)/3)+140, height/2, dataSheet.getInt(i,4), dataSheet.getInt(i,4)); //ellipse(m, height/2, dataSheet.getInt(i,4), dataSheet.getInt(i,4));
E.strokeWeight(15); E.stroke(0,0,0); E.noFill();
E.ellipse(m, height/2, n, n); //rect((width/2)-dataSheet.getInt(i,5)*10,(height/2)-dataSheet.getInt(i,5)*10,dataSheet.getInt(i,5)*20,dataSheet.getInt(i,5)*20); E.rect(((width/2)-(o/2)),(height/2)-(o/2),o,o);
} E.optimize(); E.endDraw();
E.visualize();
}
void draw() { }
0 notes
Text
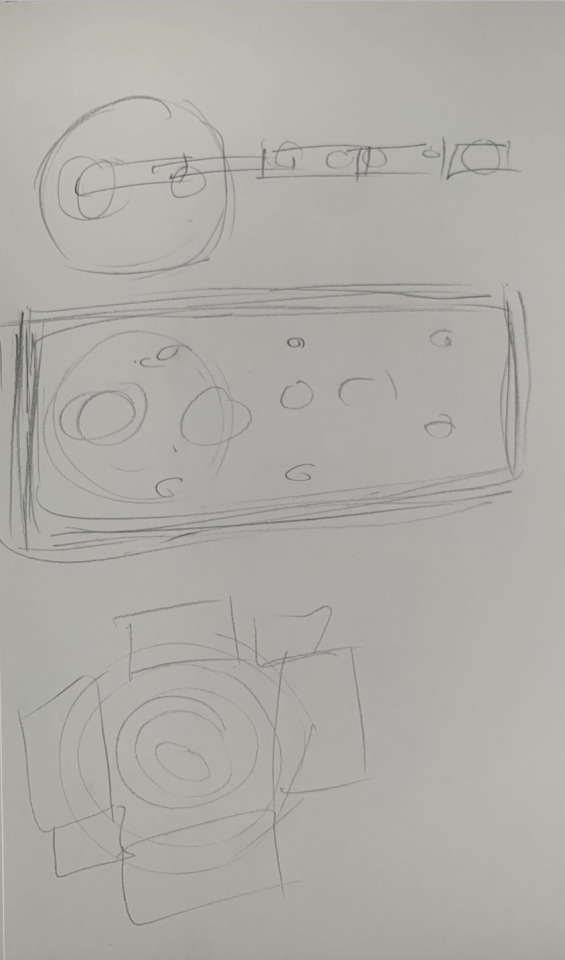
Week 10 - Assignment Development

Below are entourage images that I created with this code...


I decided that this design that I had created although cool was not detailed enough. So, I wanted to incorporate some sort of squares or rectangles into the design to give a nice contrast to the circles that were already there.
That’s when I decided to have a look at some more the of the stats where I stumbled upon the population stats of Syrian over the past years and during the crisis. And as the results were decreasing and that could create a cool pattern in the centre of the design. like the squares are getting smaller and smaller going with my word of movement.
What my data sheet was looking like at this point.

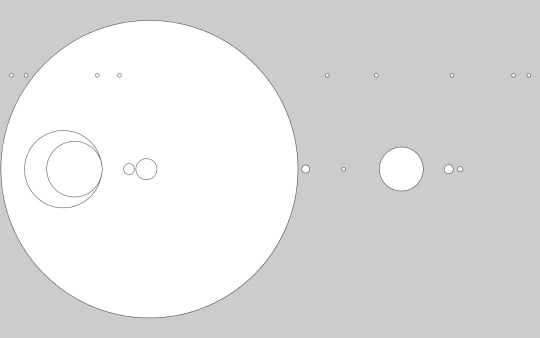
Below is the code that I created for the design shown below, but I kept in the comments the line of how I originally accessed the information from the data for the rectangle. rect((width/2)-dataSheet.getInt(i,5)*10,(height/2)-dataSheet.getInt(i,5)*10,dataSheet.getInt(i,5)*20,dataSheet.getInt(i,5)*20); not only is this a very long and complicated section on code, but it also doesn’t come up with the sizing that I wanted.
So, I decided to similar to the circles use mapping to turn the data into a range of data that is much easier to deal with.
void setup() {
background(255); fullScreen(); dataSheet = loadTable("toptendataset.csv","header"); println (dataSheet.getRowCount()); println (dataSheet.getInt(0,4));
for(int i=0; i<10; i++) { float value1 = dataSheet.getInt(i,2); float m = map(value1, 85, 3263 , 170, width-80); float value2 = dataSheet.getInt(i,4); float n = map(value2, 14, 792.75 , 100, 800); float value3 = dataSheet.getInt(i,5); float o = map(value3, 16.9, 21.4 , 100, 800); //ellipse(m, 200, 10, 10); //ellipse(n, 200, 10, 10); //ellipse((dataSheet.getInt(i,2)/3)+140, height/2, dataSheet.getInt(i,4), dataSheet.getInt(i,4)); //ellipse(m, height/2, dataSheet.getInt(i,4), dataSheet.getInt(i,4)); fill(100,200,random(255),0); strokeWeight(15); stroke(100,200,random(255),50); ellipse(m, height/2, n, n); //rect((width/2)-dataSheet.getInt(i,5)*10,(height/2)-dataSheet.getInt(i,5)*10,dataSheet.getInt(i,5)*20,dataSheet.getInt(i,5)*20); rect((width/2)-(o/2),(height/2)-(o/2),o,o);
}
}
void draw() { }

When I added the squares it produced the outcome above and I wasn’t completely happy with that so I decided to see if I could rotate it 45 degrees to create a diamond instead. I firstly tested this out in just word to see how it would look and I liked the outcome and decided to move forward.
Table dataSheet;
void setup() { background(255); fullScreen(); dataSheet = loadTable("toptendataset.csv","header"); println (dataSheet.getRowCount()); println (dataSheet.getInt(0,4)); translate(width/2, 0); rotate(radians(45)); scale(0.5); for(int i=0; i<10; i++) { float value1 = dataSheet.getInt(i,2); float m = map(value1, 85, 3263 , 170, width-80); float value2 = dataSheet.getInt(i,4); float n = map(value2, 14, 792.75 , 100, 800); float value3 = dataSheet.getInt(i,5); float o = map(value3, 16.9, 21.4 , 100, 800); //ellipse(m, 200, 10, 10); //ellipse(n, 200, 10, 10); //ellipse((dataSheet.getInt(i,2)/3)+140, height/2, dataSheet.getInt(i,4), dataSheet.getInt(i,4)); //ellipse(m, height/2, dataSheet.getInt(i,4), dataSheet.getInt(i,4)); fill(100,200,random(255),0); strokeWeight(15); stroke(random(255),100,random(255));
ellipse(m, height/2, n, n); //rect((width/2)-dataSheet.getInt(i,5)*10,(height/2)-dataSheet.getInt(i,5)*10,dataSheet.getInt(i,5)*20,dataSheet.getInt(i,5)*20); rect(((width/2)-(o/2)),(height/2)-(o/2),o,o);
}
}
void draw() { }

The code above is the successful attempt at trying to get this to rotate the correct amount of distance. Because of the loop embedded in the code I had first put this function inside of that loop which caused each loop of code to rotate again and they were scattered across the screen, but also a lot of them had rotated off the screen. The rotate function itself though was fine rotate(radians(45)); the rotate function is automatically in radians this means that by putting radians(45) it converts the 45 degrees into the radian equivalent which processing could then produce an output from.
Then once I discovered that the rotate function being embedded in the for loop was causing issues I moved it to the top of the code. When that was solved because the original took up most of the width of the screen when rotated a lot of it proceed to rotate out of the screen view. So we used the translate to move it back into view translate(width/2, 0); this function variables stand for translate(x, y); so by moving half of the width it moved the code half of whatever the width was to the right.
Lastly because the original was so large it was impossible to see the whole design on the screen as part of it fell off. To reduce the size of it I needed to use the scale function. The scale function changes the size of any of the variables and functions below it. So, in my code I used scale(0.5); this scales everything down by 0.5 which effectively means it halved the size of the output. For example if you were to scale it by 3 it would become three times the original size.

I wanted to once again add more to the patch and I decided to try and include an element of text. I though that I could take the country of asylum’s name and use their alpha-3 code names. This was done by just inserting the text function into the code.
I had fun repositioning the text until I found that I liked the letters slightly overlapping with the row above. I felt like it made it more dynamic.

But I then wanted to experiment with some different elements like using lines nor for purpose of showing any data but, just to test how the

What I needed to do from here is to try and make it into a file that can be embodied. When changing it to an embroidery file this meant adding the base lines to the code and seeing how it turns out. From doing this I really enjoyed how that came out.
The code for this is shown in the next post turning this into an embroidery file.
0 notes
Text
Week 9 - Assignment Progress
Links and info on chosen issues...
https://www.pewresearch.org/global/2016/08/02/number-of-refugees-to-europe-surges-to-record-1-3-million-in-2015/
https://journals.sagepub.com/doi/pdf/10.1177/233150241500300301
https://journals.tplondon.com/ml/article/view/274
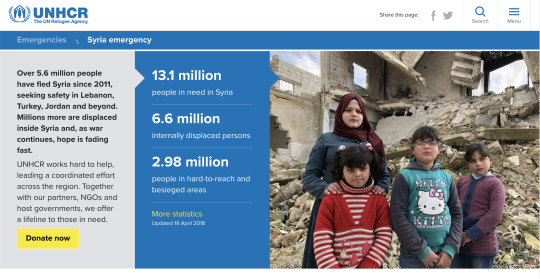
https://www.unrefugees.org/news/syria-refugee-crisis-explained/
https://www.unhcr.org/syria-emergency.html
The Syrian refugee crisis is the result of a March 2011 violent government crackdown on public demonstrations in support of a group of teenagers who were arrested for anti-government graffiti in the southern town of Daraa. As violence increased, families began to flee. Within two months, the first refugee camps opened in Turkey – by March 2013, more than 1 million people had fled Syria. Today, 12 million Syrians are displaced from their homes and more than a million Syrian children have been born in exile.
Finding the data...
I have decided that the data that I am going to use is going to be the number of people that are exiting Syria and where they are going (distance) depending on what types of statistics I can find...
https://data.humdata.org/dataset/unhcr-global-trends-forced-displacement-in-2019-data
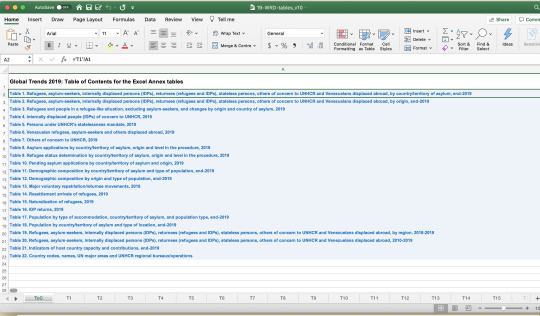
Whilst searching for some relevant data found the site above which links to a 2019 data of the displaced people of Syria and where they relocated and has a lot of other data that I will have to sort through. But this seems like a very promising set of data.
From the data I gathered all the information that I would need from the table. The distances although were not in the table which means that I had to manually find the distance from Syria to each of the individual countries.

Even though this is a very promising start to my project I noticed one issue off the bat and that was the numbers themselves. Because there is 3.6 million people that went to Turkey and 14 people that went to Algeria this posed an issue. Firstly because a number like 3.6 million is very difficult for processing to deal with, but usually we would simply divide to reduce them to a number that we are able to handle much easier. The issue with that is that the smaller numbers like the 14 that went to Algeria would become infinitely small.
This means that I have a choice...
- I could either priorities the data and make it so I use the top 10 results or how ever many I want to use.
- Use a technique that was mentioned by Tim called Mapping that can change the original number range and you can set it at your personal number range.
- Or change the data that I am using and focus on a different area.
Putting the numbers into Processing...
Although, I haven’t set on how I am going to manipulate the data so it will work in a way that is visually appealing to the audience, I still want to make sure I have the basics of the code down. This way no matter the data I use I will still be on the right track.
Table dataSheet;
void setup() { size (600,600); //fullScreen(); dataSheet = loadTable("numberStats.csv","header"); //println (dataSheet.getRowCount()); println (dataSheet.getInt(3,0));
for(int i = 0; i < 4; i++) { strokeWeight (3); stroke (0); fill(255,0,0); ellipse(width/2, height/2, dataSheet.getInt(i,0)/20, dataSheet.getInt(i,0)/20);
} //ellipse(50,50,50,50); }
void draw() {
}
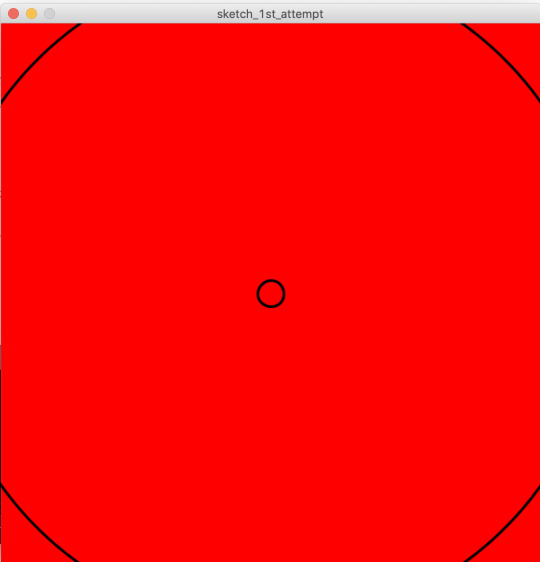
The code shown above is the code I used to creates that output and although I do understand this output is not successful at all at representing my chosen data set it is still a good indicator that I am using my code correctly.
Using the Top 10...
Table dataSheet;
void setup() { size (2000,950); dataSheet = loadTable("toptendataset.csv","header"); println (dataSheet.getRowCount()); println (dataSheet.getInt(0,3));
for(int i=0; i<10; i++) { ellipse(width/2, height/2, dataSheet.getInt(i,3), dataSheet.getInt(i,3));
}
}
void draw() { }

The circles above were displaced because the sizing of the canvas was incorrect so to change to the picture below I simply changed the size (2000,950); to fullScreen();
Playing with sizing...
Went back into the data sheet and times the data by 2 to create what is shown below.

Now this is too big

Playing with layout...
I then inserted the data of the distance between the countries into the x-position of the ellipse function.
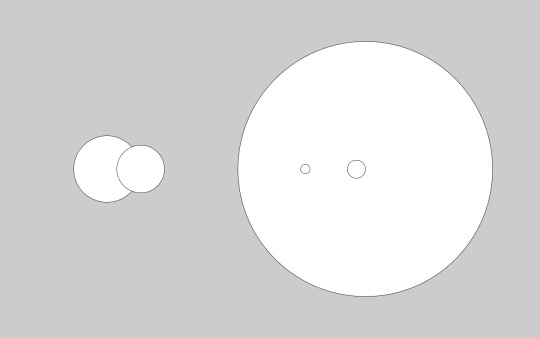


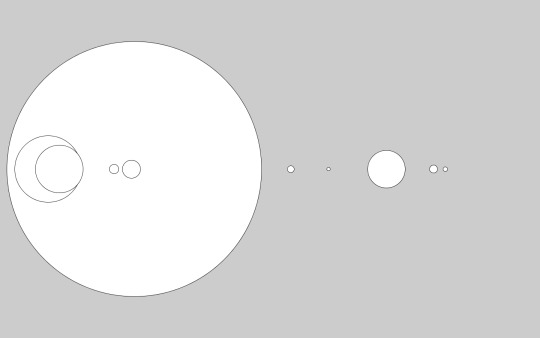

Table dataSheet;
void setup() { fullScreen(); dataSheet = loadTable("toptendataset.csv","header"); println (dataSheet.getRowCount()); println (dataSheet.getInt(0,4));
for(int i=0; i<10; i++) { ellipse((dataSheet.getInt(i,2)/3)+100, height/2, dataSheet.getInt(i,4), dataSheet.getInt(i,4));
}
}
void draw() { }
This is the code from the last attempt of the positioning.
Attempting to use the map function on the data...
After some research into mapping
https://processing.org/reference/map_.html
map(value, start1, stop1, start2, stop2)
Table dataSheet;
void setup() { fullScreen(); dataSheet = loadTable("toptendataset.csv","header"); println (dataSheet.getRowCount()); println (dataSheet.getInt(0,4));
for(int i=0; i<10; i++) { float value = dataSheet.getInt(i,2); float m = map(value, 85, 3263 , 30, width-30); ellipse(m, 200, 10, 10); ellipse((dataSheet.getInt(i,2)/3)+140, height/2, dataSheet.getInt(i,4), dataSheet.getInt(i,4));
}
}
Inserting the m value into the ellipses line of code I did this first just to assess if I had copied the code correctly.

I then applied it to the data ellipse themselves and it worked well which is why in the next image I just adjusted the starting point of the new range so all of the circles were visible.

Table dataSheet;
void setup() { fullScreen(); dataSheet = loadTable("toptendataset.csv","header"); println (dataSheet.getRowCount()); println (dataSheet.getInt(0,4));
for(int i=0; i<10; i++) { float value = dataSheet.getInt(i,2); float m = map(value, 85, 3263 , 150, width-30); //ellipse(m, 200, 10, 10); //ellipse((dataSheet.getInt(i,2)/3)+140, height/2, dataSheet.getInt(i,4), dataSheet.getInt(i,4)); ellipse(m, height/2, dataSheet.getInt(i,4), dataSheet.getInt(i,4));
}
}
void draw() { }
The transition from the image above to the image below was the change in the range that I chose to

Decided to add random colouring mainly for the purpose of myself being able to differentiate between the circles.
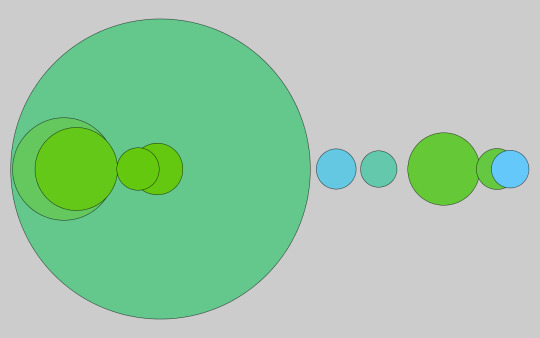
Table dataSheet;
void setup() { fullScreen(); dataSheet = loadTable("toptendataset.csv","header"); println (dataSheet.getRowCount()); println (dataSheet.getInt(0,4));
for(int i=0; i<10; i++) { float value1 = dataSheet.getInt(i,2); float m = map(value1, 85, 3263 , 170, width-80); float value2 = dataSheet.getInt(i,4); float n = map(value2, 14, 792.75 , 100, 800); //ellipse(m, 200, 10, 10); //ellipse(n, 200, 10, 10); //ellipse((dataSheet.getInt(i,2)/3)+140, height/2, dataSheet.getInt(i,4), dataSheet.getInt(i,4)); //ellipse(m, height/2, dataSheet.getInt(i,4), dataSheet.getInt(i,4)); fill(100,200,random(255)); ellipse(m, height/2, n, n);
}
}
void draw() { }


Any other options of data sets...
I feel as though my design is too simple so I am going to try and incorporate another data set or attempt to do something else with my current data set.
I have found some population statistics over the past 10 years in Syria and I think I am going to try and incorporate that into my code. The
I have become keen on the idea of using rectangles within my design.

Table dataSheet;
void setup() { fullScreen(); dataSheet = loadTable("toptendataset.csv","header"); println (dataSheet.getRowCount()); println (dataSheet.getInt(0,4));
for(int i=0; i<10; i++) { float value1 = dataSheet.getInt(i,2); float m = map(value1, 85, 3263 , 170, width-80); float value2 = dataSheet.getInt(i,4); float n = map(value2, 14, 792.75 , 100, 800);
//ellipse(m, 200, 10, 10); //ellipse(n, 200, 10, 10); //ellipse((dataSheet.getInt(i,2)/3)+140, height/2, dataSheet.getInt(i,4), dataSheet.getInt(i,4)); //ellipse(m, height/2, dataSheet.getInt(i,4), dataSheet.getInt(i,4)); fill(100,200,random(255),50); ellipse(m, height/2, n, n); rect((width/2)-dataSheet.getInt(i,5)*5,(height/2)-dataSheet.getInt(i,5)*5,dataSheet.getInt(i,5)*10,dataSheet.getInt(i,5)*10);
}
}
void draw() { }
After I did some research into the issue I have decided to focus on creating a patch to display my data this way it can be fixed to a backpack, t-shirt, blanket etc.
So I needed to find a way to present it that would. be effective as a badge and a more aesthetic way of displaying the data.
Back to the drawing board...
My attempts at trying to find an idea that would work using both the ellipses and rectangles.
Out of the designs that I had I became very fond of the last 3rd one as I feel it would provide an aesthetic patch whilst also displaying the data.
What this means for the code...
This means that I will need to isolate the turkey statistic, without removing it from the distance data.
It will also mean placing the rectangles in the centre of the circle and potentially using the
Intro to Digital Embroidery...
So I then went to the embroidery induction on 30th September, where we learnt how to use the digital embroidery machine using the inputs created from processing.
import processing.embroider.*; PEmbroiderGraphics E;
void setup() { size (600,600); E = new PEmbroiderGraphics(this, width, height);
String outputFilePath = sketchPath("PEmbroider_test.dst"); E.setPath(outputFilePath);
E.beginDraw();
E.stroke(0,0,0); E.strokeWeight(10); E.strokeSpacing(2);
E.fill(0,0,0); E.hatchMode(E.SATIN); E.rect(100,100,300,300);
E.textSize(2); E.textAlign(CENTER); E.textFont(PEmbroiderFont.DUPLEX); E.text("PEmbroider",250,250);
E.optimize(); E.endDraw();
E.visualize();
}
void draw() {
}
To make the file an embroidery file you basically need to add E. before each line that you want to apply to the embroidery. The code must always start with import processing.embroider.*; followed by PEmbroiderGraphics E; this is all defining that it is an embroidery document so processing can register it.
0 notes
Text
Week 8 - Assignment progress
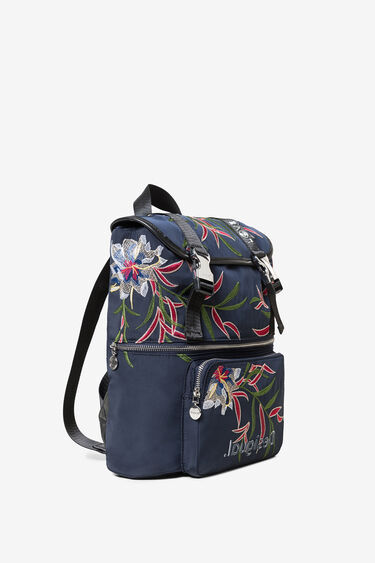
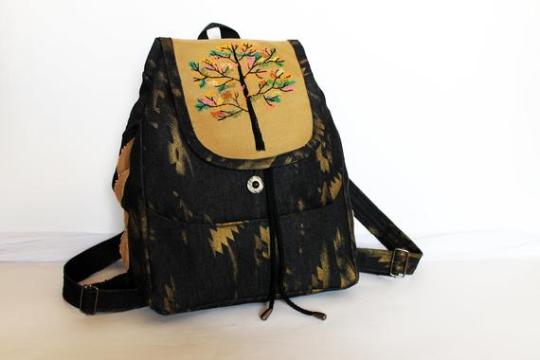
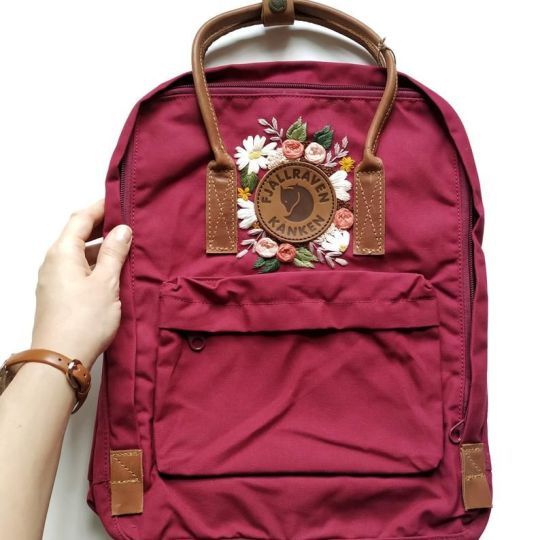
I was thinking about what I was going to use as my data set. Previously I was looking at international education and literacy data that I was going to put on a backpack or pencil case etc, with digital embroidery.
But I had a realisation that by using a backpack I could focus on a different issue, as backpacks are not always relevant to school. But I came up with the idea to use data of refugees other distance walked or look at the different countries. This topic strikes my interest more so and although it may be more difficult that finding statistics on education I want to give this idea a go.
My finalised workflow is...
Refugee distance data -> Processing -> PDF -> Digital Embroidery -> Onto backpack
Potential statistics that could be used...
https://www.unhcr.org/figures-at-a-glance.html#:~:text=At%20least%2079.5%20million%20people,under%20the%20age%20of%2018.
https://www.unhcr.org/globaltrends2019/
https://www.worldvision.org/refugees-news-stories/syrian-refugee-google-map-perspective

Examples of embroided backpacks (design ideas)...
0 notes
Text
Week 8 - Class Review
This week we looked at how to incorporate data into processing effectively and efficiently...
Below is notes that I took in class...

This week we started by looking at how to incorporate statistics into our code. There is 4 method that we learnt about each with varying degrees of difficulty hard coded, variable, array and expressions.
We filled out a survey with all of our birthdates (1st, 12th, 30th etc.). We then used this to create an output of different sized ellipses to change the output.
Hard coded (no screenshots whoops :( )
The hard coded I didn’t get a screenshot for, but what hard coded is is entering all of the data manually into the code so for using the size of ellipses this would result in a code looking like.
ellipse( width/2, height/2, 1, 1);
ellipse( width/2, height/2, 12, 12);
ellipse( width/2, height/2, 30, 30);
This creates the ellipses we want in the output, but this is a very time consuming method and inflexible. To change the size of the circle you have to edit each individual time the data was entered.
Variables
The way that we use variables to make this process better and more efficient is to state the results of the data as variables.

int myBirthday = 12; int oliBirthday = 1; int timBirthday = 29;
void setup (){ size(400,400); background(255); noFill();
ellipse(width/2, height/2, myBirthday * 10, myBirthday * 10); ellipse(width/2, height/2, oliBirthday * 10, oliBirthday * 10); ellipse(width/2, height/2, timBirthday * 10, timBirthday * 10); }
void draw () { }
How this is done is we use the int variable at the beginning of the code. The int stands for integer defining what kind of variable is going to be used. The next part of the code gives the variable a name that it will be referred to throughout the code. So by using myBirthday =12 whenever myBithday is written in the code it will mean 12.
By using it within the code this means that you only need to edit the top variable and is more efficient than using the hard coded method.
Array
An array is grouping multiple variables together and referring to them under a group.
This is a simple example of how to use the array function

The code below is essentially the same as the screenshot above just has two more variables stated...
int[] birthdays = {12, 29, 1, 27, 21};
void setup (){ size(400,400); background(255); noFill();
println(birthdays);
ellipse(width/2, height/2, birthdays[0] * 10, birthdays[0] * 10);
ellipse(width/2, height/2, birthdays[1] * 10, birthdays[1] * 10); ellipse(width/2, height/2, birthdays[2] * 10, birthdays[2] * 10);
ellipse(width/2, height/2, birthdays[3] * 10, birthdays[3] * 10);
ellipse(width/2, height/2, birthdays[4] * 10, birthdays[4] * 10); }
void draw(){ }
Compared to the variable function this has int[] the square brackets is the codes way of saying that this is creating an array of numbers, a group. The name that you type after this will be the term that the array is called throughout your code. The following numbers within the curly brackets is all of the variables you want separating them with a comma and having them within the {} curly brackets.
To find out how to insert this into the code it is very helpful to insert a println function. As you can see the println(birthdays); function at the bottom creates an index of all of the variables inputted.

Each of the numbers has a correlating number that refers to it starting from [0] and going up to the amount of variables you have.
This is what can be inserted into the code
ellipse(width/2, height/2, birthdays[0] * 10, birthdays[0] * 10); ellipse(width/2, height/2, birthdays[1] * 10, birthdays[1] * 10); ellipse(width/2, height/2, birthdays[2] * 10, birthdays[2] * 10);
Each of the square bracketed number refers to the number in the array as shown in the println. This is another way of making it more efficient to handle bits of data.
Expression
This is the most flexible way of handling data and the first way of using this is combining the for loops with the array. As you can see in the previous code the the numbers within the brackets increase by 1 every time. This means that to make this code even simpler we can replace that number with a for loop function that automatically increases to replace the 5 lines of code with 1.

int[] birthdays = {12, 29, 1, 27, 21}; void setup (){ size(400,400); background(255); noFill();
println(birthdays); for(int i = 0; i < 5; i++){ ellipse(width/2, height/2, birthdays[i] * 10, birthdays[i] * 10);
} }
void draw(){}
The for loop function for this array of data is for(int i = 0; i < 5; i++); this is because the for states it’s a for loop function. The int defines that the variables are integers. The i = 0 shows that the starting value of i should be 0 as the first value within the square brackets is 0. The i < 5 means that the code will only run when i is less than 5 because the last value in the array of numbers in the square brackets is 4. Lastly the i++ means that each loop the i value will increase by 1 each time.

stroke(random(255),255,128); strokeWeight(3);
Above is the same code as above just with a strokeWeight (3); meaning the the outline of the ellipse will be 3 pixels wide. And the stroke(random(255),255,128); gives it a random degree of red pigment with every time the loop runs creating the different colours shown
Linking code to data sheet
Another and more efficient way of using the for loop function within the code is linking it directly to the data sheet and by using the for loop function we can make the code read down the table one row at a time.
TO DO THIS YOU MUST HAVE THE TABLE OF DATA SAVED IN THE SAME FOLDER AS YOUR CODE!!!!!!!

Table allBirthdays;
void setup (){ allBirthdays = loadTable("birthdates-thurs.csv", "header"); println(allBirthdays.getRowCount());
size(400,400); background(255); noFill();
//println(birthdays); for(int i = 0; i < allBirthdays.getRowCount(); i++){ stroke(random(255),255,128); strokeWeight(3); fill(random(255),0,random(255),80); ellipse(width/2, height/2, allBirthdays.getInt(i,1) * 10, allBirthdays.getInt(i,1) * 10);
}
}
void draw(){}
The code above is what is used to link the code to the table and how to read data off the sheet to create an output.
In the first line of code they use Table allBirthdays; this tells the code that there will be a table linked to the code and it will be referred to as the allBirthdays variable. Which then gives the code the ability to link the file to the variable allBirthdays and it knows what type of file it is.
The next step is to state under the void setup() {
allBirthdays = loadTable("birthdates-thurs.csv", "header");
The allBirthdays links back to the first line so the code knows that it is referring to the table variable called allBirthdays. = loadTable is the function used to state that they are loading the data from the table and linking it to the variable. Which is then followed by in quotations within the bracket the exact name of the file that is saved in the same file as that code. This is very important it is spelt right and has the same file name down to the extension, and the “header” is stating that the table has headers and to ignore them when retrieving the data.
The println(allBirthdays.getRowCount()); allows for the code to count the amount of rows in the code and display them in the println. This can be very useful for very large amounts of data. It would show 25 in the println box as this is the number of rows.
This is then inserted into a forloop by creating:
for(int i = 0; i < allBirthdays.getRowCount(); i++)
This helps as well as the amount of data can be edited and now the code will automatically update! i < allBirthdays.getRowCount() uses the value previous so the code is only running the amount of times needed to.
This is then used in the ellipse function
ellipse(width/2, height/2, allBirthdays.getInt(i,1) * 10, allBirthdays.getInt(i,1) * 10);
This is because when writing allBirthdays.getInt(i,1) it means that the first variable is the row value so it’s i increasing by 1 every time and running the amount of times there is rows which makes the code read down the table. The 1 refers to the second coullum as the first collum is referred to as 0.
0 notes
Text
Week 7 - Assignment development
Below is the starting of my brainstorm to decide what path I am going to take...

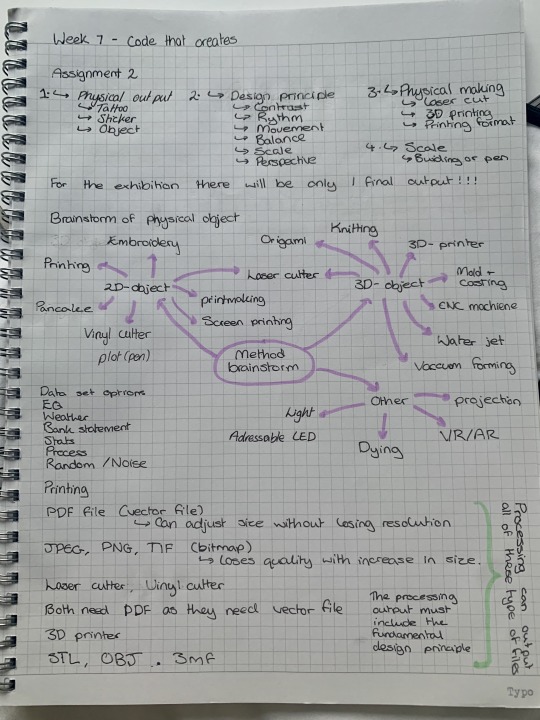
The physical outputs that stood out more to me were the digital embroidery, but I am also wanting to think about the Laser cutter and the vinyl cutter. I think I have decided on making an output that is 2D in the way that it will be a 2D design that will be put on clothes for example with the embroidery.
The design principles that I will use will be I think contrast and movement
After next weeks class I will make another post having a more clear idea of what I am going to do for my final assignment.
0 notes
Text
Week 7 Precedents
Using different search terms I have found images that present different ways of looking at what my outcomes could be for this assignment...
Data Visualisation...
Data visualisation is the graphic representation of data. It involves producing images that communicate relationships among the represented data to viewers of the images. This communication is achieved through the use of a systematic mapping between graphic marks and data values in the creation of the visualisation
When I first googled data visualisation it just came up with a lot of graphs etc. Although I did find that there was some interesting displays of the data shown below...

The work above is done by Mahdi Shakibi a data scientist and a machine learning engineer. This is one of his more creative works and I liked how he took the data collected and presented it in an interesting format unlike a normal graph.
http://www.shakibi.us/#about
By looking into processing data visualisation it came up with some more interesting outputs...
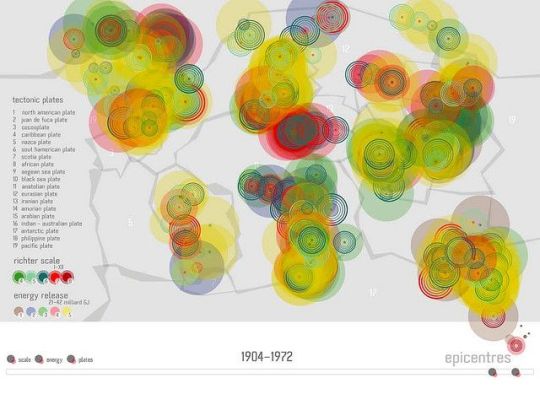
The output above I think is a visual representation of earthquakes around the world and where the tectonic plates are. After looking at this more closely though I am not convinced that it was made using processing and may be created using another software.
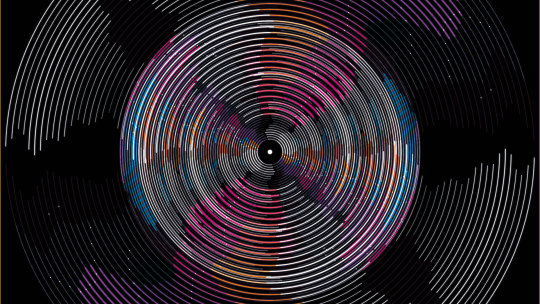
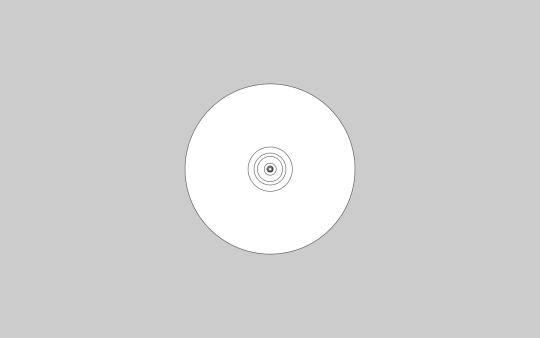
The outcome above was created using data from music, I could not find specifically whether it was a song or album or collection of music. But, I feel as though the outcome was very successful and the fact that it looks like a record is even better.
The uniqueness of the outcome above I believes is very well done. By using the restricted colour palette it creates a very clear image. I tried to find what the data was actually presenting, but there was no backstory it was just the image itself


https://www.openprocessing.org/labs/opviz
By going to this link it showed this data representation of users of the sight. What caused the difference between the different period of time. I found the interactiveness was really cool.
Obviously for our current project we are looking at outputs which are 2D or 3D which doesn’t come under what is shown above as it is displayed on a screen, but still cool.

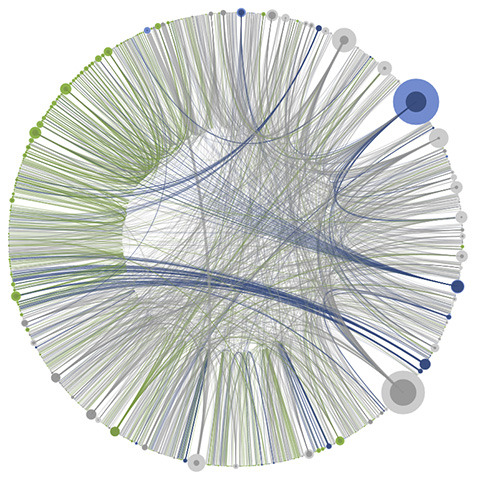
http://www.visualcomplexity.com/vc/project.cfm?id=662
Above is an output from using one year of transactional data from the Seattle public library.
Digital Fabrication...
Digital modeling and fabrication is a design and production process that combines 3D modeling or computing-aided design with additive and subtractive manufacturing.


https://www.ponoko.com/blog/maker-success-stories/data-visualization-digital-fabrication/
Parametric Design...
Parametric design is a process based on algorithmic thinking that enables the expression of parameters and rules that, together, define, encode and clarify the relationship between design intent and design response.
This is often used in architecture and nearly all outcomes that I have seen have been 3D.
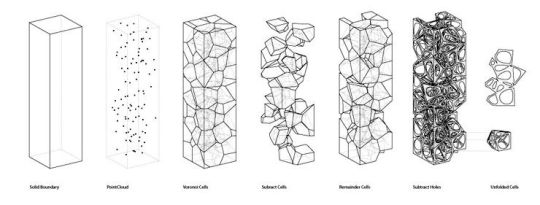
With the design about they took a points of data then used likes to connect them all and by choosing what to keep and what to subtract from the design and as a result created the result shown in the second image.

I could not find any reasoning behind any of these designs. All that was said was it was a part of some sort of algorithm that was used in the making of the designs...
0 notes
Text
Week 7 Class Review - For loops
Introduction to for loops
To create a pattern using shapes in processing you can individually place each shape in the position. But this method is time consuming and not very effective.
Below is a code that displays how you would create this series of ellipse without a for loop. It just involves changing the x pixel coordinate to increase by 10 for every ellipse. (The y pixel coordinate shows that height/2 this means whatever size the output screen is the y placement will always be half of the height. The 10,10 variables means the height and width of the ellipse will be 10 pixels)
void setup() { size(200,200); ellipse(0,height/2,10,10); ellipse(10,height/2,10,10); ellipse(20,height/2,10,10); ellipse(30,height/2,10,10); ellipse(40,height/2,10,10); }
void draw() { }
Below is a image of the output to extend this the length of the screen you would need to include many more ellipse functions. This is where for loops come into play...

The for loop function begins with stating the function which is a for(within this bracket of the code a variable is created) {and whats within these brackets will be apart of the loop and what shall be shown through the output}
Below is a brief overview of how the code is broken down...
For this code below in more detail on how this is structured look below...
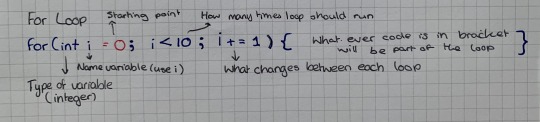
for(int i = 0; i < 10; i += 1)
Breaking this down within the bracket the int states the type of variable that they will be using and int stands for integer. (It is the most commonly used and is very unlikely that it will ever be another type of variable, at least in this course)
The i is basically stating what this variable will be referred to as it can be j or k or m, but it is easier for my learning to keep it as an i.
The = 0 is stating the starting point of i
then the i < 10 is justifying that for the loop to continue it needs to be less then 10 if i exceeds the value of 10 the loop stops (so it will run a total of 9 times). The < can be changed to > etc. By incresing the value of 10 to 80 the code would loop 79 times (if increasing by 1).
The i += 1 is what will change between each loop. This value can be changed to 2 meaning that in this code the value of i will increase by 0, 2, 4, 6, 8 and then will stop as the upper limit of the loop being <10 will have been reached.
Below is this code in action with combining it with the original ellipse function to make this pattern...

How the for loop function slotted into this code was putting into the x pixel position (first variable) in the ellipse function.
ellipse( i*10, height/2, 10, 10);
This means that the loop will run with i starting value of 0 so in the code 0 multiplied by 10 is still 0 so the x placement of the first ellipse. The loop runs again increasing by 1 so the value is 1 multiplied by 10 which is 10 so the centre point of the next circles is 10 pixels along. It the loop then begins again increases by 1 again so the value of i is now 2. In the ellipse function that is multiplied by 10 again so the position of the x is 20 presenting the next ellipse in the line. This continues again and again the next being 3 which increases to 30 then 4 to 40 etc. This process continues till i reaches the value set in the second variable this time being 10 so the loop runs which is why it stops. (All other variables are a constant in this example)
Below is all examples of how the for loop can be edited to obtain different outputs...

Above the ellipse function was changed to
ellipse( i, height/2, 10, 10);
This means the x pixel position is the i value and since i starts at 0 and increases by 1, 10 times it shows them stacked on-top of one another, shifting 1 pixel to the right with every loop.

The above experiment was me messing around with the values when we were asked to extend the ellipses across the 200x200 screen.
I took a different root by changing it so within the ellipse function the i is multiplied by 20 (i*20) meaning that it could extend the whole way across the screen by increasing the gaps between each of the ellipse (because the x value is increasing by 20, 40, 60...)
If I had just changed this feature though there would have been 1 ellipse for when i was the value of 0 and that would have been half on the screen on the left hand side. So within the for() function I changed the starting value of i to 1 to remove this to balance the work.
Technically, I could have increase the times the loop could run to 11 (from i < 10 to i<11) and it would have added an ellipse on the right hand side to balance the image any would have worked.

Above is what I got when I then tried to just increase the original pattern across the screen.
All it involved was increasing the i < 10 to i < 21. What this did was it extended the limit on the how many times the loop could run. The reason that it is increased to 21 and not to 20 is because the function is <20 which means that the value of i=20 is beyond the limits of the loop and the last ellipse would not be displayed. So, by increasing it to 21 it allows for this loop to be displayed.

The trail shown above is just seeing how i affects when inserted into the fill() function and because I changes with each loop it therefore means that for each ellipse the colour is going to be different.
fill(255, 128, i *10);
Because this code is set in the RGB colour scale format it means that its got the maximum pigment of red possible with the 255 value and about half the available green pigment at 128 and the blue pigment will increase by 10 every time the loop begins causing the change in shades.
Below is the code for the last expiriment done...
void setup() { size(200,200); //ellipse(0,height/2,10,10); for(int i = 0; i < 21; i += 1){ println("The loop runs" + i + "times"); fill(255,128,i*10); ellipse(i*10,height/2,10,10);
} }
void draw() { }
Below is my attempt at an activity given out


Between the output above I had figured out the base of the design and as Tim was walking around he advised that changed the stroke weight and opacity, so it showed a better match to the original image given.

I then realised that although the picture and my image looked very similar the spacing was not quite accurate. I then realised this is because there are 20 ellipses in the orginal and I though by setting the for() function to i = 0 for the starting point to i < 20 for the amount of loops that was still 20 loops. What I didn’t realise was that because the starting value is 0 and because i is used in the height and width of the ellipse the 1st ellipses is 0 pixels high and 0 pixels wide. This means that there is actually only 19 ellipse within this.
To rectify this I changed the starting value of i to be 1 and the limits to i<21 so there is still 20 loops but now all of the ellipses will be visible.

The only new features within this code is that the i variable was inserted into the width and height feature of the ellipse function. So, with every loop the ellipse is getting larger and larger because i is increasing by 1 between each of the loops.
Code for the above output
void setup() { size(400,400); background(0,0,0); //ellipse(0,height/2,10,10); for(int i = 1; i < 21; i += 1){ println("The loop runs" + i + "times"); fill(0,0,0,0); strokeWeight(3); stroke(255,255,255,90); ellipse(i*20,height/2,i*20,i*20);
} }
void draw() { }
I have tried to attempt the output below and been unsuccessful so far :(


I have spent a while trying to figure this out still have not so that is a question I am going to take with me to class. I will update the blog when I figure it out....
0 notes
Text
ASSIGNMENT 2 STARTS HERE...
I tried to make it clear which posts are assignment 2 by adding keep reading tabs to the last posts of assignment 1 :)
0 notes
Video
tumblr
Processing Final - “Black, white and hello!”
In the video above it shows my processing in action. This code is a user based code and how successful the outcome is will be dependent on how the user draws with the mouse. For example below is two outcomes with different movements of the mouse and I personally believe the first outcome to be more successful than the second because of the exposure of the background allowing for that contrast.


This design is unique in the way that a lot of how the result turns out is dependent on the speed on which the mouse is moved and the fact that the ellipse loses its fill once the mouse is pressed.
Main points of the code explained:
if(mousePressed){ fill(0,0,0,0); } else{ fill(237, 211, 17); }
These lines of code mean what they say if the mouse is pressed then the inner of the ellipses will turn to (0,0,0,0) which is transparent. That is because the last variable states the opacity of the fill and by making it 0 I have made it transparent, without that the fill would turn black.
The else statement just means that if the mouse is not pressed then the fill will be (237,211,17) which is the yellow seen in the work.
void draw() { variableEllipse(mouseX, mouseY, pmouseX, pmouseY); }
void variableEllipse(int x, int y, int px, int py) { float speed = abs(x-px) + abs(y-py);
Above is the defining of what the speed variable is this does this by taking the current mouse X and Y position, subtracting the previous position of the X and Y position and performing calculations to create the speed variable that was used in the rest of my code.
stroke(speed); strokeWeight(speed%50);
ellipse(x, y, speed, speed);
The code above is how I got the size of the ellipse to change with the speed of the mouse as it takes the mouse X and Y positions as the centre point of so the circle is drawn where the mouse currently is, but the width and height are the speed. Which is what causes it to change size with the mouse movement.
The stroke being defined as speed makes it so that with a slower speed (lower number) the darker the outline is going to be and the faster (larger number) means the lighter it will be. Furthermore, the stroke weight (thickness of outline) is dependent on the speed and the faster the mouse is moved the thinner the outline will be and the slower the thicker the outline will be.
To see the full code press keep reading
The full code for “Black, white and hello!”:
void setup() { fullScreen(); background(60); }
void draw() { variableEllipse(mouseX, mouseY, pmouseX, pmouseY); }
void variableEllipse(int x, int y, int px, int py) { float speed = abs(x-px) + abs(y-py); stroke(speed); strokeWeight(speed%50); if(mousePressed){ fill(0,0,0,0); } else{ fill(237, 211, 17); } ellipse(x, y, speed, speed); }
0 notes
Video
tumblr
Three.js Final - “Woven Sphere”
The video shown above is my final created in Three.js
The full code and link to the Three.js website is below, just click keep reading.
This outcome I find to be very successful because unlike my earlier designs it is within the constraints of only a section of the screen and the lowered opacity makes a very satisfying image to watch. All of the feedback was positive in the exhibition and most people found it very satisfying to watch.
Main points of the code explained:
geometry = new THREE.TorusKnotGeometry(174, 1.25, 51, 100, 6.77, 1.61, 4.34);
How this is created is that it is originally a knot shape and by changing the constraints especially first variable of 174 means that the knot has a large radius and along with the second variable being 1.25 which is very low represents the tubes thickness creating this wire shape.
renderer = new THREE.WebGLRenderer( { preserveDrawingBuffer: true } ); renderer.autoClearColor = false;
This render function is what allows the design to leave a trail of where it has been before with its movements and the colours it has.
material = new THREE.MeshBasicMaterial({shading: THREE.FlatShading, color: 0x000000, side: THREE.DoubleSide, transparent: true, opacity: 0.1});
The last variable in this line of code is the opacity being at a value of 0.1 allows for us to see the layering of the shapes trail happening.
camera.position.z = 1000;
By setting the camera position to 1000 this is what allows us to see the whole circle that is slowly created. Effectively allowed the camera to move outward 1000 along the z axis. (Smaller the number closer to the shape)
mesh.rotation.x = Date.now() * 0.0005; mesh.rotation.y = Date.now() * 0.0002; mesh.rotation.z = Date.now() * 0.0006;
These mesh rotation function are what make the knot spin in the pattern it does. The number variable at the end of each of the statement defines the speed at which the shape will spin on that axis. So, it is spinning the fastest on the z axis and the slowest on the y axis
<!DOCTYPE html> <html> <head> <meta charset="utf-8"> <style> body { background-color: #ffffff; margin: 0; overflow: hidden; } </style> </head> <body> <script src="http://threejsplaygnd.brangerbriz.net/js/three.min.js"></script> <script src="http://threejsplaygnd.brangerbriz.net/js/Detector.js"></script> <script>
if ( ! Detector.webgl ) Detector.addGetWebGLMessage(); var camera, scene, renderer; var geometry, material, mesh;
function setup() {
var W = window.innerWidth, H = window.innerHeight; renderer = new THREE.WebGLRenderer( { preserveDrawingBuffer: true } ); renderer.autoClearColor = false; renderer.autoClearColor = false; renderer.setSize( W, H ); document.body.appendChild( renderer.domElement );
camera = new THREE.PerspectiveCamera( 50, W/H, 0.5, 10000 ); camera.position.z = 1000;
scene = new THREE.Scene(); // paste your code from the geometryGUI here
geometry = new THREE.TorusKnotGeometry(174, 1.25, 51, 100, 6.77, 1.61, 4.34); material = new THREE.MeshBasicMaterial({shading: THREE.FlatShading, color: 0x000000, side: THREE.DoubleSide, transparent: true, opacity: 0.1}); mesh = new THREE.Mesh(geometry, material); scene.add(mesh); }
function draw() {
requestAnimationFrame( draw ); // experiment with code from the snippets menu here var time = Date.now() * 0.0005; h = ( 360 * ( 1.0 + time ) % 360 ) / 360; mesh.material.color.setHSL(h, 0.4, 0.5 ); mesh.rotation.x = Date.now() * 0.0005; mesh.rotation.y = Date.now() * 0.0002; mesh.rotation.z = Date.now() * 0.0006;
renderer.render( scene, camera );
}
setup(); draw();
</script> </body> </html>
If you wish to view this in the Three.js playground click the link below
http://threejsplaygnd.brangerbriz.com/editor/?id=id8185#B/nVVtb9s4DP6c/gq2wwHOnSen69shTQvckq4ZtuGGpYfgPioWbauzJU+Sm6ZF//so2W6brfsyA6ld8tFDUg8pTXZn/06v/v98AYWryvOdSfsaTArkgt6DSYWOQ1pwY9Gd7TUue/33XnBYtynRfw1WWmzg3n8NVjz9mhvdKPE61aU2Y3iVhec0uCtucqnGMGr/1TdoslKvx1BIIVAF64MnT3r2SdJlMvFRfLgQOzWydmBNerZXOFePk8QVBvHa1iXf5EqwleEqR7My8o4pdMm1bRGskopd271zChFIzn+bb4YOU6fNr+jOd3w5MoMIduERvMZVXsLwycCFuES3xNXlx09oLc8xGoaN8L8bbiDlFRoeg01RYQwGlUCD5rT356hJJLOJoeIOjeQlfaEtTkP8rFGpk1oB6dfU0ZCECnvvVy7hDNZSCb1mUik0SylcEcP8B/McZV64VrI+OkEUruFq/uXigoXkv3SeCO6hNmjR3ODMcCLK3zZZhtQLzjQIDzDcpmK8cXpaIjdT3zLEnPHS4u+AqMaFvMMIlr6KLo7QaVOhcsx3EON1TehpIUsRPe4lE7q6KNGj/KqwrN32rTo/o7E1qSZvcBq8ERyNYlgm8xhG7CiG/RE9fdyWgNXaSi8AuyMuD+j4g5xb9Atv6cQfPP1JEqi5dQgb3VA3aIGQGV2BK/BR+8v/3kNBlbTUvXWL/Uqbxn5Q2l123mj/5JBSZm8o8aP9kHwMx+zkxBuPyXDIDg4pm76rttioVYu33Mr0U+eN7m3BBYk97hDvSu4WrSmG7jAY3Y7CQ80sBfbImW5WJS7IElOLcGVrTsK4tl9i0DVPpdvQarb/4POh0D/lEv08BQQNe+wnLPKLnu3sw/ZsCOrTp9Ew+K1B6/5RkqjI/c6QklEAwXN1SBi8rSlW6Ju1dMUP6lglqducpXFUTatPP3qOFlERM8qVKe2D/0n10dYctQF8hREcHI/IHpEeI/irXTOEP4J5CIl/d+cqVcf6ulnYbD8L88XHqPCteRj6s08+oI12oTh2+4s0Bi9gNy9i37yIvXsRe3y6sz2y7UfUn27d1HVD2MrUnVwh+Vap4H1+5PqLor0g6MLwV9h3
0 notes