
Don't wanna be here? Send us removal request.
Statistics
We looked inside some of the posts by galactissolutions and here's what we found interesting.
Average Info
Notes Per Post
0
Likes Per Post
0
Reblog Per Post
0
Reply Per Post
0
Time Between Posts
2 minutes
Number of Posts By Type
Text
17
Last Seen Tumblr Blogs


Fun Fact
The most popular pages on Tumblr are about Minecraft, GIFs, and David J. Peterson.
Text
Describe the benefits of reliability and predictability in the cloud
Reliability and predictability are two crucial cloud benefits that help you develop solutions with confidence. Reliability Reliability is the ability of a system to recover from failures and continue to function. It’s also one of the pillars of the Microsoft Azure Well-Architected Framework. The cloud, by virtue of its decentralized design, naturally supports a reliable and resilient…
0 notes
Text
Describe Azure Resource Manager and Azure ARM templates
Azure Resource Manager (ARM) is the deployment and management service for Azure. It provides a management layer that enables you to create, update, and delete resources in your Azure account. Anytime you do anything with your Azure resources, ARM is involved. When a user sends a request from any of the Azure tools, APIs, or SDKs, ARM receives the request. ARM authenticates and authorizes the…
0 notes
Text
Describe the purpose of Azure Arc
Managing hybrid and multi-cloud environments can rapidly get complicated. Azure provides a host of tools to provision, configure, and monitor Azure resources. What about the on-premises resources in a hybrid configuration or the cloud resources in a multi-cloud configuration? In utilizing Azure Resource Manager (ARM), Arc lets you extend your Azure compliance and monitoring to your hybrid and…
0 notes
Text
Describe tools for interacting with Azure
To get the most out of Azure, you need a way to interact with the Azure environment, the management groups, subscriptions, resource groups, resources, and so on. Azure provides multiple tools for managing your environment, including the: Azure portal Azure PowerShell Azure Command Line Interface (CLI) What is the Azure portal? The Azure portal is a web-based, unified console that provides an…

View On WordPress
0 notes
Text
Introduction to Microsoft Azure Fundamentals
Microsoft Azure is a cloud computing platform with an ever-expanding set of services to help you build solutions to meet your business goals. Azure services support everything from simple to complex. Azure has simple web services for hosting your business presence in the cloud. Azure also supports running fully virtualized computers managing your custom software solutions. Azure provides a wealth…
0 notes
Text
Work with key performance indicators
Key performance indicators (KPIs) are excellent in helping you track progress toward a specific goal over time. To use a KPI, you need three pieces of information: A unit of measurement that you want to track, for instance total sales, number of employee hires, number of loans serviced, or number of students enrolled. A goal for the measurement so that you can compare your progress with that…

View On WordPress
0 notes
Text
Format and configure visualizations
Power BI Desktop gives you a variety of options for customizing how your selected visualizations look, such as the colors and format of the text that they contain. You should take time to explore the options to determine what impact they each have on a visual. In this example, you will format and configure the default clustered column chart visualization to better meet the needs of your report…

View On WordPress
0 notes
Text
Select report visuals to suit the report layout
Often, you can choose between multiple visual types to meet design requirements. To narrow down the selection, you can choose the visual that best fits the available space on the report page. Use a visual that is aesthetically pleasing while maximizing the use of the available page space. The following examples show two visuals side by side: a 100% Stacked Bar chart visual and a 100% Stacked…

View On WordPress
0 notes
Text
Select report visuals
The primary goal of data visualization is to communicate information clearly and effectively to report consumers. That’s why selecting the most effective visual type to meet requirements is critical. Selecting the wrong visual type could make it difficult for report consumers to understand the data, or worse, it could result in the misrepresentation of the data. Visual selection can be…

View On WordPress
0 notes
Text
Report objects
Report objects are laid out on each report page and include: Visuals – Visualizations of semantic model data. Elements – Provide visual interest but don’t use semantic model data. All report objects have some properties in common, which can be set in various sections of the Format options. Commonly applied settings include general properties (location, size, and alt text), title, background,…

View On WordPress
0 notes
Text
Design visually appealing reports
Having the correct data and selecting the correct visuals is important. Equally as important is ensuring that the report is visually appealing. A well-designed report should guide the report consumer to quickly find and understand the answers to their questions. While striving to produce an appealing report, bear in mind that the report should be user-friendly. Moreover, it might be possible to…

View On WordPress
0 notes
Text
Design the analytical report layout
When report consumers look at a report, an automatic and unconscious process occurs when they comprehend what they see. Therefore, you should adhere to basic report design principles to support this process to help effectively communicate meaning from data. An analytical report can consist of one or more pages, and pages comprise report objects. Report objects can be data visuals, which…

View On WordPress
0 notes
Text
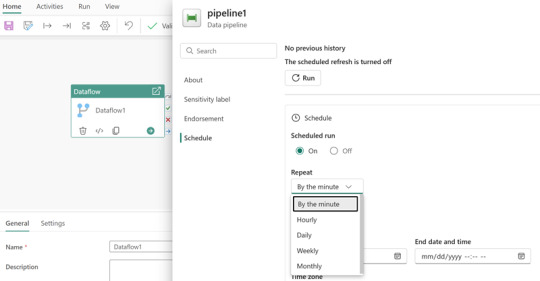
Integrate Dataflows Gen2 and Pipelines in Microsoft Fabric
Dataflows Gen2 provide an excellent option for data transformations in Microsoft Fabric. The combination of dataflows and pipelines is useful when you need to perform additional operations on the transformed data. Data pipelines are a common concept in data engineering and offer a wide variety of activities to orchestrate. Some common activities include: Copy data Incorporate Dataflow Add…
View On WordPress
0 notes
Text
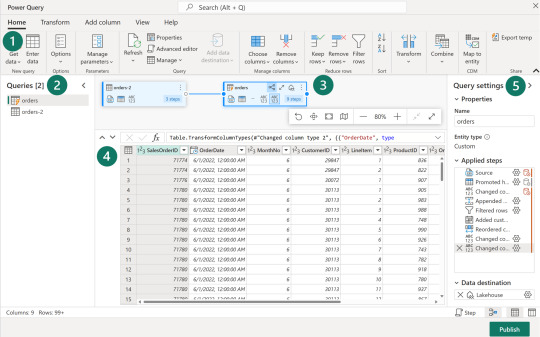
Explore Dataflows Gen2 in Microsoft Fabric
In Microsoft Fabric, you can create a Dataflow Gen2 in the Data Factory workload or Power BI workspace, or directly in the lakehouse. Since our scenario is focused on data ingestion, let’s look at the Data Factory workload experience. Dataflows Gen2 use Power Query Online to visualize transformations. See an overview of the interface: 1. Power Query ribbon Dataflows Gen2 support a wide variety…
View On WordPress
0 notes
Text
Understand Dataflows Gen2 in Microsoft Fabric
In our scenario, you need to develop a semantic model that can standardize the data and provide access to the business. By using Dataflows Gen2, you can connect to the various data sources, and then prep and transform the data. You can land the data directly into your lakehouse or use a data pipeline for other destinations. What is a dataflow? Dataflows are a type of cloud-based ETL (Extract,…
0 notes
Text
Secure and monitor your data warehouse
Security and monitoring are critical aspects of managing your data warehouse. Security Data warehouse security is important to protect your data from unauthorized access. Fabric provides a number of security features to help you secure your data warehouse. These include: Role-based access control (RBAC) to control access to the warehouse and its data. SSL encryption to secure the…
0 notes
Text
Prepare data for analysis and reporting
A semantic model defines the relationships between the different tables in the semantic model, the rules for how data is aggregated and summarized, and the calculations or measures that are used to derive insights from the data. These relationships and measures are included in the semantic model, which is then used to create reports in Power BI. You can easily switch between the Data, Query,…

View On WordPress
0 notes