
Statistics
We looked inside some of the posts by harshadevulapalli and here's what we found interesting.
Average Info
Notes Per Post
0
Likes Per Post
0
Reblog Per Post
0
Reply Per Post
0
Time Between Posts
11 days
Number of Posts By Type
Link
5
Photo
11
Video
1
Last Seen Tumblr Blogs


Fun Fact
The most popular pages on Tumblr are about Minecraft, GIFs, and David J. Peterson.
Link
What does data reveal about the state of Muslims in Hyderabad?
Edit : The link is down, will find a link to the paper.
Sajjad and Dr. Anant have been working on a report on the state of the minorities in Telangana to be submitted to the Commission of Inquiry for Muslims.
The link above is a paper/presentation that I co-author with them and Indivar - where maps I’ve made feature.
The maps which make a special appearance in this - are part of a larger awesomer housing atlas on Hyderabad - I have been working on - for the last couple of months. SOON, I shall put them out!
0 notes
Photo

GHMC Elections Results 2009.
If you were wondering, why the TRS sweep is such an game changer, refer to the map above. This was the city in 2009. There is no clear winner. There are loads of wards that have Congress (in Blue), TDP (in Yellow). MIM has the bastion intact and it was the kingmaker.
Now with the TRS sweep in 2016, MIM’s role looks a little threatened.
0 notes
Photo

GHMC Elections Results 2016.
TRS sweeps the city - a first in four decades that a party has sucha thumping majority! MIM’s bastion is mostly unperturbed. BJP wins in strongholds Ghansi Bazaar and Gowlipura. They win in RK Puram too. Congress wins only in Boudha Nagar and Patancheru. TDP wins only in KPHB Colony.
0 notes
Photo

Evolution of Vijayawada City.
Data from Personal Knowledge and Jan Baken.
0 notes
Photo

Top 20 Offences committed by Autorickshaw Drivers in Hyderabad District.
Hyderabad Urban Lab is currently working on producing our first very working paper as a collective - On Transit. Specifically paratransit. Using our understanding of the industry so far - the idea of the working paper is to recognise the paratransit alternatives as a viable and legit mode of transport.
As part of the paper - I’ve made a Treemap of the top 20 offences committed by Autorickshaw drivers in Hyderabad District limits. (Data Source : Hyderabad Traffic Police)
Size of the block = Fines Imposed on the Autorickshaw Drivers.
Colour of the block = Recovery Rate = Fines paid up by Autorickshaw Drivers/Fines imposed on the Drivers.
It is interesting because it tells you - what the police is looking out for while fining autorickshaw drivers. It also tells you what autorickshaw drivers are paying up for - an indicator of what they perceive to be an offence or not.
Autorickshaw drivers understand extra projection on top of an auto as an offence (Recovery rate is 97 percent.) So if they carry something on top, they are willing to pay up a fine.
However - Piloting with Driver, Signal Jumping and Parking on Service Roads have lower recovery rates. It could mean - autorickshaw drivers do not consider them as much of an offence. They see sharing autorickshaw drivers having often more than 1 person along with the driver. If that is legitimate (even though it is not legal) for sharing autorickshaw drivers, then they do not see why they should pay up (Sharing autos are completely illegal).
There is a dearth of parking for autorickshaws in Hyderabad. Only around 170, for a city with 1,20,000 autorickshaws. So wherever, the autorickshaw would park - most policemen would resort to clicking a picture and fine them even if the autorickshaw driver is just letting a customer get down. ( One cannot blame the police for this, their low salaries combined with an incentive structure that is based on the number of offences they have been able to track is responsible for it) A legit mechanism to fine errant autorickshaw drivers who are squatting on the road is to take two timed photographs after an interval of 2 minutes.
0 notes
Photo

That’s HUL’s first product, nope - not me, but what I’m holding - Naani Ki Kahaani.
Naani Ki Kahaani, a calendar conceptualized by Bhashwati Sengupta featuring artwork by Neha Vaddadi, is an output of a larger project called A Place for Her.
Rs. 600 for a table top calendar and Rs. 1000 for a wall calendar
To place your order please send us an e-mail at [email protected]. Orders from outside Hyderabad will be charged separately for postage and the charge will depend on the size of the order.
The artworks are fantastic interpretations of personal life-stories shared with us by elderly women as part of our project Meri Kahaani (https://www.youtube.com/watch?v=miJpVpJ1xKU).
The proceeds will go to support further research at Hyderabad Urban Lab.
0 notes
Link
Here’s a document I’ve made on the process we went through to conduct the audit. Do let me know if this has been of any use!
0 notes
Photo

Public Toilets in Hyderabad
We at Hyderabad Urban Lab published our map just to put these “mentalities” in context. Hyderabad, a city of more than 6 million people, has just 186 public toilets. Also, this map will be published in Kritische Karten’s atlas soon. Yay.
We acquired information on public toilets in Hyderabad from the Greater Hyderabad Municipal Corporation. The response consisted of two physical documents containing a list of 186 toilets along with the Circle and Ward in which they are located, a rough landmark to locate it and the organization which has built and is operating the toilet.
With these documents in hand, we started with a preliminary exercise of digitizing this data and attempting to spatialize it based on the landmarks given in the documents, which by itself revealed the sparseness of public toilets in a city of roughly eight million people. We followed this up with a sample audit in 2014, and a comprehensive audit in 2015 of all the listed toilets.
Researchers of Hyderabad Urban Lab visited each toilet and surveyed the facilities available and their quality. The survey reveals that there are no toilets specifically designed for persons with disabilities, there is a heavy disproportion between facilities for men and women, and the design of toilets would deter most women.
However, our key observation was that even among the few toilets in existence, there were certain locations, a handful of major road junctions, which had a cluster of toilets. Some of these junctions do, in fact, witness heavy pedestrian traffic, but on what basis was it decided that they require three, sometimes four, toilets? Some research revealed to us that nearly 130 new toilets were constructed in the late 2000s as part of something called the ‘Fund Your City Project’ that sought to incentivize public-private partnership in the construction of public amenities. In the case of toilets, private investors had the incentive of using the external wall of the toilet on a major road as advertising space, and in an attempt to cross-subsidize, they would have to build a toilet in an inner road.
1 In India, a legislation passed in 2005 known as the Right to Information Act allows citizens to demand for information from public authorities, if the authority has not already made the information public (which it is required to do as per the same Act). This particular RTI was filed by Syed Shah Ali Hussain and Krishna Yashwant.
The pattern on our map clearly reveals the perverse outcome of the incentive logic applied in the project. Only the toilets on major roads were built, and they were located on the basis of ‘visibility’ for ads, not the needs or demands of the public.
In India, the pedestrian, going from one place to the other, is not the biggest user of these public toilets. The chief users of these toilets are the large number of informal workers who spend most of their day out on the roads: drivers, cart-pushers, hawkers, sanitation workers, etc. They are spread out across the city, across its vast networks of lanes and by-lanes. The fact that toilets exist only on major thoroughfares, so that car-owners can see the ads, and that they just do not materialize on inner roads, where the need is great, and in spite of a grand cross-subsidization scheme, is a matter of grave spatial injustice.
Map Credits: Harsha Devulapalli (Research Associate, Hyderabad Urban Lab)
Text Credits: Indivar Jonnalagadda and Harsha Devulapalli (Research Associates, Hyderabad Urban Lab)
Road and Water Bodies Data Source: OpenStreetMap
0 notes
Photo

This campaign is an initiative of the Hyderabad Urban Lab .We want a city where women have adequate access to clean, safe and affordable public toilets. DON'T HOLD IT IN is a campaign to make your voice heard.We want a city where women do not have to hold their bladders. DON'T HOLD IT IN is a campaign to talk about women's sanitation woes. Do take the quiz!
0 notes
Photo

Transit and Poverty in Hyderabad
Here’s a map of all the possible transit options in the GHMC limits in the next couple of years along with the map of slums in Hyderabad. The thinner orange and black are the MMTS lines. The thicker blue, green and red lines are the upcoming metro lines. The thinner blue lines are all the bus routes in the city of Hyderabad (the lines are as clear as the datasets; the data still needs a lot more work, sigh)
Please do take time to notice - how the large slum clusters (Old City, Ziaguda, Borabanda and Jagadgirigutta) lie in transit deserts of sorts. This is where paratransit thrives.
0 notes
Link
SreeHarsha Thanneeru has been working along with groups that have been tracking down farmer suicides in the new state of Telangana. A lot of people on the ground have been visiting families from following up with the families of the deceased.
Here’s a geotagged map of all the farmer suicides in the state from June 2014 till October 2015. In about a minute, you see the entire state filled with deaths. This is a gutwrenching picture of the tragedy. (Regarding the data, there are a few points wrongly marked outside the state - the data still needs to be cleaned. If we can get more information on the size of the deceased’s farm holding, crop, rainfall patterns in the state etc to be able to identify trends that could be useful in thinking about the problem.)
0 notes
Link
Our maps on toilets, slum and transit feature at the Open Data Art Gallery by Mapbox! Folks in Bangalore - do check it out! Video Courtesy : Sajjad!
0 notes
Photo
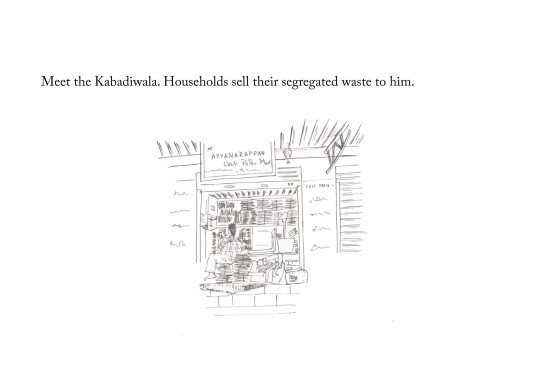
A teaser of a presentation for an upcoming teaching module on “Waste in Hyderabad” I’ll be doing with the students of the Davidson in India program.
Sketch Credits : Vivek Rakotu
0 notes
Link
Today is the anniversary of the Great Musi Flood of 1908. To commemorate the devastation suffered by the city and the many changes its infrastructure underwent in the aftermath of the flood, I and Vivek went scouting for the locations of the Highest Flood Level (HFL) markers
We found six such markers on different monuments along both banks of the Musi river. The facebook album is of the photographs of the six markers we found. Have you seen others? Let us know!
Edit : We found a seventh one at Chaderghat PS! :D
0 notes
Video
youtube
Hyderabad Urban Lab presents "Auto!", a stop-motion video that unpacks the working of the auto-rickshaw industry in Hyderabad. What is an auto? Who is the driver? Who is the commuter? What are the problems?
Based on research conducted by Ojas Shetty and Harsha Devulapalli. You can read our series of blogposts about it here: http://hydlab.in/blog/cat/projects/tr... Script, Animation and Direction: Vaibhav Raghunandan Translation and Narration: Mohammed Syed Camera and Editing: Ashish Kumar Research: Ojas Shetty and Harsha Devulapalli Music: Hyderabadi Marfa
0 notes
Photo

Waste Atlas of Hyderabad
Under the initiative, the goal was to identify the nodes of flows of waste through formal and informal mechanisms of waste disposal in the city of Hyderabad. I have been interviewing people at these various nodes of the formal waste management such as door to door collectors, sweepers and sanitation truck drivers about their living conditions and prevalent municipal practices as part of understanding the formal waste management sector. Material written on these is now feeding into the course curriculum on “Waste and Hyderabad”. I have also made a map of the formal nodes of waste management - all the dustbins, solid waste transfer stations, sewage treatment plants and dump yards.
Dustbin Location Source : GHMC’s OSRT System.
Solid Waste Transfer Stations, Sewage Treatment Plants and Dumpyards Source : Field Work
0 notes
Photo

The various ways in which autorickshaw meters are tampered.
As part of ongoing research on autorickshaws in Hyderabad, we were asked this “How can one tell whether a meter is tampered? How are meters tampered? What percentage of auto-rickshaws in Hyderabad would have tampered meters?”
We did a blogpost to uncover how your autorickshaw meter might be tampered : http://hydlab.in/blog/portfolio/auto-rickshaws/this-is-how-your-meter-might-be-tampered-but-dont-panic/
PS : This question covers the - how are meters tampered bit. Our report on - why are meters tampered - will be coming out shortly.
PPS : Image Courtesy : Manas Karambelkar’s Blog.
0 notes