
Don't wanna be here? Send us removal request.
Statistics
We looked inside some of the posts by makingcode and here's what we found interesting.
Average Info
Notes Per Post
1
Likes Per Post
1
Reblog Per Post
0
Reply Per Post
0
Time Between Posts
5 days
Number of Posts By Type
Text
3
Last Seen Tumblr Blogs


Fun Fact
Tumblr’s reach among the 26-to-35-year-olds in the US is 11%.
Text
National Epidemiologic Survey of Drug Use and Health: Week Three
Week three code
Week three results
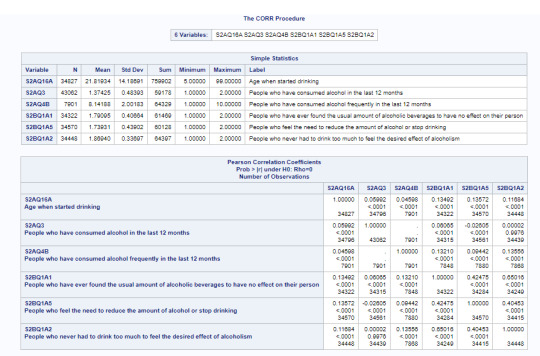
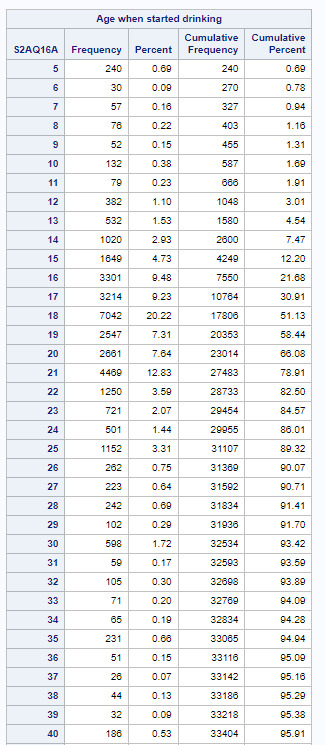
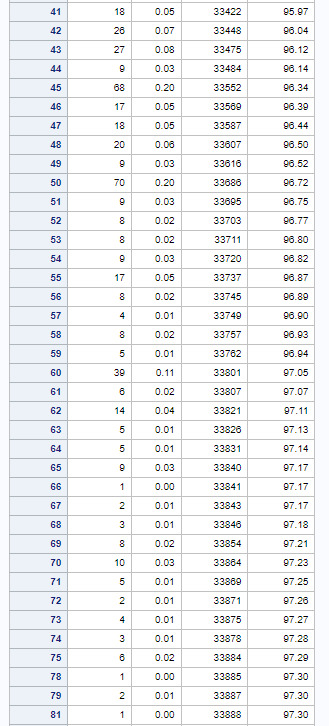
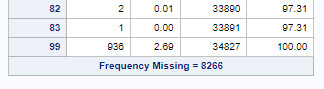
As can be seen, according to the CORR model for the variable S2AQ16A in correlation with the variable <S2AQ3>, the following results are obtained 0.05992 <.0001 alcohol consumers decrease alcohol consumption according to age in years, in other words, the older the person the greater the rate of reducing the consumption of alcoholic beverages.
For the second case, in which people who have ever discovered the relationship of habitual drinks that they can drink without having any effect in correlation to age <S2AQ16A> are mentioned, they have to 0.13492 <.0001 which means that the older a person is in years, he tends to know the amount of alcoholic beverages he can drink.
Analyzing the third case <S2BQ1A2> in correlation with <S2AQ3> which mentions the treatment of people who did not have to drink more alcohol to feel the desired effect in the last twelve months, the trend marks an increase from 0.00002 to 0.9976 This means that the number of people who need to drink more alcohol to feel the desired effect is greater than those who do not need this. With this we can confirm that age is a factor that marks the amount of alcohol consumption that people want to ingest.
0 notes
Text
National Epidemiologic Survey of Drug Use and Health: Week Two
Step 1
Running the program
LIBNAME mydata "/courses/d1406ae5ba27fe300" access=readonly;
/*Dataset name*/
DATA new; SET mydata.nesarc_pds;
Step 2
Run frequency distributions for your chosen variables and select columns, and possibly rows
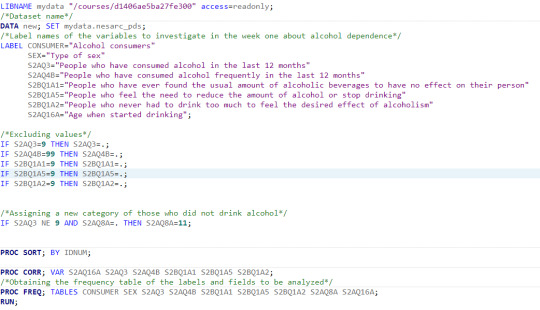
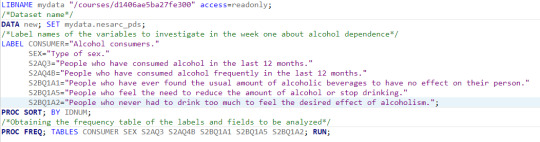
/*Label names of the variables to investigate in the week one about alcohol dependence*/
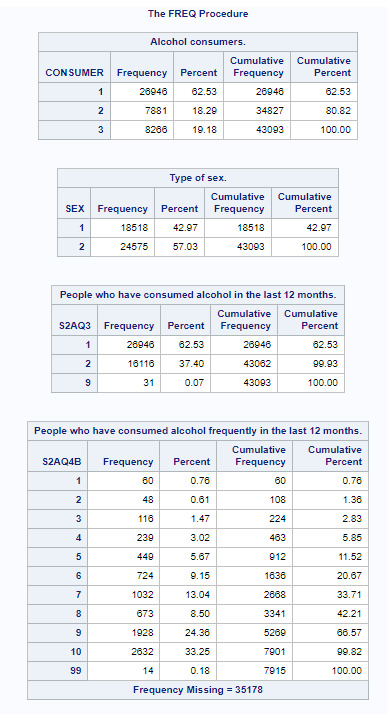
LABEL CONSUMER="Alcohol consumers."
SEX="Type of sex."
S2AQ3="People who have consumed alcohol in the last 12 months."
S2AQ4B="People who have consumed alcohol frequently in the last 12 months."
S2BQ1A1="People who have ever found the usual amount of alcoholic beverages to have no effect on their person."
S2BQ1A5="People who feel the need to reduce the amount of alcohol or stop drinking."
S2BQ1A2="People who never had to drink too much to feel the desired effect of alcoholism.";
PROC SORT; BY IDNUM;
/*Obtaining the frequency table of the labels and fields to be analyzed*/
PROC FREQ; TABLES CONSUMER SEX S2AQ3 S2AQ4B S2BQ1A1 S2BQ1A5 S2BQ1A2; RUN;
Screenshot code
Step 3
Describing the columns selected from dataset <nesarc_pds>:
CONSUMER: Alcohol consumers.
SEX: Type of sex.
S2AQ3: People who have consumed alcohol in the last 12 months.
S2AQ4B: People who have consumed alcohol frequently in the last 12 months.
S2BQ1A1: People who have ever found the usual amount of alcoholic beverages to have no effect on their person.
S2BQ1A5: People who feel the need to reduce the amount of alcohol or stop drinking.
S2BQ1A2: People who never had to drink too much to feel the desired effect of alcoholism.
Describing the values of the columns selected from dataset <nesarc_pds>:
CONSUMER --------------- 1. Current drinker 2. Ex-drinker 3. Lifetime Abstainer
SEX --------------- 1. Male 2. Female
S2AQ3 --------------- 1. Yes 2. No 9. Unknown
S2AQ4B --------------- 1. Every day 2. Nearly every day 3. 3 to 4 times a week 4. 2 times a week 5. Once a week 6. 2 to 3 times a month 7. Once a month 8. 7 to 11 times in the last year 9. 3 to 6 times in the last year 10. 1 to 2 times in the last year 99. Unknown BL. NA, did not drink or unknown if drank coolers in last 12 months
S2BQ1A1 --------------- 1. Yes 2. No 9. Unknown BL. NA, lifetime abstainer
S2BQ1A5 --------------- 1. Yes 2. No 9. Unknown BL. NA, lifetime abstainer
S2BQ1A2 --------------- 1. Yes 2. No 9. Unknown BL. NA, lifetime abstainer
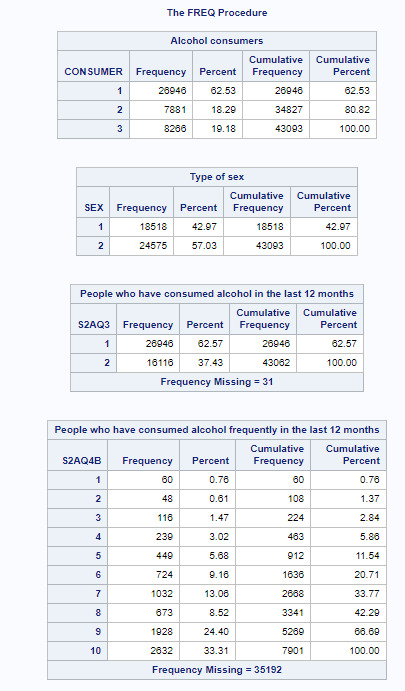
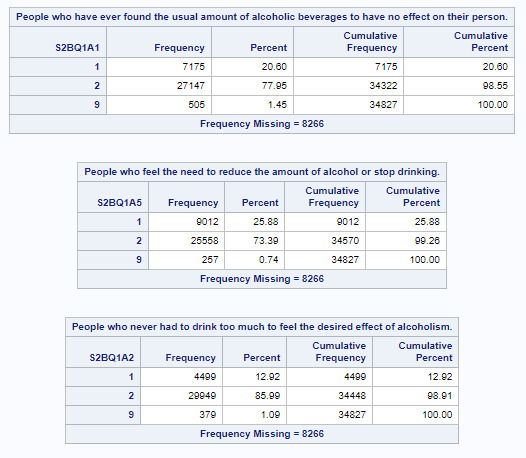
Describing the frequency tables
These tables show information about the frequency, the percentage, the cumulative frequency, and the cumulative percentage, about the following points
Type of sex
People who have consumed alcohol in the last 12 months.
People who have consumed alcohol frequently in the last 12 months.
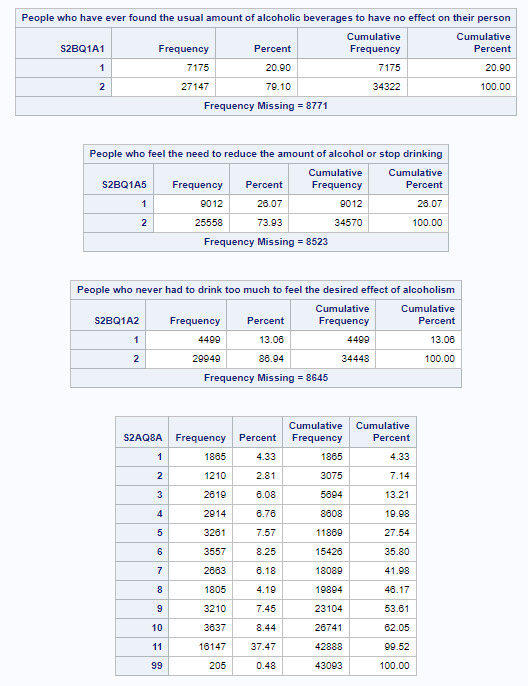
People who have ever found the usual amount of alcoholic beverages to have no effect on their person.
People who feel the need to reduce the amount of alcohol or stop drinking.
People who never had to drink too much to feel the desired effect of alcoholism.
0 notes
Text
National Epidemiologic Survey of Drug Use and Health: Week One
Dataset name
National Epidemiologic Survey of Drug Use and Health
Research Question
Is alcohol dependence associated with the emotional state of the individual?
Hypothesis
The social, emotional and personality situation of the individual can influence alcohol consumption.
Keywords
Personality, Family history, Disorders, Medical conditions, Panic disorders, Major depression, Alcohol dependence, Antisocial personality.
Alcoholism and Psychiatric Disorders Resume
The dependence of the individual towards alcohol is mostly associated when the individual's emotional processes are integrated into cognitive activity. According to a study from the University of Oxford, alcohol consumption can bring about a reduction in stress, social fit, as well as social inhibitions.
Likewise, ventured into psychiatric terms according to an NIH publication, it is said that patients who abuse alcohol or have frequent dependence on it are exposed to having several different psychiatric syndromes as a result.
Taking as a starting point the family history, as well as mental disorder, behavior disorder, depression, manic-depressive psychosis, personality disorders, anxiety.
According to (Anthenelli 1997; Modesto-Lowe and Kranzler 1999). When alcoholism and mental disorders coexist, it is more likely that the individual will have difficulties in maintaining abstinence himself.
Extra relevant cultural information on the symptoms that may occur according to the existing blood alcohol levels.
Legal blood alcohol limit that an individual can have ranges from 0.08 to 0.10.
Probable symptoms depending on the amount of alcohol in the blood:
0.05: decrease in inhibitions.
0.10: difficulties in pronunciation.
0.20: euphoria and motor impairment.
0.30: confusion.
0.40: stupor.
0.50: comma.
0.60: respiratory arrest and death.
References
Ramesh Shivani, M.D., R. Jeffrey Goldsmith, M.D., and Robert M. Anthenelli, M.D.. (2002). Alcoholism and Psychiatric Disorders. 2021, de NIH
medlineplus. Consumo y nivel seguro del alcohol. 2021, de NIH
Yanina Michelini, Ignacio Acuña, Juan Carlos Godoy. (2016). Emotions, decision making and alcohol consumption in university students. 2021, de Science Direct
R. I. M. Dunbar, Jacques Launay, Rafael Wlodarski, Cole Robertson, Eiluned Pearce, James Carney & Pádraig MacCarron . (2016). Functional Benefits of (Modest) Alcohol Consumption. 2021, de Springer Link
1 note
·
View note