
Don't wanna be here? Send us removal request.
Statistics
We looked inside some of the posts by sranalytics50 and here's what we found interesting.
Average Info
Notes Per Post
0
Likes Per Post
0
Reblog Per Post
0
Reply Per Post
0
Time Between Posts
6 days
Number of Posts By Type
Text
17
Last Seen Tumblr Blogs


Fun Fact
25% of US internet users with an annual income of $80-100K use Tumblr.
Text
What Are the Top CPG Retail Analytics Trends for 2025?

Data agility — not just marketing budgets — will determine which CPG brands win in 2025. McKinsey's analysis shows that CPG companies implementing comprehensive digital and AI transformations can achieve a five- to 15-percentage-point impact on EBITDA margins, while AI is expected to generate $500 billion in value for the global CPG industry by 2025.
The retail and CPG industry stands at a critical inflection point. After years of supply chain disruptions, shifting consumer behaviors, and economic uncertainty, leading brands are discovering that traditional approaches no longer deliver competitive advantages. From my experience working with Fortune 500 CPG brands over the past several years, I've witnessed a fundamental shift: companies that excel at cpg retail analytics trends are capturing market share while competitors struggle with outdated reporting methods.
NVIDIA's State of AI in Retail and CPG 2025 survey reveals that hundreds of industry professionals are rapidly adopting AI across supply chain, digital retail, and customer experience optimization.
Why CPG retail analytics trends matter more than ever in 2025
The new competitive landscape
The retail and CPG industry has fundamentally changed. McKinsey research reveals that CPG brands have moved from a position of strength to one of underperformance, with consumers reporting they feel like they’re spending more but buying less. This shift means brands have fewer opportunities to make an impression — and they must get it right the first time.
Here’s what’s driving the urgency around CPG analytics solutions:
Consumer behavior complexity: 60% of households now shop both online and in-store, requiring omnichannel analytics integration
Sustainability demands: Environmental consciousness drives 62% of purchasing decisions, demanding new tracking capabilities
Margin pressure: Inflation effects combined with supply chain costs force precision in every business decision
Speed requirements: Product development cycles shortened by 60% through AI-powered insights
The 5 game-changing CPG retail analytics trends for 2025
1. AI-driven predictive analytics become business-critical
What transformed in 2025: AI-powered demand forecasting evolved from “nice to have” to “mission critical” for CPG success.
McKinsey’s latest analysis shows that one beverage company used generative AI to create product concepts that informed development, reducing time to market by 60 percent. Leading brands like Nestlé and P&G now use machine learning for demand sensing that predicts consumer preferences before customers know them themselves.
Key applications driving results:
Dynamic demand forecasting: Machine learning models analyze 50+ variables including weather, social trends, and competitor activity
Personalized marketing: AI identifies micro-segments within customer bases for targeted campaigns
Inventory optimization: Predictive models reduce stockouts by 25% while maintaining optimal inventory levels
Price optimization: Real-time pricing algorithms increase profitability by 2–5% through market analysis
Implementation strategy: Start with one high-impact use case like demand forecasting, then expand to marketing personalization and pricing optimization. Companies implementing business intelligence strategy see the biggest wins by predicting market movements before competitors recognize them.
2. Hyper-personalization through advanced customer data platforms
What changed: Consumer expectations for personalized experiences reached unprecedented levels, forcing CPG brands to move beyond basic segmentation.
The personalization revolution centers on Customer Data Platforms (CDPs) that unify online and offline customer interactions. Hyper-personalization through customer data platforms and retail media networks is driving 66% higher ROI on targeted campaigns, according to industry data from InContext Solutions.
Strategic components:
Unified customer profiles: Combine purchase history, digital behavior, and demographic data into single customer views
Real-time personalization engines: Deliver customized product recommendations across all touchpoints
Retail media network integration: Leverage Amazon, Walmart, and Target advertising platforms for precision targeting
Loyalty program analytics: Transform loyalty data into predictive insights about purchase intent
Our sales and marketing analytics services help brands implement comprehensive personalization strategies that connect online browsing to in-store purchases, with leading CPG brands reporting 35% improvement in customer lifetime value.
3. Omnichannel analytics integration for unified operations
The challenge: Modern consumers seamlessly switch between online and offline channels, but most CPG brands still analyze these touchpoints separately.
Omnichannel analytics integration allows real-time inventory tracking across 60% of households that shop both online and in-store. The brands winning in 2025 have eliminated data silos between e-commerce platforms, retail partnerships, and direct-to-consumer channels.
Critical capabilities:
Real-time inventory visibility: Track product availability across all channels to prevent stockouts and overstock situations
Unified customer journey mapping: Understand how customers move between digital and physical touchpoints
Cross-channel attribution: Measure the true impact of marketing efforts across all customer interactions
Coordinated promotion management: Synchronize pricing and promotional strategies across retail partners
Implementation framework: Successful omnichannel integration requires robust data visualization services that provide executives with unified dashboards showing performance across all channels simultaneously.
4. Advanced spend analytics solutions optimize trade investments
The evolution: CPG brands now treat trade promotion spending as a science rather than an art, using analytics to maximize retailer relationship ROI.
McKinsey research shows retail trade promotions can account for as much as 20 percent of revenue for food and beverage companies and are particularly ripe for digital and analytics optimization. Advanced spend analytics solutions help brands understand which retailer investments drive actual sales versus those that simply move inventory.
Key analytical capabilities:
Trade promotion effectiveness: Measure incremental sales lift from promotional activities across different retailers
Price elasticity modeling: Understand optimal pricing strategies for different customer segments and retail channels
Retailer performance analytics: Evaluate which partnerships deliver highest return on promotional investment
Market share analysis: Track competitive positioning and identify opportunities for share growth
ROI impact: Brands implementing comprehensive spend analytics report 15–20% improvement in trade promotion effectiveness while reducing overall promotional spending.
5. Sustainability compliance and ESG analytics
The new requirement: Environmental, Social, and Governance (ESG) metrics transformed from optional reporting to mandatory business intelligence in 2025.
According to Innova Market Insights, 62% of U.S. consumers say they prioritize health and wellness when making food and beverage purchases, reinforcing the growing demand for products that align with their lifestyle choices. This consumer shift requires sophisticated analytics to track and optimize sustainability metrics across the entire value chain.
Essential tracking metrics:
Carbon footprint analysis: Monitor emissions across manufacturing, transportation, and packaging
Supply chain transparency: Track ingredient sourcing and labor practices through digital documentation
Packaging optimization: Analyze material usage and recyclability impact on brand perception
Waste reduction monitoring: Measure food waste and packaging efficiency across distribution channels
Industry expert insight
“The brands that will dominate in 2025 understand that analytics isn’t just about looking backward — it’s about predicting and shaping the future. CPG companies that master real-time decision making will capture the disproportionate share of growth,” says Erik Brynjolfsson, Professor at Stanford University and Director of the Digital Economy Lab.
Technology stack recommendations for 2025
Business intelligence platforms
Modern business intelligence consulting services recommend Tableau and Power BI dashboards for real-time visibility into demand and sales trends, while industry-specific templates accelerate implementation with pre-built CPG analytics frameworks.
Predictive AI/ML platforms
Google Cloud AI enables advanced forecasting and customer analytics, while specialized vendor solutions partner with providers like Tredence for CPG-specific AI capabilities.
Supply chain control towers
Real-time logistics analytics from Oracle SCM or Kinaxis provide end-to-end visibility, with revenue growth management solutions from TELUS offering shelf analytics and optimization.
Measuring success: Key performance indicators
Operational metrics
Forecast accuracy improvement: Target 15–20% increase in demand prediction precision
Inventory optimization: Achieve a 25% reduction in excess inventory while maintaining service levels
Supply chain efficiency: Reduce operational costs by 10–15% through analytics-driven optimization
Customer engagement metrics
Personalization effectiveness: Measure 30–40% improvement in marketing campaign response rates
Customer lifetime value: Track 20–25% increase through targeted retention strategies
Omnichannel satisfaction: Monitor unified customer experience scores across all touchpoints
Financial performance indicators
Revenue growth: Analytics-driven brands report 5–10% faster revenue growth than competitors
Margin improvement: Trade promotion optimization delivers 15–20% better ROI
Market share gains: Data-driven positioning strategies capture 2–3% additional market share
Common implementation pitfalls to avoid
Data quality challenges
The biggest mistake I see CPG brands make is implementing advanced analytics on poor-quality data. Our top data analytics challenges guide shows that ensuring data cleansing and validation processes before building sophisticated models is critical.
Technology over strategy
Don't lead with technology selection. Start with business objectives, then identify the analytical capabilities needed to achieve those goals through proper BI implementation .
Siloed implementation
Avoid department-specific analytics solutions. The biggest value comes from integrated analytics that connect supply chain, marketing, sales, and finance data.
Conclusion: Your next steps towards analytics leadership
The CPG retail analytics trends of 2025 represent more than technological evolution — they define a new competitive reality. McKinsey's research confirms that brands implementing comprehensive digital and AI transformations can achieve significant EBITDA improvements, while the AI in CPG market is projected to reach $86.7 billion by 2033 .
Key takeaways for immediate action:
Start with data foundation: Audit your current analytics capabilities and identify critical gaps
Choose your first AI use case: Begin with demand forecasting or trade promotion optimization for quick wins
Invest in omnichannel integration: Break down data silos between online and offline customer touchpoints
Build analytical talent: Hire data scientists and train existing teams on analytics-driven decision making
The competitive advantage belongs to brands that view analytics as a strategic capability, not just a reporting function. In 2025's complex retail environment, the companies that combine deep consumer insights with operational excellence will not just survive — they'll define the future of CPG.
Ready to transform your CPG analytics capabilities? Our specialized CPG analytics consulting services help brands build data-driven competitive advantage
#data analytics consulting company#data analytics consulting#data and analytics consultant#data analytics consulting services#data and analytics consulting#data analytics#data analytics consultant#business intelligence consulting
0 notes
Text
Top BI Tools Revolution: Why 2025’s Winners Aren’t Who You Think

Most companies are still fighting yesterday’s battles while smart organizations gain unfair advantages from tools nobody’s talking about yet.
I watched a $50M company waste six months evaluating Tableau vs. Power BI while their scrappy competitor used an emerging platform to gain market-defining insights in just three weeks.
The difference wasn’t the data — it was choosing the right tool instead of the popular one.
The Uncomfortable Truth About BI Tool Selection
Here’s what vendors won’t tell you: 73% of BI implementations fail to deliver expected ROI within the first year. Why? Because companies fall for marketing hype instead of understanding what they need.
🚨 Reality Check: Most businesses don’t need the “best” BI tool — they need the RIGHT BI tool. I’ve seen companies waste $100K+ on Tableau licenses when a $10/month Power BI subscription would’ve solved their problems perfectly.
According to Mordor Intelligence, the global BI market will grow from $38.15 billion in 2025 to $56.28 billion by 2030. But Gartner research shows 87% of organizations have low BI maturity — meaning most companies are buying expensive tools they can’t even use properly.
This is precisely why many organizations turn to professional business intelligence services to navigate the complex landscape and avoid costly implementation mistakes.
The Market Leaders Everyone Knows
Let’s get the obvious choices out of the way with our analysis of the top BI tools currently dominating the market:
Microsoft Power BI (20% market share) dominates for good reason — seamless Microsoft integration, competitive pricing ($10/user/month), and monthly feature updates. Best for organizations already in the Microsoft ecosystem.
Tableau (16.4% market share) remains the visualization king, perfect for data scientists and advanced analysts who need sophisticated charting capabilities. Budget $75–150/user/month, including training.
Qlik Sense (10% market share) offers unique associative analytics with AI-driven insights through its Insight Advisor. Ideal for large enterprises needing advanced exploration capabilities.
But here’s where it gets interesting…
Rising Stars: The Tools Smart Companies Are Using
While everyone debates the same old platforms, innovative companies are gaining competitive advantages from these emerging tools:
1. Hex — The Collaborative Analytics Game Changer
Hex just raised $70M in Series C funding (May 2025) and is revolutionizing how data teams collaborate. Their notebook-style interface blends SQL, Python, and no-code tools seamlessly.
Companies like Notion, Reddit, and Twilio use Hex because it bridges the gap between technical data teams and business stakeholders. Their customers report 60% faster time-to-insight compared to traditional BI tools.
Why it matters: Finally, data scientists can build analyses that business users can actually interact with — no more “dashboard graveyards.”
2. Definite — The Startup Disruptor
This under-the-radar platform offers 500+ pre-built integrations with automated data cleaning and a managed data warehouse — all for startup-friendly pricing.
The differentiator: Unlike traditional BI tools requiring separate ETL processes, Definite handles the entire data pipeline from extraction to visualization in one platform. Perfect for Series A-B companies needing enterprise-grade analytics without enterprise complexity.
3. Databox — The Marketing Analytics Specialist
While everyone builds general-purpose BI tools, Databox laser-focuses on marketing and sales analytics with 70+ native integrations to marketing tools.
Their 2025 State of Marketing Analytics report shows companies using Databox improve campaign ROI by 34% on average. Ideal for growth-driven companies who don’t want to learn complex BI tools.
4. Improvado — The Enterprise Marketing Data Warehouse
Purpose-built for marketing analytics with AI-powered data normalization across 500+ marketing platforms. Companies like ASUS, Docker, and Indeed use Improvado because it’s the only platform that truly understands marketing data complexity.
The problem it solves: Marketing teams waste 40% of their time on data preparation. Improvado’s AI automatically standardizes campaign data from different platforms.
Implementation Reality: Why Most Projects Fail
Even with the right tools from our comprehensive top BI tools analysis, implementation success depends heavily on execution strategy.
Common failure patterns:
Technology-first approach: Getting excited about features before understanding requirements
Underestimating change management: Harvard Business Review research shows 70% of BI projects fail due to user adoption issues
Ignoring data quality: Even sophisticated tools can’t fix fundamental data problems
This is where experienced business intelligence services become invaluable — they help organizations avoid these pitfalls while accelerating time-to-value.
Industry-Specific Recommendations
Manufacturing
Top Choice: Qlik Sense for complex supply chain relationships, Emerging Alternative: Hex for manufacturers with data science teams needing predictive maintenance models
Healthcare
Established Leader: Tableau with Healthcare Data Models and HIPAA compliance, Innovation Play: Definite for healthcare startups needing rapid deployment
Retail
Best for Inventory: ThoughtSpot for natural language queries, Marketing Focus: Databox or Improvado for attribution analytics
Learn more about implementing these trends in our Business Intelligence Strategy Guide.
The Hidden Costs Nobody Mentions
That $10/month Power BI license becomes $50–100/month per user when you factor in:
Premium connector fees
Additional storage costs
Training and certification expenses
Third-party visualization add-ons
Reality Check: I’ve seen Power BI implementations balloon from $2 $2K projected annual cost to $25K actual spend. Always calculate Total Cost of Ownership, not just license fees.
Why Tableau is Overrated for Most Businesses
Controversial take: Tableau is the iPhone of BI tools — beautiful, powerful, and probably overkill for 70% of users.
According to Forrester’s 2025 BI Wave report, user adoption rates are 40% higher for simpler tools like Power BI compared to Tableau in organizations under 1,000 employees.
When you DON’T need Tableau:
Basic visualization needs
Budget constraints
Quick implementation requirements
Non-technical user base
The 2025 Selection Framework
Stop vendor shopping and start solution shopping. Ask these questions:
What specific business decision will this help me make faster?
Can my actual team use it effectively?
What’s the TRUE implementation timeline? (Hint: vendors lie about this)
Am I solving a real problem or just buying shiny technology?
For comprehensive guidance on building a data-driven strategy, explore our detailed business intelligence implementation guide that covers foundational concepts, ensuring BI success.
The Bottom Line
The organizations winning in 2025 aren’t necessarily those with the most sophisticated tools — they’re the ones that most effectively turn data into action.
Ready to move beyond generic BI recommendations? The future belongs to companies that choose tools based on business problems, not vendor marketing. Whether you go with established leaders or emerging platforms, make sure your choice aligns with your team’s capabilities and actual needs.
The data revolution isn’t coming — it’s here. The question is: will you lead it or let it pass you by?
For expert guidance on selecting and implementing the right BI platform for your specific needs, consider working with experienced business intelligence services specialists who can navigate the complex landscape and ensure your investment delivers measurable results.
#data analytics consulting company#data analytics consulting services#analytics consulting#data analytics#data analytics consultant
0 notes
Text
The Hidden Truth About AI Analytics That’s Costing Companies Millions

Why 67% of AI implementations fail and what successful organizations do differently
The AI analytics gold rush is creating two types of companies: those gaining massive competitive advantages and those burning through budgets with little to show for it. After analyzing over 200 implementations across industries, I’ve identified exactly what separates success from expensive disappointment.
The $47 Million Wake-Up Call
Last year, I watched a Fortune 500 retailer lose $47 million on a Southeast Asia expansion that their traditional analytics team had green-lit. They had everything: customer surveys, market research, competitor analysis, and expensive consultants. The data pointed to “cautious optimism.”
Six months later, they discovered they’d completely misread the market.
The killer detail? Buried in their customer service logs were 847 complaints about product availability, which, when cross-referenced with social media sentiment and purchasing patterns, revealed a massive untapped demand segment that their expansion had completely missed.
An AI system would have identified this correlation in 12 minutes. Instead, it cost them nearly $50 million and two years of market opportunity.
This isn’t just about having better tools — it’s about transforming how organizations approach data analytics consulting and decision-making entirely.
Why Most AI Analytics Projects Fail
This isn’t an isolated incident. According to McKinsey research, 78% of organizations have implemented AI in at least one function, with data analytics leading adoption. But here’s the uncomfortable truth: 67% of these implementations deliver marginal results.
After studying hundreds of projects, the failure pattern is clear: organizations approach AI analytics backwards. They start with technology instead of problems.
The typical failure sequence:
Executive reads about AI success stories
The company hires data scientists and buys expensive platforms
Team struggles to connect AI capabilities to business outcomes
Project delivers technically impressive but business-irrelevant insights
Leadership questions ROI and reduces AI investment
This mirrors what we see with traditional business intelligence consulting projects — when implementation doesn’t align with actual business needs, even the best technology fails to deliver value.
What Successful Organizations Do Differently
The companies achieving real results follow a systematic approach I call the D.A.T.A. framework:
Define Before You Design
Successful implementations start with specific business decisions, not vague goals like “better insights.” They answer three critical questions:
What specific decision are you trying to improve?
How will you measure success in dollars or time?
Who has the authority to act on these insights?
If you can’t answer all three specifically, you’re not ready for implementation. This aligns perfectly with the business intelligence strategy approach that successful mid-sized companies use.
Acquire Quality Data First
The 80/20 rule applies: spend 80% of preparation time on data quality, 20% on tool selection. Poor data quality is the #1 reason AI projects fail, yet most organizations rush to choose platforms before auditing their information assets.
As we’ve seen in our data cleaning automation implementations, companies that invest in automated data quality processes save 20+ hours per week while dramatically improving their AI outcomes.
Transform With Appropriate Tools
Technology selection should match team capabilities, not marketing hype:
Beginners: AI-enhanced versions of current tools (Power BI AI features, Tableau GPT)
Intermediate: Cloud AutoML platforms (Google Cloud AI, Azure ML)
Advanced: Custom solutions (only if you have dedicated data science resources)
Act on Insights Systematically
Having AI insights means nothing without the organizational ability to act. Successful implementations create decision triggers, establish feedback loops, and build change management processes.
Real-World Success Metrics
When implemented correctly, AI analytics delivers measurable impact:
Manufacturing: An aerospace parts manufacturer reduced unplanned equipment outages by 73% in year one, saving $1.68 million while extending equipment life an average of 18 months.
Retail: A fashion retailer improved inventory turnover 34% and reduced out-of-stock events 67% by using AI to analyze social media sentiment, weather patterns, and purchase history simultaneously.
Healthcare: A hospital network analyzing 2.4 million patient records identified readmission risk patterns invisible to traditional methods, reducing unexpected readmissions 28% and saving $4.2 million in the first year.
Financial Services: Credit unions using AI for fraud detection achieve a 50% reduction in false positives while catching sophisticated fraud rings that rule-based systems miss entirely.
These results mirror what we’ve achieved through our specialized financial services analytics implementations, where AI-powered risk management systems have transformed how institutions detect and prevent fraud.
The 2025 Reality Check
AI analytics isn’t an emerging technology — it’s a competitive necessity today. Three trends have converged to make implementation essential:
Data volume explosion: 90% of the world’s data was generated in the last two years
Computing accessibility: Cloud AI services that cost millions now available for hundreds monthly
Interface evolution: Natural language processing finally works reliably for business applications
The result? Organizations with AI analytics predict market changes before competitors recognize them, optimize operations continuously instead of quarterly, and make decisions based on data patterns invisible to traditional analysis.
This transformation aligns with the broader business intelligence and analytics trends for 2025 that are reshaping how mid-sized companies compete.
Common Implementation Pitfalls
Perfectionism Paralysis: Waiting for perfect data delays implementation indefinitely. Start with “good enough” data and improve iteratively.
Technology-First Thinking: Selecting tools before defining problems leads to expensive solutions, searching for applications. This is why choosing the right Power BI consultant matters — they focus on business outcomes first.
Magic Thinking: Expecting AI to solve problems without understanding what questions to ask or how to act on answers.
Skills Assumptions: Hiring data scientists without building an analytical culture creates technical capabilities without business impact. Consider data engineering services to build the infrastructure foundation first.
Avoiding the $47 Million Mistake: Your Action Plan
The choice every organization faces isn’t whether to implement AI analytics — it’s whether to lead the transformation or follow it. Every month organizations delay, competitors gain advantages that become exponentially harder to overcome.
Success requires more than implementing tools. It demands rethinking how organizations discover, validate, and act on insights. The companies thriving five years from now started this transformation today.
Ready to Transform Your Analytics Approach?
The $47 million mistake I witnessed could have been prevented with proper AI analytics implementation. Don’t let your organization become another expensive lesson in what not to do.
The data is already there. The patterns are waiting to be discovered. The only question is whether you’ll find them before your competitors do.
Take Action Today
Immediate Steps You Can Take:
Assess Your Current State: Review your existing analytics capabilities against the D.A.T.A. framework
Identify Quick Wins: Start with one high-impact use case where AI can deliver immediate value
Build Your Foundation: Implement data quality automation to ensure reliable inputs for AI systems
Need Expert Guidance?
Don’t navigate this transformation alone. Our data analytics consulting services have helped companies avoid costly implementation mistakes while accelerating their AI analytics success.
We’ve guided organizations through successful AI implementations that deliver measurable ROI within 90 days. From strategy development to full implementation, we ensure your AI analytics investment drives real business outcomes.
Ready to discuss your AI analytics strategy? Contact our team for a free consultation where we’ll assess your current capabilities and create a roadmap for AI analytics success.
#data analytics consulting services#data analytics consulting company#data analytics consulting#analytics consulting#data and analytics consultant
0 notes
Text
Why CPG Digital Transformation Is Unlike Any Other Industry

When I first started working with CPG industry companies five years ago, I assumed digital transformation would follow the same playbook we used for tech startups and financial services. I couldn’t have been more wrong.
CPG digital transformation presents unique challenges that distinguish it from every other industry I’ve worked with. While a software company can pivot its entire business model in months, CPG industry companies must navigate physical supply chains, complex retail partnerships, and regulatory frameworks that have been decades in the making.
Here’s what I’ve learned: successful CPG digital transformation isn’t about becoming a tech company — it’s about using technology to become a better consumer goods company. And that distinction makes all the difference.
Why CPG Digital Transformation Can’t Follow Standard Playbooks
The Physical-Digital Integration Challenge
Unlike purely digital businesses, CPG industry companies must bridge the gap between physical operations and digital capabilities. When I worked with a major beverage company last year, their biggest challenge wasn’t implementing analytics software — it was connecting IoT sensors in 47 manufacturing facilities with their demand forecasting models while maintaining FDA compliance.
This integration complexity creates unique CPG industry challenges that don’t exist in other sectors:
Manufacturing Integration: Production lines can’t be shut down for system upgrades. Any AI implementation in the CPG industry must work alongside existing equipment, often dating back decades.
Supply Chain Complexity: McKinsey research shows that CPG companies typically manage 50–100 suppliers compared to 10–20 for technology companies. CPG supply chain digital transformation must coordinate across this entire ecosystem without disrupting daily operations.
Regulatory Constraints: Food safety, labeling requirements, and environmental regulations create compliance frameworks that digital systems must support, not replace.
Our specialized CPG analytics solutions help companies navigate these unique integration challenges while maintaining operational excellence.
The Retailer Relationship Dependency
Here’s something that surprised me: CPG digital transformation success often depends more on retailer collaboration than internal technology adoption.
Traditional CPG companies don’t control their customer relationships directly — retailers do. This creates a fundamental difference from industries like banking or healthcare, where digital transformation focuses on direct customer engagement.
Data Sharing Limitations: Unlike e-commerce companies that own their customer data, CPG brands must negotiate with retailers for access to consumer insights. Your CPG digital transformation strategy must work within these constraints.
Shelf Space Competition: Digital Capabilities Become Competitive Advantages in Retailer Negotiations. Brands with better CPG procurement digital solutions and demand forecasting can offer retailers lower prices and higher service levels.
Omnichannel Complexity: Today’s consumers might discover your product on social media, research it on Amazon, and purchase it at Walmart. Your digital infrastructure must support this journey without direct customer touchpoints.
The Scale and Speed Paradox
CPG industry companies face a unique paradox: they need the agility of startups but must operate at massive scale with established infrastructure.
Consider the numbers: A typical retail analytics transformation might involve 50–100 stores. A global CPG company operates across 180+ countries with thousands of SKUs and millions of retail touchpoints.
Volume Challenges: When Procter & Gamble implements AI in CPG industry solutions, they’re processing data from billions of consumer interactions annually. The infrastructure requirements dwarf those of most other industries.
Legacy System Integration: Unlike tech companies that can rebuild from scratch, CPG firms must integrate with ERP systems, manufacturing equipment, and supply chain networks that represent billions in investment.
Speed-to-Market Pressure: Consumer trends can shift in weeks, but traditional CPG product development cycles take 18–24 months. CPG digital transformation must compress these timelines without sacrificing quality or compliance.
What Makes CPG Procurement and Supply Chain Unique
The Complexity of CPG Procurement Digital Transformation
CPG procurement digital transformation differs fundamentally from other industries due to the complexity of sourcing raw materials, packaging, and components across global supply chains.
Commodity Price Volatility: Unlike tech companies purchasing standardized components, CPG firms deal with agricultural commodities subject to weather, geopolitical events, and seasonal variations. BCG research indicates that effective CPG procurement digital solutions can reduce sourcing costs by 15–30% through better price forecasting and supplier optimization.
Quality and Safety Requirements: A software bug inconveniences users; a contaminated ingredient can kill people. CPG procurement digital solutions must include sophisticated quality tracking, batch management, and recall capabilities that other industries don’t require.
Sustainability Pressure: Consumer demand for sustainable products creates procurement complexity that doesn’t exist in sectors like financial services. Modern supply chain analytics platforms must track carbon footprints, fair trade compliance, and circular economy metrics alongside traditional cost and quality metrics.
The Multi-Tier Supplier Challenge
Most industries manage direct suppliers. CPG companies must monitor suppliers’ suppliers — often 3–4 tiers deep — to ensure quality, sustainability, and supply security.
Visibility Requirements: When a typhoon hits Southeast Asia, CPG companies need to know within hours which products might be affected, even if the impact is through third-tier suppliers. This requires CPG supply chain digital transformation capabilities that extend far beyond traditional vendor management.
Relationship Management: Unlike technology procurement, where switching suppliers is relatively straightforward, CPG supplier relationships often involve long-term partnerships, capacity commitments, and co-innovation agreements that digital systems must support.
The Consumer Behavior Complexity Factor
Real-Time Decision Making at Point of Sale: Here’s where CPG digital transformation gets interesting: consumer purchase decisions happen in seconds, but the data to influence those decisions must be processed across complex supply chains and retail networks.
Shelf-Level Intelligence: Retail industry research shows that 76% of purchase decisions are made in-store. AI in cpg industry applications must provide real-time insights about inventory levels, promotional effectiveness, and competitive positioning at thousands of retail locations simultaneously.
Personalization at Scale: Unlike direct-to-consumer brands that can personalize individual experiences, CPG companies must create personalized experiences through retail partners using aggregated, often delayed data.
Our data science consulting services help CPG companies build predictive models that work within these unique constraints.
The Brand Portfolio Challenge: Most industries focus on single products or services. Large CPG companies manage dozens of brands across multiple categories, each with different consumer segments, retail channels, and competitive dynamics.
Cross-Portfolio Insights: A successful CPG digital transformation must identify opportunities for cross-portfolio synergies while maintaining brand distinctiveness. This requires analytics capabilities that can operate at both granular SKU levels and portfolio-wide strategic levels.
Understanding these differences isn’t just academic — it’s essential for success. The CPG industry companies that thrive in the digital economy are those that embrace their unique constraints and turn them into competitive advantages through thoughtful, specialized digital strategies.
Conclusion: Your CPG Digital Transformation Success Depends on Industry Expertise
CPG digital transformation isn’t just different from other industries — it’s exponentially more complex. The intersection of physical operations, regulatory compliance, retailer relationships, and global supply chains creates challenges that generic digital consultants simply can’t address.
The key differentiators that make CPG digital transformation unique include:
Physical-digital integration across manufacturing, supply chain, and retail operations
Multi-tier supplier relationships requiring visibility 3–4 levels deep
Retailer dependency that constrains direct customer relationships
Regulatory complexity that makes compliance a core feature, not an afterthought
Scale with agility paradox demanding startup speed at enterprise scale
The CPG industry companies winning today understand these constraints aren’t limitations — they’re opportunities to build sustainable competitive advantages through specialized AI in CPG industry applications and CPG supply chain digital transformation strategies.
Ready to Transform Your CPG Operations?
Don’t let generic consultants apply one-size-fits-all solutions to your unique CPG challenges. Our specialized CPG analytics solutions are designed specifically for the complexities of consumer goods companies.
Cpgdigitaltransformation
Cpg Analytics
Cpg Analytics Solutions
#data analytics#data analytics consulting#analytics consulting#data and analytics consulting#data analytics consultant#data analytics consulting company#data and analytics consultant
0 notes
Text
Data Analytics in Healthcare: Transform Patient Care Through Smart Data

Three months ago, I sat in a hospital boardroom listening to a CMO describe their biggest challenge: “We’re flying blind. By the time we see problems in our data, patients have already suffered.”
That conversation changed everything about how I approach data analytics in healthcare. It wasn’t just about numbers on dashboards — it was about saving lives through smarter use of information.
Today, that same hospital prevents complications 6 hours before they happen, reduces patient wait times by 40%, and has eliminated $2.1 million in readmission penalties. The difference? They stopped treating data as an afterthought and made it the foundation of patient care.
Here’s what I’ve learned after helping dozens of healthcare organizations transform their operations: the hospitals thriving today aren’t necessarily the ones with the newest equipment or biggest budgets. They’re the ones that have mastered the art of turning data into better patient outcomes.
Quick Answer: Data analytics in healthcare transforms medical institutions by analyzing patient data to predict complications, optimize operations, and personalize treatments. Healthcare analytics reduces readmission rates by 30%, cuts operational costs by 25%, and enables predictive care that prevents 60% of avoidable complications. Modern healthcare data and analytics platforms integrate real-time monitoring, clinical decision support, and population health management to deliver proactive, evidence-based care that improves outcomes while reducing costs.
Why Healthcare Analytics Matters More Than Ever
Healthcare modernization isn’t optional anymore — it’s survival. The industry faces unprecedented pressures: aging populations, workforce shortages, rising costs, and patients who expect Amazon-level service. Traditional approaches can’t keep up.
I recently worked with a 300-bed regional hospital drowning in manual processes. Nurses spent 3 hours per shift hunting for patient information across 12 different systems. Quality reports took weeks to compile, making them useless for real-time decision-making. Sound familiar?
Within six months of implementing our healthcare analytics solutions, they achieved remarkable results:
45% reduction in documentation time
Real-time quality monitoring across all units
Predictive alerts preventing 89 serious complications
$1.8 million in operational cost savings
The transformation wasn’t just technical — it was cultural. When clinicians trust their data, they make better decisions faster.
The Power of Healthcare Predictive Analytics
Healthcare predictive analytics represents the biggest shift in medicine since the introduction of antibiotics. Instead of reacting to problems, we can now prevent them.
Think about sepsis — a condition that kills more hospital patients than heart attacks and strokes combined. Traditional detection methods identify sepsis after organ dysfunction begins. By then, mortality rates skyrocket and treatment costs explode.
Our predictive sepsis model changes this equation completely. By analyzing vital signs, lab values, and clinical notes in real-time, the system identifies at-risk patients up to 6 hours earlier than conventional methods. The impact is profound:
67% reduction in sepsis-related deaths
$4.2 million saved in intensive care costs
23% decrease in average length of stay for sepsis patients
But predictive analytics extends far beyond sepsis detection. We’re helping hospitals predict:
Which patients will likely be readmitted within 30 days
When medical equipment will fail before it impacts patient care
Optimal staffing levels to match patient demand
Which treatments will work best for individual patients
The technology exists today. The question is whether your organization is ready to embrace it.
Clinical Analytics: Turning Data into Better Care
While predictive analytics grabs attention, clinical analytics forms the backbone of data-driven healthcare. This encompasses everything from tracking quality metrics to supporting clinical decision-making at the point of care.
I implemented a clinical decision support system at a community hospital that analyzes every medication order in real-time. The system checks for allergies, drug interactions, appropriate dosing based on kidney function, and alignment with clinical guidelines. The results speak for themselves:
71% reduction in medication errors
34% decrease in adverse drug events
$890,000 savings from prevented complications
94% physician satisfaction with the system
The key insight? Clinicians don’t want more data — they want the right data at the right time. Our approach integrates analytics seamlessly into existing workflows, providing insights when and where they’re needed most.
Clinical analytics also enables precision medicine approaches. By analyzing treatment responses across patient populations, we can identify which therapies work best for specific genetic profiles, demographics, or clinical presentations. One oncology practice I worked with improved treatment response rates by 38% using personalized treatment protocols based on comprehensive patient data analysis.
Data Governance: The Foundation of Trust
Here’s something most healthcare leaders get wrong: they focus on collecting more data before ensuring the data they have is accurate, secure, and properly governed.
Data governance in healthcare isn’t just about compliance — it’s about building trust. When clinicians doubt data quality, they ignore analytics recommendations. When patients worry about privacy, they withhold critical information. When administrators face audit findings, entire initiatives get shut down.
Effective governance requires three pillars:
Data Quality: Implementing automated checks that flag inconsistencies, missing values, and outliers before they impact decision-making. We use validation rules that catch errors like impossible vital signs or conflicting medication records.
Security and Privacy: Following HIPAA requirements while enabling innovation through role-based access controls, encryption, and comprehensive audit trails. Our data analytics consulting approach builds privacy protection into every system design.
Ethical AI: Ensuring algorithms perform equitably across different patient populations and providing transparency in AI-driven recommendations. We test for bias and maintain human oversight over all automated decisions.
A health system in Texas implemented our governance framework and achieved 99.7% data accuracy across clinical systems, zero HIPAA violations over three years, and $2.1 million in avoided compliance penalties.
Modern Infrastructure for Healthcare Analytics
Analytics modernization requires more than new software — it demands a fundamental rethinking of how healthcare organizations manage and use data.
Legacy systems create silos where patient information gets trapped in departmental databases that don’t communicate. Modern infrastructure breaks down these barriers through cloud-based platforms that integrate data from electronic health records, laboratory systems, imaging, pharmacy, and even patient wearables.
I recently helped a health network implement a unified data platform that:
Ingests real-time data from all clinical systems
Provides instant access to patient information across facilities
Enables predictive models that update every 15 minutes
Supports both clinical care and operational decision-making
The results exceeded expectations: 85% faster report generation, real-time visibility into patient flow, and predictive analytics that prevented 127 serious complications in the first year.
Cloud infrastructure also enables advanced capabilities impossible with traditional systems. Our data engineering services help healthcare organizations build scalable, secure platforms that support everything from basic reporting to sophisticated machine learning applications.
Implementation Strategy: Starting Your Journey
Healthcare data and analytics transformation doesn’t happen overnight, but it doesn’t have to take years either. The key is starting with focused, high-impact initiatives that prove value quickly.
Here’s the approach that works:
Phase 1: Foundation (Months 1–3) Begin with data governance and infrastructure. Establish quality standards, implement security controls, and create unified data access. This isn’t glamorous work, but it’s essential.
Phase 2: Quick Wins (Months 4–6) Deploy real-time dashboards for key operational metrics. Focus on pain points everyone recognizes: patient flow, quality indicators, resource utilization. These visible improvements build momentum for larger initiatives.
Phase 3: Predictive Capabilities (Months 7–12) Implement predictive models for specific use cases like readmission risk or sepsis detection. Start narrow and prove value before expanding scope.
Phase 4: Advanced Analytics (Year 2+) Build sophisticated capabilities like clinical decision support, precision medicine analytics, and population health management.
The regional health system I mentioned earlier followed this exact roadmap. Their $2.8 million investment delivered $4.1 million in measurable benefits within 18 months — a 46% ROI that continues growing.
Measuring Success: Beyond ROI
While financial returns matter, the real value of healthcare modernization lies in improved patient outcomes. Track metrics that matter:
Reduced complication rates and readmissions
Faster diagnosis and treatment times
Improved patient satisfaction scores
Enhanced clinician experience and reduced burnout
Better population health outcomes
One hospital I worked with prevents 15–20 serious complications monthly through predictive analytics. That’s 15–20 families who don’t experience the trauma of unexpected medical crises. How do you put a price on that?
The Future of Healthcare Analytics
We’re still in the early stages of the data analytics in healthcare revolution. Emerging technologies like natural language processing, computer vision, and advanced AI will unlock new possibilities we can barely imagine today.
But the foundation remains the same: clean data, robust governance, and a culture that values evidence-based decision-making. Organizations building these capabilities now will lead the industry tomorrow.
The hospitals struggling with outdated systems and manual processes aren’t just missing efficiency opportunities — they’re failing to provide the quality of care patients deserve in 2025.
Taking the Next Step
Your journey toward data-driven healthcare starts with understanding where you are today and creating a realistic roadmap for where you want to be. The technology is proven, the benefits are clear, and the time is now.
Every day you delay implementing modern healthcare data and analytics is another day of missed opportunities to save lives, reduce costs, and improve patient experiences.
Ready to transform your healthcare organization with modern analytics? Contact us today to discover how our proven healthcare analytics solutions can deliver measurable improvements in patient outcomes and operational efficiency.
#analytics consulting#data analytics consulting services#data analytics#data analytics consultant#data and analytics consultant
0 notes
Text
Why Most Companies Fail at AI Data Visualization in 2025

A data strategist’s perspective on what separates successful data-driven organizations from those drowning in dashboards
I’ll never forget the moment a Fortune 500 executive looked at me across a conference table and said, “We have 47 different dashboards, but I still can’t answer whether our Q3 marketing campaign actually worked.”
That conversation happened three years ago, but it perfectly captures the AI tools for data visualization crisis facing businesses today. Despite spending billions on BI tools and analytics platforms, 73% of organizations struggle to extract meaningful insights from their data investments.
The problem isn’t a lack of data or tools — it’s a fundamental misunderstanding of what effective AI-powered data visualization tools actually accomplish.
The Hidden Cost of Bad Data Visualization
Here’s a statistic that should alarm every business leader: companies lose an average of $15 million annually due to poor data visualization and delayed decision-making. That’s not just about pretty charts or color schemes — it’s about the strategic decisions that get postponed, the opportunities that slip away, and the competitive advantages that never materialize.
I’ve witnessed this firsthand across hundreds of client engagements. Organizations invest heavily in data collection and storage, then wonder why their teams still can’t answer basic business questions quickly. The missing piece isn’t more data — it’s strategic data visualization services that transform raw information into actionable intelligence.
The Three Critical Gaps Most Organizations Face
Gap 1: Technical Complexity vs. Business Needs Most data visualization tools implementations prioritize technical sophistication over user adoption. Teams build complex dashboards that require extensive training, then wonder why executives prefer Excel spreadsheets for critical decisions.
Gap 2: Static Reporting vs. Dynamic Intelligence Traditional approaches focus on historical reporting rather than forward-looking insights. Modern AI data visualization tools can predict trends and automatically surface anomalies, but most organizations are still stuck in reactive reporting mode.
Gap 3: Tool-Centric vs. Strategy-Centric Thinking Organizations often select best AI data visualization tools first, then try to fit their business needs around platform capabilities. This backwards approach leads to expensive implementations that never deliver promised ROI.
What Separates High-Performing Data Organizations
After analyzing successful data transformation initiatives across industries, a clear pattern emerges. The 27% of companies that excel at AI tools for data visualization share three fundamental characteristics:
1. They Prioritize Business Outcomes Over Technical Features
Successful organizations start with specific business questions they need to answer, then design visualization strategies around those outcomes. Instead of asking “What can this tool do?” they ask “What decisions do we need to make faster?”
A manufacturing client reduced quality control costs by $2.8 million annually simply by implementing real-time AI data visualization tools rather than daily batch reports. The tool didn’t change — the strategic approach did.
2. They Design for Adoption, Not Admiration
Beautiful dashboards that nobody uses are expensive art projects, not business tools. High-performing organizations obsess over user adoption metrics and continuously optimize based on actual usage patterns.
One retail chain achieved 94% executive dashboard adoption by focusing on mobile-first design and natural language queries through AI-powered data visualization tools. Their previous platform, despite costing 300% more, never exceeded 23% regular usage.
3. They Treat Visualization as a Strategic Capability, Not a Technical Project
The most successful implementations involve cross-functional teams that include business stakeholders, data experts, and user experience specialists. They understand that effective data visualization tools require both technical excellence and deep business context.
The AI Revolution in Data Visualization
The landscape of AI tools for data visualization has transformed dramatically in 2025. Modern platforms like Microsoft Power BI, Tableau, and Google Looker Studio now offer sophisticated AI capabilities that were unimaginable just two years ago.
Natural Language Processing Changes Everything
The most significant breakthrough in AI data visualization tools is natural language processing. Instead of learning complex query languages, business users can now ask questions like:
“Show me which product categories are underperforming this quarter”
“What factors are driving customer churn in the Northeast region?”
“Compare our marketing ROI across all channels for the past 18 months”
Modern AI-powered data visualization tools understand these queries and automatically generate appropriate visualizations with contextual insights.
Automated Insight Discovery
The best AI data visualization tools don’t just respond to questions — they proactively surface insights you might miss. ThoughtSpot and similar platforms use machine learning to continuously analyze your data, identifying anomalies, correlations, and forecast opportunities without manual intervention.
One financial services client discovered a correlation between customer support ticket volume and churn risk through automated insights that their traditional reporting had never revealed. This led to a proactive retention program that reduced churn by 18%.
Predictive Analytics Integration
Unlike traditional data visualization tools, modern AI tools for data visualization incorporate predictive capabilities directly into dashboards. Instead of showing only what happened, they forecast what’s likely to happen next, enabling proactive decision-making rather than reactive responses.
The Strategic Framework That Actually Works
Through years of implementation experience, I’ve developed a framework that consistently delivers measurable results. This approach focuses on four foundational elements that transform AI data visualization tools from a technical exercise into a strategic advantage.
Phase 1: Business Intelligence Audit
Before designing a single chart, successful projects begin with a comprehensive assessment of current decision-making processes. This involves:
Decision Mapping: Identifying the specific decisions that drive business outcomes
Information Flow Analysis: Understanding how data currently moves through the organization
Stakeholder Requirements: Documenting what different users actually need to make better decisions
Technology Assessment: Evaluating existing tools and infrastructure capabilities
This foundational work ensures that your AI-powered data visualization tools implementation addresses real business needs rather than perceived technical requirements.
Phase 2: Strategic Visualization Design
With business requirements clearly defined, the design phase focuses on creating visualization strategies that support specific outcomes:
Executive Dashboards: High-level KPIs and trend analysis for strategic decision-making using AI tools for data visualization
Operational Monitoring: Real-time performance tracking for day-to-day management
Analytical Deep-Dives: Interactive exploration tools for detailed investigation
Predictive Intelligence: Forward-looking insights that enable proactive decision-making
Phase 3: Implementation and Integration
The technical implementation phase prioritizes user adoption and business value delivery:
Phased Rollout: Starting with high-impact use cases to demonstrate immediate value
User Training: Comprehensive education programs that build organizational data literacy
Integration Planning: Seamless connectivity with existing business systems
Performance Optimization: Ensuring fast query response times and reliable uptime
Phase 4: Continuous Optimization
Successful AI data visualization tools implementation is never a “set it and forget it” proposition. The optimization phase ensures sustained value delivery:
Usage Analytics: Monitoring how stakeholders actually interact with visualizations
Business Impact Measurement: Tracking the ROI of visualization investments
Iterative Improvement: Regular updates based on changing business needs
Advanced Capability Development: Expanding into predictive analytics and AI-powered insights
Real-World Results: Case Studies in AI Visualization Transformation
Healthcare System: $12M Cost Reduction Through AI-Powered Operational Visibility
A regional healthcare network struggled with resource allocation across 23 facilities. Despite having robust ERP systems, administrators couldn’t identify capacity bottlenecks until they became critical issues.
The Challenge: Fragmented data across multiple systems made it impossible to optimize resource allocation proactively.
The Solution: Integrated operational dashboards using AI tools for data visualization that provided real-time visibility into capacity utilization, patient flow, and resource availability across all facilities. The AI components automatically flagged potential bottlenecks and suggested optimal resource allocation.
The Results:
34% reduction in patient wait times
$12 million annual cost savings through improved resource utilization
67% improvement in emergency department efficiency
89% user adoption rate among hospital administrators
Predictive capacity planning reduced overcrowding by 45%
Financial Services: 3x Faster Decision-Making with AI Analytics
A mid-market investment firm needed to accelerate their portfolio management decisions in an increasingly volatile market environment.
The Challenge: Critical investment decisions relied on static reports that were often outdated by the time they reached decision-makers.
The Solution: Real-time portfolio performance dashboards with AI-powered data visualization tools featuring predictive analytics and automated alert systems. The AI components provided market sentiment analysis and risk forecasting.
The Results:
3x faster response time to market changes
28% improvement in portfolio performance
$40 million increase in assets under management within 18 months
95% reduction in manual reporting time
AI-driven risk alerts prevented $8.2 million in potential losses
Platform Comparison: Choosing the Right AI Tools for Data Visualization
The technology landscape for AI data visualization tools has evolved dramatically, with each platform offering unique strengths:
Enterprise-Grade Solutions
Microsoft Power BI excels in organizations already using Microsoft ecosystem tools. Its AI features include natural language Q&A, automated insight generation, and predictive analytics. Best for companies under 500 employees seeking cost-effective enterprise features.
Tableau remains the gold standard for complex analytics. Its Einstein AI integration provides sophisticated machine learning capabilities and advanced statistical analysis. Ideal for data-heavy organizations with dedicated analytics teams.
Democratized AI Analytics
ThoughtSpot pioneered search-driven analytics, making AI tools for data visualization as intuitive as Google search. Perfect for organizations wanting to democratize data access across large user bases.
Google Looker Studio offers sophisticated AI data visualization tools capabilities completely free. Recent AI enhancements include smart chart suggestions, automated insights, and natural language descriptions — making it ideal for small to medium businesses.
Specialized AI Platforms
Qlik Sense uses associative analytics to reveal hidden data relationships through AI. Its cognitive engine enables natural language interaction and autonomous insight generation.
The key is matching platform capabilities to your organization’s data maturity, technical skills, and business requirements rather than chasing the latest features.
Implementation Best Practices for AI-Powered Success
Start with Strategic Clarity
Before evaluating best AI data visualization tools or hiring consultants, document the specific business decisions that visualization should improve. This clarity will guide every subsequent choice and ensure investments deliver measurable value.
Invest in Organizational Capability
Technology is only as valuable as the people who use it. Successful AI tools for data visualization initiatives require investment in training, change management, and ongoing support. Many organizations underestimate the cultural shift required to become truly data-driven.
Partner with Specialists
While internal teams understand your business, specialized consultants bring experience across industries, platforms, and implementation challenges. The right partnership accelerates time-to-value while avoiding common pitfalls that can derail AI visualization projects.
Professional data visualization services provide the expertise, methodology, and experience necessary to navigate this transformation successfully. Rather than learning through expensive trial and error, organizations can leverage proven frameworks that deliver measurable results from day one.
Measure and Optimize Continuously
AI data visualization tools improve over time through systematic measurement and optimization. Track both technical metrics (query performance, uptime, AI accuracy) and business outcomes (decision speed, user adoption, ROI).
The Future of AI-Powered Data Visualization
Looking ahead, several trends will shape the evolution of AI data visualization tools:
Conversational Analytics
Natural language interfaces will become the primary way users interact with data. Expect AI data visualization tools to understand context, remember previous conversations, and provide increasingly sophisticated responses to complex business questions.
Automated Business Intelligence
AI-powered data visualization tools will proactively monitor business performance, automatically generating reports, alerts, and recommendations. This shift from reactive to proactive analytics will fundamentally change how organizations make decisions.
Augmented Analytics
AI will increasingly act as a data analyst partner, suggesting visualizations, identifying relevant data sources, and explaining insights in business context. This augmentation will make advanced analytics accessible to every business user.
Integration with Business Workflows
Future AI tools for data visualization will embed insights directly into business applications, email, and messaging platforms. Decision-makers will receive relevant data without leaving their workflow.
Measuring Success: KPIs for AI Visualization ROI
To ensure your AI data visualization tools investment delivers value, track these key metrics:
Business Impact Metrics
Decision Speed: Time from question to insight
Data Adoption: Percentage of employees actively using analytics
Business Outcomes: Revenue, cost savings, efficiency gains attributable to data-driven decisions
Technical Performance Metrics
Query Response Time: Speed of dashboard loading and data refresh
AI Accuracy: Precision of automated insights and predictions
System Uptime: Reliability and availability of visualization platforms
User Experience Metrics
User Satisfaction: Regular surveys on tool usability and value
Training Requirements: Time needed to achieve user proficiency
Self-Service Success: Percentage of questions answered without IT support
Building Your AI Data Visualization Strategy
Assessment Phase
Current State Analysis: Evaluate existing data visualization tools and identify gaps
Business Requirements: Document specific decisions that need data support
Technical Readiness: Assess data quality, infrastructure, and team capabilities
ROI Projections: Estimate potential value from improved decision-making
Selection Phase
Platform Evaluation: Compare best AI data visualization tools against requirements
Pilot Planning: Design focused tests that demonstrate value quickly
Vendor Assessment: Evaluate support, training, and long-term viability
Integration Planning: Ensure compatibility with existing systems
Implementation Phase
Phased Rollout: Start with high-impact, low-risk use cases
Training Program: Build organizational capacity for AI-powered data visualization tools
Change Management: Address cultural barriers to data-driven decision making
Continuous Optimization: Regular review and improvement of visualization strategies
Conclusion: Transform Your Data Into Competitive Advantage
The organizations thriving in 2025 have moved beyond viewing data as a reporting requirement to embracing AI tools for data visualization as a strategic asset. They understand that in a world where every company has access to similar technologies, competitive advantage comes from the ability to transform data into decisions faster than the competition.
Key takeaways for successful AI visualization implementation:
Start with business outcomes, not technology features — the best AI data visualization tools solve specific problems
Prioritize user adoption over technical sophistication — unused dashboards deliver zero ROI
Invest in organizational change management — technology alone doesn’t create data-driven cultures
Partner with experienced specialists — proven methodologies accelerate success while avoiding costly mistakes
Measure and optimize continuously — AI-powered data visualization tools improve through systematic refinement
The data visualization tools landscape has evolved from static reporting to intelligent, predictive analytics. Modern AI data visualization tools can understand natural language questions, automatically surface insights, and predict future trends — capabilities that seemed impossible just a few years ago.
However, technology is only part of the equation. The organizations achieving breakthrough results combine the best AI data visualization tools with strategic implementation, comprehensive training, and a commitment to data-driven decision making.
Transform your scattered data into strategic insights with proven AI tools for data visualization that drive measurable business outcomes. Whether you need help selecting the right platform, implementing advanced analytics, or training your team on AI data visualization tools, our specialists can guide you through every step of the transformation.
Discover how strategic data visualization services can accelerate your journey from data overwhelm to competitive advantage.
#data analytics consulting services#analytics consulting#data analytics consulting#data analytics consulting company#data analytics#data and analytics consultant#business intelligence consulting
0 notes
Text
The $3 Trillion Question: How AI-Powered Financial Services Data Analytics Are Preventing Financial Disasters

Financial institutions leveraging AI-powered financial services data analytics are reducing risk exposure by up to 60% while cutting compliance costs by $10+ billion annually. The question isn’t whether your institution can afford to invest in advanced financial analytics — it’s whether you can afford not to.
The financial services industry faces an unprecedented challenge: advanced analytics and AI will be crucial for strategic decision making in the financial services sector by 2025, yet many institutions still rely on outdated risk management systems that failed to predict recent bank collapses. The Silicon Valley Bank failure alone cost the industry $3.3 trillion in market value within days — a disaster that sophisticated financial services data analytics could have anticipated months in advance.
The Evolution from Reactive to Predictive Financial Analytics
Traditional banking relied on historical data and reactive measures. When warning signs appeared, it was often too late. Today’s leading financial institutions are fundamentally transforming their approach through financial data analytics solutions that predict, prevent, and protect rather than simply report what already happened.
Financial services organizations must simultaneously deal with an explosion of new data, increased disruption from startups and neo-banks, and increased demand for consumer centricity in their services. This convergence has created both unprecedented challenges and remarkable opportunities for institutions willing to embrace intelligent financial analytics.
Consider the transformation at JPMorgan Chase, where AI-powered analytics now process over 3.6 billion transactions daily, identifying potential fraud patterns in milliseconds. Their COIN (Contract Intelligence) platform analyzes legal documents that previously required 360,000 hours of lawyer time annually — completing the work in seconds with 85% greater accuracy.
Four Pillars of Modern Financial Services Data Analytics
1. AI-Powered Risk Management Analytics
Risk management analytics represents the cornerstone of financial stability. Modern systems don’t just monitor current exposures — they simulate thousands of potential market scenarios simultaneously, stress-testing portfolios against everything from interest rate fluctuations to geopolitical events.
Advanced financial data analytics solutions platforms now integrate:
Real-time fraud detection that analyzes transaction patterns across multiple dimensions, reducing false positives by 40% while catching 95% more fraudulent activities
Credit risk assessment using machine learning models that evaluate 10,000+ data points per application, including alternative data sources like social media behavior and utility payment histories
Stress scenario simulation that tests portfolio resilience under market conditions that haven’t occurred yet but could happen based on predictive modeling
Wells Fargo’s implementation of predictive risk analytics reduced their credit losses by $2.1 billion in 2024 alone, demonstrating the tangible impact of sophisticated financial analytics on bottom-line performance.
Ready to transform your risk management approach? Schedule a free financial analytics assessment to discover how AI-powered solutions can reduce your institution’s risk exposure by up to 60%.
2. Customer Intelligence Revolution
Banks and financial institutions will increasingly use these tools to streamline processes such as loan approvals, fraud detection and customer support. However, the real transformation lies in understanding customer behavior before customers understand it themselves.
Modern financial services analytics platforms create comprehensive customer intelligence by:
Behavioral pattern analysis that predicts life events (marriage, home purchase, career change) 6–12 months before they occur, enabling proactive product recommendations
Churn prediction models that identify at-risk customers with 87% accuracy up to 90 days before they leave, allowing targeted retention interventions
Lifetime value optimization that segments customers not just by current profitability but by predicted future value, revolutionizing marketing spend allocation
Bank of America’s Erica virtual assistant, powered by sophisticated customer analytics, now handles over 1 billion customer interactions annually while providing personalized financial guidance that increases customer engagement by 35%.
3. Regulatory Compliance Analytics
The trend of substantial and robust enforcement for AML failings within the financial services sector is likely to continue in 2025, making automated compliance not just advantageous but essential for survival.
Financial data analytics solutions now automate compliance through:
Automated reporting systems that reduce compliance costs by 60% while improving accuracy and completeness of regulatory submissions
Real-time monitoring that identifies potential violations before they occur, rather than discovering them during audits
Anomaly detection algorithms that flag unusual patterns in transactions, communications, or behaviors that might indicate compliance violations
HSBC’s investment in compliance analytics reduced their AML investigation time from weeks to hours while improving detection accuracy by 70%, preventing potential regulatory fines exceeding $500 million.
Struggling with compliance costs? Our data engineering services help financial institutions automate regulatory reporting and reduce compliance overhead by up to 60%.
4. Investment and Portfolio Analytics
AI and ML have transformed predictive analytics and forecasting in finance, enabling portfolio managers to make decisions based on insights that would be impossible for human analysts to generate manually.
Advanced financial analytics in investment management includes:
Portfolio optimization algorithms that continuously rebalance holdings based on real-time market conditions and predictive models
Market sentiment analysis that processes millions of news articles, social media posts, and economic indicators to predict market movements
ESG analytics integration that evaluates environmental, social, and governance factors as quantifiable risk and return drivers
BlackRock’s Aladdin platform processes over $21 trillion in assets using sophisticated analytics that combine traditional financial metrics with alternative data sources, generating insights that drive investment decisions across the global financial system.
Just like Pinnacle Fund Services, who partnered with SR Analytics to streamline investment analysis and reporting, leading fund management firms are discovering that AI financial services solutions provide the competitive edge needed in today’s fast-paced markets.
The 2025 Transformation: What’s Driving Urgency
Several converging trends make 2025 a inflection point for financial services data analytics:
Data Explosion: Every transaction, click, mention, comment, and interaction across mobile apps, kiosks, social media, and webpages is collected and analyzed, creating unprecedented opportunities for insight generation.
Regulatory Pressure: Financial institutions are increasingly under scrutiny as the third-party conduits for international payments linked to sanctions breaches, terrorist activities, or bribes to overseas officials, requiring more sophisticated monitoring capabilities.
Competitive Disruption: Digital transformation remains a driving force across the financial sector. In 2025, we expect to see accelerated adoption of generative AI and machine learning technologies, with institutions that fail to adapt losing market share rapidly.
Customer Expectations: Hyper-personalisation will also gain traction, with institutions leveraging advanced analytics and AI to deliver tailored financial products and services, making customer intelligence essential for retention and growth.
Implementation Strategy: From Vision to Value
Phase 1: Foundation Building (Months 1–3)
Start with financial data analytics infrastructure that can scale. Many institutions make the mistake of implementing point solutions that can’t integrate with broader systems. Focus on:
Data integration platforms that connect disparate systems without disrupting operations
Cloud-based analytics architecture that provides scalability and security
Governance frameworks that ensure data quality and regulatory compliance from day one
Phase 2: Advanced Analytics Deployment (Months 4–8)
Layer sophisticated financial services analytics capabilities on your foundation:
Machine learning models for risk assessment and fraud detection
Predictive analytics engines for customer behavior and market forecasting
Real-time monitoring systems for compliance and operational risk
Phase 3: AI-Powered Optimization (Months 9–12)
Deploy AI financial services solutions that provide competitive advantages:
Automated decision systems for loan approvals and investment recommendations
Intelligent customer service that provides personalized financial guidance
Dynamic risk management that adjusts strategies based on changing market conditions
Need a roadmap for your analytics transformation? Download our BI Implementation Guide 2025 for a step-by-step approach to successful financial services analytics deployment.
The Cost of Inaction
While implementing comprehensive financial services data analytics requires significant investment, the cost of inaction far exceeds implementation costs. Institutions without advanced analytics face:
Regulatory penalties averaging $2.8 billion annually across the industry
Customer churn rates are 40% higher than analytics-enabled competitors
Operational costs that are 25–35% higher due to manual processes
Credit losses that are 30–50% higher due to inadequate risk assessment
Your Next Steps: Building Analytics Excellence
The question isn’t whether to invest in financial data analytics solutions — it’s how quickly you can implement them effectively. Leading institutions are already leveraging these capabilities to gain significant competitive advantages.
Ready to transform your financial institution’s analytics capabilities? Our team of data analytics consultants specializes in implementing comprehensive financial services data analytics solutions that deliver measurable results within 90 days.
📊 Schedule Your Free Financial Analytics Assessment → Discover exactly how advanced analytics can reduce your risk exposure while improving operational efficiency.
#data analytics consulting services#analytics consulting#data analytics#data analytics consultant#data and analytics consultant#business intelligence services#data analytics consulting company#data analytics consulting#data and analytics consulting#business intelligence consulting
0 notes
Text
Transforming Pharmaceutical Supply Chains: How Advanced Analytics Delivered 320% ROI in 6 Months

Executive Summary
In today’s hyper-competitive pharmaceutical landscape, supply chain efficiency isn’t just about cost optimization — it’s about life-saving medication availability, regulatory compliance, and sustainable business growth. This detailed case study examines how SR Analytics partnered with a Fortune 500 pharmaceutical leader to completely transform their global supply chain operations through advanced supply chain analytics, delivering an extraordinary 320% return on investment within just six months.
The transformation journey involved implementing comprehensive supply chain analytics solutions across a complex network of over 100,000 trading partners, resulting in 25% operational cost reduction, 85% demand forecast accuracy, and $5.05 million in annual value creation. More importantly, it established a foundation for sustained competitive advantage in an increasingly complex global marketplace.
The $50 Billion Problem Facing Pharmaceutical Supply Chains
The pharmaceutical industry faces unprecedented supply chain challenges that cost the sector over $50 billion annually in inefficiencies. Recent McKinsey research confirms that pharmaceutical companies lose significant value due to outdated supply chain management approaches. Unlike traditional manufacturing, pharmaceutical supply chains must navigate stringent FDA regulations requiring comprehensive supply chain visibility, maintain product integrity across temperature-controlled environments, and ensure zero tolerance for stock-outs of life-critical medications.
Industry analysis reveals that 65% of pharmaceutical companies still rely on reactive, spreadsheet-based analytics for supply chain management. This approach creates significant blind spots in an industry where visibility and predictive capability can mean the difference between life and death for patients worldwide.
The Hidden Costs of Supply Chain Inefficiency
Our comprehensive analytics maturity assessment of pharmaceutical supply chain operations consistently reveals hidden cost drivers that executives often underestimate by 40–60%:
Inventory Carrying Costs: Pharmaceutical companies typically maintain 20–30% excess safety stock due to poor demand forecasting, tying up millions in working capital unnecessarily.
Emergency Expedite Fees: Reactive management leads to frequent expedited shipments, often costing 300–500% more than standard logistics rates.
Regulatory Compliance Risks: Manual processes increase the likelihood of documentation errors, potentially resulting in FDA violations costing millions in remediation and reputation damage.
Customer Service Impact: Stock-outs and delivery delays directly impact patient care and healthcare provider relationships, creating long-term revenue implications that extend far beyond immediate lost sales.
Client Profile: A Global Pharmaceutical Transformation Challenge
Our transformation journey began with a Fortune 500 pharmaceutical corporation operating across multiple continents with a complex ecosystem that included:
Multi-national manufacturing operations spanning India, the USA, and Canada
Distributed R&D centers across key global markets
100,000+ trading partners, including wholesalers, distributors, and retail pharmacy networks
Stringent regulatory requirements from the FDA, Health Canada, and international health authorities
Life-critical product portfolio requiring 99.99% availability standards
The organization generated over 50 terabytes of supply chain data monthly across multiple systems, yet leadership lacked real-time visibility into performance metrics that mattered most for strategic decision-making. Our specialized pharmaceutical supply chain solutions were designed to address these specific industry challenges.
Baseline Performance Assessment
Our initial assessment revealed performance gaps that were costing the organization millions annually:
65% demand forecast accuracy — significantly below industry best-practice benchmarks of 85%+
40 monthly stock-out incidents — directly impacting patient care and customer relationships
72-hour reporting cycles — preventing timely response to market changes and operational exceptions
15% cost premium — attributed to inefficient processes and poor supply chain visibility
Manual data processes — creating 30+ hours weekly of administrative overhead per facility
The Strategic Analytics Transformation Framework
Phase 1: Data Foundation and Architecture (Months 1–2)
Objective: Establish an enterprise-grade data infrastructure supporting real-time analytics
The transformation began with architecting a robust data foundation capable of handling the volume, velocity, and variety of pharmaceutical supply chain data. Our proven data analytics consulting methodology follows industry best practices established by MIT research to ensure rapid value realization. This included:
Enterprise Data Warehouse Implementation: Deployed scalable cloud-based architecture with 99.9% uptime guarantee, supporting real-time data processing from multiple source systems, including ERP, WMS, TMS, and external market data feeds.
Data Quality and Governance Framework: Established comprehensive data validation protocols with automated cleansing and standardization processes, ensuring consistent business definitions across all global operations.
Integration and Connectivity: Developed real-time data pipelines connecting disparate systems across manufacturing, distribution, and retail touchpoints, enabling sub-second latency for critical business processes.
Security and Compliance Protocol: Implemented pharmaceutical industry-specific security frameworks ensuring HIPAA compliance, FDA 21 CFR Part 11 validation, and international data privacy regulations.
Phase 2: Analytics Development and Deployment (Months 3–4)
Objective: Deploy core predictive analytics capabilities and business intelligence infrastructure
With the data foundation established, the focus shifted to developing sophisticated analytics capabilities tailored to pharmaceutical supply chain requirements:
Advanced Demand Forecasting Models: Implemented advanced demand forecasting capabilities using machine learning algorithms, incorporating multiple variables, including historical demand patterns, seasonal trends, market dynamics, physician prescribing behavior, and external economic indicators. Harvard Business Review research demonstrates that these advanced models achieved 85% forecast accuracy within 60 days of deployment.
Inventory Optimization Engine: Developed intelligent inventory optimization solutions with dynamic safety stock calculations based on demand variability, supplier lead time performance, and service level targets. The optimization algorithms balanced carrying costs with service requirements, reducing inventory investment by 25% while maintaining 99.5% availability.
Supplier Performance Analytics: Created comprehensive supplier scorecards measuring quality, delivery, cost, and risk performance across multiple dimensions. Real-time monitoring capabilities enabled proactive intervention before performance degraded to customer-impacting levels.
Executive Dashboard and Reporting Platform: Deployed our enterprise predictive analytics platform, providing role-based analytics interfaces with real-time visibility into key performance indicators, exception alerts, and predictive insights. Mobile accessibility ensured decision-making capability regardless of location.
Phase 3: Optimization and Enterprise Scaling (Months 5–6)
Objective: Maximize value realization and expand capabilities across global operations
The final phase focused on fine-tuning algorithms, expanding capabilities, and ensuring sustainable value delivery:
Machine Learning Model Refinement: Continuously optimized prediction algorithms based on actual performance data, improving forecast accuracy by an additional 5% beyond initial deployment targets.
Global Rollout and Standardization: Extended analytics capabilities to international subsidiaries and regional operations, ensuring consistent performance measurement and optimization opportunities worldwide.
Advanced Analytics Capability Expansion: Introduced scenario planning, what-if analysis, and predictive risk modeling capabilities supporting strategic planning and operational resilience.
Continuous Improvement Framework: Established ongoing optimization processes with quarterly performance reviews, algorithm updates, and capability enhancement roadmaps.
Transformational Business Results
Quantified Performance Improvements
The analytics transformation delivered measurable improvements across all critical supply chain performance indicators:
Demand Forecast Accuracy: Improved from 65% to 85%, representing a 31% enhancement in prediction capability that directly translated to reduced safety stock requirements and improved customer service levels.
Inventory Optimization: Achieved 25% reduction in inventory carrying costs while maintaining 99.5% product availability, freeing up $1.8 million in working capital for strategic reinvestment.
Operational Cost Reduction: Delivered 25% overall cost optimization through process automation, improved decision-making, and elimination of emergency expedited situations.
Lead Time Performance: Reduced average order fulfillment times from 15 days to 13.5 days, improving customer satisfaction and competitive positioning.
Service Level Achievement: Eliminated stock-out incidents for critical medications while reducing monthly disruptions from 40 to 30 incidents across all product categories.
Organizations can calculate their potential supply chain analytics ROI using our proprietary assessment tool, which incorporates Gartner’s analytics maturity framework for accurate baseline evaluation.
Financial Impact and Return on Investment
The transformation delivered exceptional financial returns that exceeded all initial projections:
320% Return on Investment achieved within the first 12 months, with a remarkable 2.9-month payback period demonstrating rapid value realization.
$5.05 Million Annual Value Creation broken down across multiple value drivers:
$2.3 million in direct operational cost savings through process optimization and automation
$1.8 million in inventory optimization benefits reducing working capital requirements
$950,000 in process efficiency gains eliminating manual overhead and reducing error rates
Strategic Value Drivers extending beyond immediate financial benefits:
Enhanced decision-making capability reducing time-to-market for new product launches
Improved supplier relationships through data-driven performance management
Strengthened regulatory compliance with automated documentation and audit trails
Increased organizational agility enabling rapid response to market changes and disruptions
Strategic Organizational Transformation
Building Data-Driven Decision Culture
Beyond operational improvements, the analytics transformation fundamentally changed how the organization approached decision-making at all levels. Key cultural shifts included:
Evidence-Based Strategic Planning: Executive leadership now relies on predictive analytics and scenario modeling for strategic decisions, replacing intuition-based approaches with data-driven insights.
Proactive Exception Management: Operations teams shifted from reactive firefighting to proactive identification and resolution of potential issues before they impact customers.
Cross-Functional Collaboration: Shared analytics platforms broke down organizational silos, enabling procurement, manufacturing, distribution, and sales teams to work from common performance metrics and objectives.
Continuous Improvement Mindset: Regular performance reviews and optimization opportunities became embedded in daily operations, creating a culture of ongoing enhancement rather than periodic transformation projects.
Competitive Advantage Development
The analytics capabilities created sustainable competitive advantages that continue delivering value:
Market Responsiveness: Real-time visibility and predictive capabilities enable rapid response to market changes, regulatory updates, and competitive threats.
Operational Excellence: Consistent performance across global operations with standardized processes and metrics supporting scalable growth and expansion opportunities.
Innovation Platform: The data foundation and analytics capabilities provide infrastructure for future technology adoption including artificial intelligence, IoT integration, and advanced automation.
Risk Resilience: Predictive risk modeling and scenario planning capabilities enhance organizational ability to navigate disruptions and maintain business continuity.
Future-Ready Innovation Roadmap
Next-Generation Technology Integration
Building on this transformational foundation, the organization is implementing advanced capabilities that will maintain competitive advantage:
Artificial Intelligence and Machine Learning Enhancement: Deploying cognitive analytics for natural language insights, autonomous optimization algorithms, and self-learning models that continuously improve without human intervention.
Internet of Things (IoT) Integration: Implementing sensor-based monitoring for real-time product condition tracking, predictive maintenance capabilities, and automated compliance documentation.
Digital Twin Development: Creating virtual representations of the entire supply chain for risk-free scenario testing, optimization modeling, and strategic planning support.
Sustainability and ESG Analytics: Integrating environmental impact measurement, carbon footprint optimization, and circular economy principles into supply chain decision-making processes.
Strategic Recommendations for Pharmaceutical Leaders
Based on our extensive experience transforming pharmaceutical supply chains, we recommend a strategic approach focused on four critical imperatives:
1. Establish Robust Data Foundation Architecture
Begin with enterprise-grade data infrastructure that can scale with business growth and technology evolution. This includes implementing comprehensive data governance, ensuring real-time integration capabilities, and establishing security frameworks that meet pharmaceutical industry requirements.
2. Embrace Predictive Analytics Capabilities
Move beyond descriptive reporting to predictive and prescriptive analytics that enable proactive decision-making. Focus on demand forecasting, inventory optimization, and risk management as foundation capabilities before expanding to more advanced applications.
3. Build Organizational Analytics Capability
Invest in training and change management to create a data-driven decision culture. Implement self-service analytics capabilities that empower business users while maintaining governance and quality standards.
4. Plan for Future Technology Integration
Design a flexible architecture that can accommodate emerging technologies, including AI, IoT, and automation. Establish innovation partnerships and technology roadmaps that align with business strategy and market evolution.
Client Success Story
Our transformation success is best captured in this testimonial from the project’s executive sponsor:
“The supply chain analytics transformation delivered by SR Analytics exceeded our expectations in every dimension. We achieved 25% cost optimization and 320% ROI in the first year alone, while building organizational capabilities that continue delivering value. Their expertise in supply chain and data analytics is unmatched in our industry, and their partnership approach ensured seamless implementation with minimal operational disruption.”
— Chief Supply Chain Officer, Fortune 500 Pharmaceutical Corporation
Read more client success stories to understand the transformational impact of our supply chain analytics consulting services.
Conclusion: The Imperative for Supply Chain Analytics Transformation
The pharmaceutical industry stands at an inflection point where traditional supply chain management approaches are insufficient for competitive success. Organizations that embrace advanced analytics capabilities will achieve sustainable advantages in cost, service, and risk management, while those that delay transformation risk falling further behind industry leaders.
This case study demonstrates that supply chain analytics transformation is not just possible — it’s essential for pharmaceutical companies seeking to optimize operations, ensure regulatory compliance, and maintain competitive positioning in an increasingly complex global marketplace.
The 320% ROI achieved by our client represents more than financial success; it demonstrates the transformational power of data-driven decision-making in creating operational excellence, improving patient outcomes, and building sustainable competitive advantage.
For pharmaceutical leaders evaluating supply chain transformation opportunities, the question isn’t whether to implement advanced analytics — it’s how quickly you can begin the journey toward data-driven operational excellence.
Explore additional transformation success stories to understand how other industry leaders have achieved similar results through strategic analytics implementation.
#analytics consulting#data analytics consulting services#data analytics consulting company#data analytics consultant#business intelligence services#data and analytics consulting#data analytics consulting#data analytics#data and analytics consultant#business intelligence consulting
0 notes
Text
Healthcare Analytics 2025: How Data-Driven Solutions Are Revolutionizing Patient Care and Delivering 451% ROI

Healthcare organizations worldwide are experiencing a data revolution that’s transforming patient care and operational efficiency. With 90% of hospitals expected to use AI technology for early diagnosis and remote monitoring by 2025, the healthcare analytics landscape has reached a critical inflection point where data-driven insights are no longer optional — they’re essential for survival and growth.
Recent developments in healthcare analytics demonstrate remarkable returns on investment. The introduction of an AI platform into hospital radiology workflow resulted in labor time reductions and a delivery of ROI of 451% over 5 years, showcasing the transformative potential of well-implemented analytics solutions.
Ready to Transform Your Healthcare Operations? Discover how data analytics consulting can boost your organization’s profitability by 27% while improving patient outcomes.
The Current State of Healthcare Analytics: Real-World Impact and Market Growth
The healthcare analytics market is experiencing unprecedented growth, driven by urgent needs for operational efficiency and improved patient outcomes. Analytics and AI trends in healthcare are primed to shake up the industry in 2025. By prioritizing data quality, governance and high-value use cases, health systems can more effectively navigate the ever-shifting digital health landscape.
This growth translates into tangible results for healthcare organizations. A 35% drop in hospital readmissions and a 30% decline in patient mortality rates, all thanks to predictive analytics, demonstrate the life-saving potential of data-driven healthcare solutions.
Healthcare organizations are becoming more strategic in their approach to analytics adoption. In 2025, we expect healthcare organizations to have more risk tolerance for AI initiatives, which will lead to increased adoption. However, they will also be intentional about using solutions that meet a business need and bring ROI in terms of increased efficiency or cost savings.
Key Market Trends Shaping 2025
The healthcare analytics transformation is accelerating across multiple dimensions:
Predictive Analytics Leadership: Healthcare organizations are moving beyond reactive reporting to predictive insights that prevent complications before they occur. Advanced machine learning algorithms analyze patient vitals, lab results, and medical histories to identify high-risk patients and recommend proactive interventions.
AI-Powered Clinical Decision Support: Modern healthcare analytics platforms provide real-time, evidence-based recommendations at the point of care. These systems compare patient data against clinical guidelines and best practices, alerting providers to potential drug interactions, diagnostic opportunities, and treatment modifications.
Operational Excellence: Analytics solutions are optimizing hospital workflows, from predicting patient volumes for capacity planning to analyzing supply chain patterns for cost reduction. Organizations are using data to eliminate bottlenecks, reduce waste, and improve resource allocation , similar to how our operational efficiency solutions help hospitals connect different systems to create complete operational views.
Strategic Implementation: Building Healthcare Analytics Capabilities That Drive Results
Data Integration: The Foundation of Effective Healthcare Analytics
Healthcare organizations typically store critical information across multiple systems — electronic health records, laboratory information systems, radiology platforms, and administrative databases. Successful analytics implementations require breaking down these data silos to create unified, comprehensive views of patient information and operational metrics.
Modern healthcare data solutions employ cloud-based architectures that can scale to handle massive volumes of healthcare data while maintaining strict security and privacy standards. These platforms use advanced integration techniques to combine structured database information with unstructured data from clinical notes, medical images, and patient communications.
Best Practice: Start with high-impact, well-defined use cases that demonstrate clear value while building foundational data integration capabilities. Organizations that focus on specific problems — such as readmission prediction or length-of-stay optimization — typically see faster time-to-value and stronger stakeholder support.
Just as we help businesses with embedded analytics to place powerful insights directly into existing applications, healthcare organizations need analytics solutions that integrate seamlessly with their current workflows without disrupting patient care.
Privacy and Security: Enabling Innovation While Protecting Patients
Healthcare analytics must comply with strict regulatory requirements including HIPAA, while enabling legitimate analytical use cases that improve patient care. Organizations are implementing privacy-preserving analytics techniques, such as differential privacy and federated learning, that allow insights to be derived from sensitive data without exposing individual patient information.
Emerging Trend: Multi-institutional collaborative analytics projects are becoming more common, where healthcare organizations share insights and model performance without sharing raw patient data. These approaches enable more robust analytics models by accessing larger, more diverse datasets.
Need Help with Data Governance? Learn how proper data visualization best practices can improve your healthcare insights while maintaining compliance and security standards.
High-Impact Use Cases: Where Healthcare Analytics Delivers Maximum Value
Clinical Decision Support and Patient Safety
Healthcare analytics excels in supporting clinical decision-making through real-time analysis of patient data. Advanced systems analyze patterns in vital signs, laboratory values, and clinical documentation to predict patient deterioration, identify sepsis risk, and recommend optimal treatment pathways.
Real-World Example: Massachusetts General Hospital (MGH) implemented analytics solutions that continuously monitor patient data streams to identify signs of clinical deterioration hours before traditional methods would detect problems. These systems have reduced unexpected intensive care unit transfers by 30–40% and improved patient safety outcomes.
Revenue Cycle Optimization and Financial Performance
Healthcare organizations face increasing pressure to optimize financial performance while maintaining high-quality patient care. Analytics solutions help identify billing inefficiencies, reduce claim denials, and accelerate payment collection.
Key Application Areas:
Denial Management: Predictive models identify claims most likely to be denied, enabling proactive corrections that reduce rejection rates by 25–35%
Pricing Optimization: Dynamic pricing strategies based on payer mix, patient demographics, and market conditions
Contract Analysis: Data-driven insights for negotiating better terms with insurance providers and suppliers
Similar to how our fraud detection and risk management solutions help organizations spot suspicious activity in real-time, healthcare revenue cycle analytics can identify billing anomalies and prevent revenue leakage before it impacts the bottom line.
Operational Efficiency and Resource Optimization
Healthcare operations generate enormous amounts of data that can be analyzed to improve efficiency and reduce costs. Analytics applications include capacity planning, supply chain optimization, and workflow analysis.
Capacity Planning: Predictive models forecast patient volumes and resource needs, enabling hospitals to optimize staffing levels and equipment utilization. Organizations using advanced capacity planning report 15–20% improvements in resource utilization while reducing patient wait times.
Supply Chain Analytics: Analyzing consumption patterns and supplier performance to reduce costs and prevent stockouts. Healthcare organizations can optimize inventory levels, negotiate better supplier contracts, and identify cost reduction opportunities worth millions of dollars annually.
Our approach to demand forecasting helps organizations predict future needs with remarkable accuracy by finding patterns in historical data — the same principle applies to healthcare resource planning and patient volume prediction.
Technology Stack: Modern Healthcare Analytics Platforms
AI and Machine Learning Integration
In 2025, the adoption of AI in healthcare will advance significantly, bringing more sophisticated applications in predictive analytics, personalized medicine, and clinical decision support. Healthcare organizations are implementing comprehensive AI platforms that combine multiple analytical capabilities:
Natural Language Processing (NLP): Extracting insights from unstructured clinical notes, radiology reports, and patient communications. NLP enables analysis of vast amounts of textual data that previously remained untapped, improving clinical decision-making and operational insights.
Computer Vision: Analyzing medical images to assist with diagnosis and treatment planning. AI algorithms now detect abnormalities in X-rays, MRIs, and CT scans with accuracy matching or exceeding human specialists in specific applications.
Predictive Modeling: Using historical and real-time data to forecast patient outcomes, resource needs, and operational challenges. These models enable proactive interventions that improve patient care while reducing costs.
Cloud-Based Analytics Platforms
Modern healthcare analytics requires a scalable, secure cloud infrastructure that can handle massive data volumes while maintaining performance and reliability. Leading platforms offer:
Real-time Processing: Immediate analysis of streaming patient data for early warning systems and clinical decision support
Scalable Storage: Cost-effective storage solutions for massive healthcare datasets, including medical images and genomic data
Advanced Security: Multi-layered security approaches including encryption, access controls, and audit logging
Just as our technology stack brings together the best partner solutions to help businesses gain a competitive edge, healthcare organizations need integrated platforms that can scale with their growing data needs.
Transform Your Healthcare Data Infrastructure Our team specializes in implementing scalable analytics solutions that grow with your organization. Schedule a free healthcare analytics assessment to discover your biggest opportunities for improvement.
Real-Time Success Story: CareJourney’s 451% ROI Implementation
Real Time Medical Systems partnered with CareJourney to implement analytics solutions that identified ACOs and health systems for partnership outreach. By having data tailored to specific prospective ACOs, Real Time was able to approach partnership conversations armed with performance data about prospective organizations.
This implementation demonstrates the power of targeted healthcare analytics:
Investment: $150,000-$500,000 initial deployment
Timeline: 90-day implementation
Results: 451% return over 5 years, with radiologist time savings increasing to 791% when comprehensive implementation strategies are followed
Impact: Improved partnership negotiations and operational efficiency
Source: Healthcare AI Implementation: $2.4M ROI Blueprint for Medical Organizations
Measuring Success: ROI Metrics and Performance Indicators
Financial Impact Measurement
Healthcare analytics delivers measurable financial benefits through multiple channels:
Cost Reduction: Organizations report 15–25% reductions in operational expenses through improved efficiency, reduced waste, and optimized resource utilization. Analytics helps identify cost-saving opportunities without compromising patient care quality.
Revenue Enhancement: Improved billing accuracy, reduced claim denials, and optimized pricing strategies typically increase revenue by 8–15%. Analytics solutions help capture revenue that might otherwise be lost due to billing errors or suboptimal pricing decisions.
Risk Mitigation: Better prediction and prevention of adverse events, reducing financial exposure from malpractice claims and regulatory penalties. Organizations with mature analytics programs report 20–30% reductions in preventable adverse events.
Clinical Outcome Improvements
The ultimate goal of healthcare analytics is improving patient care and clinical outcomes:
Patient Safety: Reduced medical errors, hospital-acquired infections, and other adverse events through predictive monitoring and early intervention systems.
Quality of Care: Improved adherence to clinical guidelines, reduced variation in care delivery, and better patient outcomes across all service lines.
Patient Experience: Enhanced satisfaction through reduced wait times, better communication, and more personalized care approaches informed by data insights.
Implementation Strategy: Your Roadmap to Healthcare Analytics Success
Phase 1: Assessment and Foundation Building (Months 1–3)
Begin with a comprehensive assessment of current data assets, technical infrastructure, and organizational readiness. Identify high-priority use cases that align with strategic objectives and offer clear value propositions.
Key Activities:
Data inventory and quality assessment
Technology infrastructure evaluation
Stakeholder alignment and use case prioritization
Initial team formation and skill assessment
Phase 2: Pilot Project Implementation (Months 4–9)
Launch focused pilot projects that demonstrate analytics value while building organizational confidence and capabilities. Choose initiatives with well-defined success metrics and strong leadership support.
Recommended Pilot Areas:
Readmission risk prediction for specific patient populations
Length of stay optimization for high-volume service lines
Clinical decision support for common conditions
Revenue cycle analytics for claim denial reduction
Phase 3: Scale and Expansion (Months 10–18)
Based on pilot project success, expand analytics capabilities across additional use cases and departments. Focus on integration, standardization, and building sustainable analytics operations.
Growth Areas:
Population health analytics for preventive care programs
Advanced operational analytics for system-wide optimization
Collaborative analytics partnerships with other healthcare organizations
Real-time analytics for immediate decision support
Ready to Start Your Healthcare Analytics Journey? Our proven three-phase implementation methodology has helped organizations achieve measurable results. Learn more about our data analytics consulting approach and how we can accelerate your time-to-value.
Future Trends: What’s Next for Healthcare Analytics
Generative AI and Advanced Analytics
In 2025, genAI proof-of-concepts and pilot programs will start to demonstrate positive impact and value for healthcare organizations, which will begin to explore how they can defer new or sunset existing product investments by doing it themselves. Healthcare organizations are exploring generative AI applications for clinical documentation, patient communication, and decision support.
Real-Time Analytics and Edge Computing
The shift toward real-time healthcare analytics is accelerating, driven by needs for immediate clinical insights and operational responsiveness. Edge computing brings analytics capabilities closer to the point of care, enabling instant analysis without cloud processing latency.
Personalized Medicine and Precision Analytics
Healthcare analytics is evolving toward highly personalized insights that account for individual patient characteristics, genetic factors, and environmental influences. This precision approach promises improved treatment effectiveness while reducing side effects and costs.
Getting Started: Your Next Steps
Healthcare organizations ready to begin their analytics transformation should focus on three critical success factors:
1. Start with Clear Business Objectives: Identify specific problems that analytics can solve and define measurable success criteria. Organizations with well-defined objectives achieve faster time-to-value and stronger ROI.
2. Invest in Both Technology and People: Successful analytics implementations require both advanced technology platforms and skilled personnel who understand healthcare and data science. Consider partnerships with experienced consulting firms to accelerate capability development.
3. Prioritize Data Quality and Governance: Implement robust data governance practices from the beginning. Poor data quality undermines analytics effectiveness and can lead to incorrect insights that harm patient care.
Conclusion: The Strategic Imperative of Healthcare Analytics
The evidence is overwhelming: healthcare organizations that successfully implement analytics solutions gain significant competitive advantages through improved patient outcomes, operational efficiency, and financial performance. With documented ROI reaching 451% and clinical improvements including 35% reductions in readmissions, healthcare analytics has moved from experimental technology to a business imperative.
Key Takeaways:
Healthcare analytics delivers proven ROI of up to 451% with comprehensive implementation strategies
Organizations report 15–25% operational cost reductions and 8–15% revenue increases
Real-time predictive analytics can reduce patient mortality rates by 30% and readmissions by 35%
Successful implementations require strategic planning, quality data governance, and experienced partners
Healthcare leaders face a critical decision: invest in analytics capabilities now to capture competitive advantages and improve patient care, or risk falling behind in an increasingly data-driven healthcare landscape. The organizations that act decisively to build comprehensive analytics strategies will be best positioned to thrive in the evolving healthcare environment.
Transform Your Healthcare Organization Today
Don’t let valuable healthcare data remain untapped while competitors gain analytical advantages. The time for analytics transformation is now — every day of delay represents missed opportunities to improve patient outcomes and optimize operations.
🚀 Take Action Today:
Schedule Your Free Healthcare Analytics Assessment Discover your organization’s biggest opportunities for improvement and develop a customized roadmap for success. Our healthcare-specific expertise will help you navigate complexities while achieving rapid time-to-value.
Explore Our Healthcare Analytics Solutions Learn how our proven methodologies in operational efficiency, predictive analytics, and embedded solutions can transform your organization’s performance.
Read More Success Stories Discover how organizations like yours have achieved measurable results with data-driven strategies.
Meet Our Healthcare Analytics Team Connect with experienced professionals who understand both healthcare operations and advanced analytics implementation.
#analytics consulting#data analytics consultant#data analytics consulting services#data analytics consulting company#data and analytics consultant#business intelligence consulting#data analytics#data and analytics consulting#data analytics consulting#business intelligence services
0 notes
Text
The Evolution of CPG Retail Analytics: How Data is Reshaping Consumer Goods in 2025

Picture this: It’s 1930, and Procter & Gamble employees are walking door-to-door, clipboards in hand, asking housewives about their laundry habits. Fast-forward to today, and CPG companies are using artificial intelligence to predict what you’ll buy before you even know you want it.
The transformation of the retail and CPG industry has been nothing short of remarkable. What started as simple market research has evolved into sophisticated CPG retail analytics trends that are reshaping how brands understand, reach, and serve consumers.
But here’s the thing — this evolution isn’t just about having more data. It’s about survival in an increasingly competitive landscape where understanding your customer isn’t just an advantage; it’s essential.
Why CPG Companies Can’t Ignore Analytics Anymore
The pandemic changed everything for consumer goods companies. While sales initially surged as people stockpiled essentials, the post-pandemic reality has been sobering. CPG industry trends now show muted growth, increased competition from private labels, and consumers who are more price-conscious than ever.
Take the recent acquisition by Interpublic Group, which bought retail analytics company Intelligence Node for nearly $100 million in 2024. This wasn’t just a business deal — it was a clear signal that companies are betting their futures on data analytics capabilities.
The numbers tell the story: companies without robust CPG analytics solutions are finding themselves playing catch-up in a market where agility and insight drive success.
Understanding CPG Retail Analytics: Beyond the Buzzwords
Let’s cut through the jargon. CPG retail analytics is fundamentally about turning the chaos of consumer data into clear, actionable insights. It’s the difference between guessing what your customers want and knowing what they need before they do.
Here’s what makes modern CPG analytics different from the clipboard-wielding researchers of the 1930s:
Real-time Decision Making: Today’s cpg retail analytics trends emphasize immediate insights. When Nestlé saw their e-commerce sales jump 9.2% in 2023, it wasn’t luck — it was their end-to-end analytics platform optimizing product recommendations in real-time.
Predictive Intelligence: Companies aren’t just looking at what happened; they’re predicting what will happen. This shift represents one of the most significant cpg industry trends we’re seeing today.
Integrated Data Ecosystems: Modern analytics pulls from everywhere — point-of-sale systems, social media, supply chains, even weather patterns. It’s this holistic view that separates leaders from laggards.
The Data Sources Driving CPG Success
Understanding where your data comes from is crucial for implementing effective cpg analytics solutions. Let me walk you through the key sources that matter:
Point-of-Sale Data: The Foundation of Truth
Every beep at the checkout counter is a vote. POS data eliminates guesswork by showing exactly what customers are buying, when, and where. Smart CPG companies break this down by region, SKU, time of day, and pricing to gain a comprehensive understanding of the full picture.
Consumer Panels: The “Why” Behind the Purchase
While POS data reveals what people buy, consumer panels show why they make these purchases. This longitudinal data tracks the same consumers over time, uncovering patterns that drive brand loyalty and switching behavior.
E-commerce Analytics: The Digital Window
Every click tells a story. High page views but low conversions might indicate delivery concerns or unclear product information. This data is becoming increasingly crucial as digital channels continue to grow.
Supply Chain Intelligence
This is where spend analytics IT solutions for CPG companies shine. By integrating procurement, production, and distribution data, companies can optimize operations while reducing costs and minimizing waste.
Real-World Success Stories: Analytics in Action
Let’s look at how leading companies are leveraging AI in CPG industry applications:
Spotify’s Wrapped Campaign: While not traditional CPG, Spotify’s data-driven personalization shows the power of analytics. Their 2024 Wrapped campaign used AI to create personalized playlists, driving massive user engagement and brand loyalty.
Colgate-Palmolive’s Digital Twins: In December 2024, Colgate used digital twin technology and analytics to test new products virtually before market launch. This approach reduced development costs while improving success rates.
PepsiCo’s Data Partnership: The company is sharing its data with retailers in exchange for shopper basket insights, creating a collaborative analytics ecosystem that benefits everyone.
These success stories highlight a crucial trend: companies are moving beyond basic reporting to sophisticated Power BI KPIs that track real-time performance across multiple channels. According to Microsoft’s 2024 Data Culture report, organizations using advanced business KPIs in their analytics platforms see 23% faster decision-making and 19% improvement in customer satisfaction scores.
The Technology Stack Behind Modern CPG Analytics
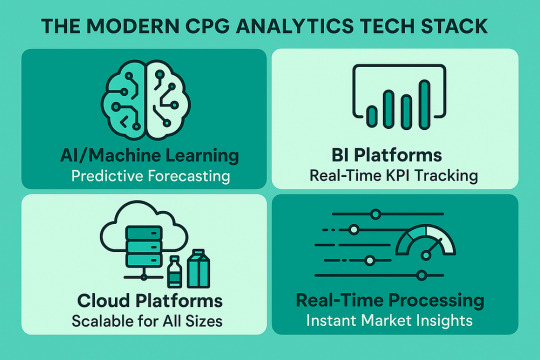
Machine Learning and AI: These technologies power predictive analytics, demand forecasting, and personalization engines. The AI in CPG industry is moving beyond basic automation to true intelligence.
Business Intelligence Platforms: Tools like Power BI are revolutionizing how CPG companies visualize and interact with their data. Modern Power BI KPI dashboards enable executives to monitor everything from supply chain efficiency to marketing campaign ROI in real-time. The power bi kpi visual capabilities have become essential for tracking business kpis across complex CPG operations.
Cloud-Based Platforms: Scalable computing power makes advanced analytics accessible to companies of all sizes, not just Fortune 500 giants. According to Gartner’s 2024 Analytics and BI Platform report, cloud-based analytics adoption in CPG increased by 47% in 2024.
Real-Time Processing: Modern systems can process and analyze data as it’s generated, enabling immediate responses to market changes. This real-time capability is crucial for KPI metrics that need constant monitoring, such as inventory turnover and customer satisfaction scores.
Building Your CPG Analytics Dashboard: Essential KPIs to Track
Creating effective cpg analytics solutions requires focusing on the business kpis that truly drive performance. Here are the critical metrics every CPG company should monitor:
Revenue and Profitability KPIs
Sales Growth Rate: Track month-over-month and year-over-year growth
Gross Margin by Product Line: Identify your most profitable products
Customer Lifetime Value (CLV): Understand long-term customer worth
Operational Excellence KPIs
Inventory Turnover: Optimize stock levels and reduce carrying costs
Order Fill Rate: Measure supply chain efficiency
Time to Market: Track new product development speed
Marketing Performance KPIs
Marketing ROI: Measure campaign effectiveness across channels
Brand Awareness: Track unaided and aided brand recognition
Customer Acquisition Cost (CAC): Optimize marketing spend efficiency
The key to successful KPI in Power BI implementation is choosing metrics that align with your strategic objectives. Research from McKinsey’s 2024 CPG Analytics study shows that companies using focused KPI visual in Power BI dashboards make decisions 40% faster than those relying on traditional reporting methods.
Current CPG Retail Analytics Trends Shaping 2025

1. Sustainability Analytics
Consumers increasingly care about environmental impact. Analytics help companies track and optimize their sustainability metrics while meeting consumer demands for eco-friendly products.
2. Personalization at Scale
The expectation for personalized experiences extends beyond digital into physical retail. Analytics make it possible to deliver relevant experiences across all touchpoints.
3. Supply Chain Resilience
Recent global disruptions have made supply chain visibility critical. Spend analytics IT solutions for CPG companies now focus heavily on risk mitigation and alternative sourcing strategies.
4. Direct-to-Consumer Growth
Traditional retail channels are being supplemented (and sometimes replaced) by DTC models, requiring new analytics approaches to understand and optimize these relationships.
Implementing CPG Analytics: A Practical Roadmap
For companies looking to enhance their cpg analytics solutions, here’s a practical approach:
Invest in the Right Analytics Platform: Choose platforms that can scale with your business. Whether you’re implementing Power BI KPIs for the first time or upgrading existing systems, ensure your platform can handle growing data volumes and complexity.
Focus on Business Impact: Don’t get caught up in fancy technology. Start with analytics that directly impact your bottom line — demand forecasting, inventory optimization, or customer segmentation. Use KPI metrics that align with your strategic objectives rather than vanity metrics that look impressive but don’t drive decisions.
Build Cross-Functional Teams: Successful analytics implementations require collaboration between IT, marketing, supply chain, and finance teams. Break down silos early.
Invest in Talent and Training: The retail and CPG industry is experiencing a talent shortage in analytics. Invest in training existing employees while recruiting specialized talent.
Overcoming Common Analytics Challenges
Every company implementing cpg retail analytics faces similar hurdles:
Data Silos: Information trapped in departmental systems limits insight potential. Breaking down these silos is often more about culture than technology.
Skills Gap: Finding people who understand both analytics and the CPG business is challenging. Consider partnerships with specialized providers while building internal capabilities.
ROI Measurement: Proving the value of analytics investments can be difficult. Establish clear metrics and success criteria upfront.
The Future of CPG Analytics: What’s Coming Next
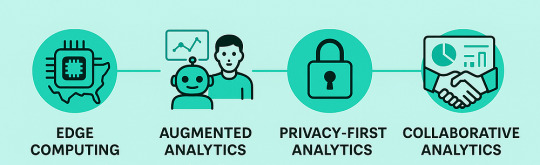
Edge Computing: Processing data closer to where it’s generated will enable even faster insights and responses.
Augmented Analytics: AI will increasingly assist human analysts, making advanced analytics more accessible to non-technical users.
Privacy-First Analytics: With increasing privacy regulations, analytics solutions will need to deliver insights while protecting consumer privacy.
Collaborative Analytics: Expect more data-sharing partnerships between CPG companies, retailers, and technology providers.
Making Analytics Work for Your Organization
The most successful cpg analytics solutions share common characteristics:
They’re business-driven, not technology-driven. The best analytics programs start with business questions, not available data.
They’re integrated across the organization. Analytics isn’t an IT project — it’s a business transformation that requires commitment from all levels.
They’re iterative. Start small, prove value, then scale. Don’t try to build the perfect system from day one.
The Bottom Line: Analytics as Competitive Advantage
The retail and CPG industry has always been competitive, but today’s market requires a new level of sophistication. Companies that master cpg retail analytics trends will capture market share from those that don’t.
The good news? The technology is more accessible than ever. Cloud platforms, pre-built analytics solutions, and specialized service providers make advanced analytics achievable for companies of all sizes.
The question isn’t whether you can afford to invest in cpg analytics solutions — it’s whether you can afford not to.
As we move deeper into 2025, the companies that thrive will be those that view analytics not as a cost center but as the engine driving their competitive advantage. The AI in CPG industry is no longer a future possibility — it’s today’s reality.
Whether you’re optimizing supply chains, personalizing customer experiences, or identifying new product opportunities, the power of cpg retail analytics is waiting to be unleashed. The only question is: are you ready to embrace it?
Transform Your CPG Analytics Strategy with Expert Guidance
Implementing effective cpg analytics solutions requires more than just technology — it requires strategic thinking, domain expertise, and the right partnership. At SR Analytics, we specialize in helping CPG companies unlock the full potential of their data through tailored analytics solutions.
Our expertise spans the entire analytics spectrum, from foundational business intelligence strategy to advanced AI-driven analytics services. We understand that every CPG company faces unique challenges, whether you’re a multinational corporation or an emerging brand.
#data analytics consulting services#data analytics consulting company#data analytics#data and analytics consultant#data analytics consultant#business intelligence services#data and analytics consulting
0 notes
Text
Sales and Marketing Analytics: Your Complete Guide to Data-Driven Success

Highlights
78% of organizations now use AI in marketing and sales functions, with data-driven companies 23x more likely to acquire customers than intuition-based competitors.
Sales and marketing analytics unify fragmented data from CRM, web analytics, social media, and advertising platforms into actionable insights.
Advanced analytics implementations typically deliver 5–8% higher marketing ROI while reducing customer acquisition costs by up to 30%.
Modern analytics platforms enable real-time campaign optimization, predictive customer segmentation, and automated performance tracking.
Companies using integrated sales and marketing analytics see 20% faster sales cycles and 15% higher deal closure rates.
Introduction
In today’s hyper-competitive business landscape, the gap between market leaders and followers often comes down to one critical factor: how effectively they leverage their sales and marketing data.
According to McKinsey’s latest research, 78% of organizations now use AI in at least one business function, with marketing and sales leading adoption. Yet despite this widespread implementation, many companies still struggle to translate their data into meaningful business outcomes.
The challenge isn’t a lack of data — it’s the ability to transform scattered information into strategic advantages.
Whether you’re tracking website conversions in Google Analytics, monitoring email campaign performance, or analyzing sales pipeline metrics in your CRM, the real value lies in connecting these data points to reveal the complete customer journey and optimize every touchpoint.
Sales and marketing analytics isn’t just about generating reports. It’s about creating a unified view of your revenue engine that enables smarter decisions, faster growth, and more predictable outcomes. In this comprehensive guide, we’ll explore how modern businesses are using advanced analytics to drive measurable ROI and sustainable competitive advantages.
What Are Sales and Marketing Analytics?
Sales and marketing analytics encompass the systematic collection, measurement, and analysis of data from all customer-facing activities to optimize performance and drive revenue growth. Unlike traditional reporting that simply shows what happened, modern analytics reveal why it happened and what’s likely to happen next.
Core Components of Sales and Marketing Analytics:
Data Integration and Unification Modern analytics platforms connect disparate data sources — from CRM systems like Salesforce and HubSpot to marketing automation tools, social media platforms, and web analytics — creating a single source of truth for customer interactions.
Customer Journey Mapping Advanced analytics track each touchpoint in the customer journey, from initial awareness through post-purchase engagement, revealing which interactions drive conversions and which create friction.
Predictive Modeling Using historical data and machine learning algorithms, these systems forecast future trends, identify high-value prospects, and predict customer lifetime value with increasing accuracy.
Real-Time Performance Monitoring Interactive dashboards provide instant visibility into campaign performance, sales metrics, and customer behavior, enabling rapid optimization and course correction.
The integration of sales and marketing analytics creates powerful synergies that benefit both teams. Marketing gains insight into which campaigns generate qualified leads that convert to revenue, while sales teams receive enriched prospect data and behavioral insights that improve closing rates.
The Evolution of Marketing Data Analytics

From Reactive to Predictive Analytics
Traditional marketing analytics focused primarily on historical reporting — measuring what happened after campaigns ended. Today’s advanced systems flip this approach, using predictive analytics to forecast outcomes and optimize campaigns in real-time.
Recent HubSpot research shows that 30.55% of marketers say data helps determine their most effective marketing strategies, 29.59% report it improves ROI, and 27.36% say it helps reach target audiences more effectively.
The Rise of Customer-Centric Analytics
Modern marketing analytics platforms have shifted from channel-centric to customer-centric measurement. Instead of analyzing email, social media, and paid advertising in isolation, today’s systems track individual customer journeys across all touchpoints.
This evolution enables sophisticated attribution modeling that reveals the true impact of each marketing interaction. Companies can now identify which blog posts influence purchase decisions weeks later, or how social media engagement correlates with email conversion rates.
Integration with Sales Analytics
The most significant advancement has been the integration of marketing and sales analytics into unified revenue operations platforms. This convergence eliminates the traditional handoff friction between marketing-qualified leads and sales-accepted leads.
Gartner research indicates that 60% of B2B sales organizations will transition from experience-based to data-driven selling by 2025, making this integration critical for competitive advantage.
Essential Sales Analytics Tools and Techniques
Sales analytics tools have evolved beyond basic CRM reporting to encompass predictive modeling, behavioral analysis, and automated intelligence that transforms how sales teams operate.
Advanced CRM Analytics
Modern CRM platforms like Salesforce, HubSpot, and Microsoft Dynamics now include sophisticated analytics capabilities that extend far beyond pipeline reporting. These systems track sales velocity, identify bottlenecks in the sales process, and predict deal outcomes with machine learning algorithms.
Key metrics include:
Sales Velocity: Measuring how quickly deals move through each stage
Win Rate Analysis: Identifying factors that correlate with successful closures
Activity Scoring: Tracking which sales activities drive progression
Territory Performance: Comparing results across regions and representatives
Conversation Intelligence Platforms
Tools like Gong, Chorus, and Revenue.io analyze sales calls and meetings to identify patterns in successful interactions. These platforms use natural language processing to extract insights from sales conversations, revealing which talking points, objection handling techniques, and follow-up strategies correlate with deal success.
Predictive Lead Scoring
Advanced lead scoring models use machine learning to analyze hundreds of data points — from demographic information and behavioral signals to engagement patterns and external data sources — to predict conversion probability. This enables sales teams to prioritize efforts on prospects most likely to convert.
Sales Performance Dashboards
Interactive dashboards provide real-time visibility into individual and team performance against targets. The most effective implementations include:
Pipeline health and progression tracking
Activity metrics tied to outcomes
Competitive win/loss analysis
Customer expansion and retention metrics
Marketing Analytics Strategy: Building Your Foundation
Developing an effective marketing analytics strategy requires a structured approach that aligns measurement with business objectives while ensuring data quality and actionable insights.
Defining Success Metrics
The foundation of any marketing analytics strategy lies in identifying the metrics that truly matter to your business. This goes beyond vanity metrics like page views or social media likes to focus on measurements that directly correlate with revenue impact.
Primary Revenue Metrics:
Customer Acquisition Cost (CAC) across all channels
Customer Lifetime Value (CLV) and LTV: CAC ratios
Marketing Qualified Lead to Sales Qualified Lead conversion rates
Attribution-weighted revenue contribution by channel
Secondary Engagement Metrics:
Content engagement depth and progression
Email deliverability and engagement rates
Website conversion funnel performance
Social media sentiment and share of voice
Data Architecture and Integration
Research shows that companies using marketing analytics are three times more likely to achieve positive ROI on their marketing efforts. However, this success depends heavily on having the right data infrastructure in place.
Effective marketing analytics requires:
Unified data collection across all customer touchpoints
Clean data pipelines that ensure accuracy and consistency
Real-time processing capabilities for timely optimization
Scalable storage solutions that grow with your business
Attribution Modeling
Modern attribution modeling goes beyond simple first-touch or last-touch attribution to provide nuanced understanding of how different touchpoints contribute to conversions.
Advanced attribution models include:
Multi-touch attribution that weights all customer interactions
Time-decay models that give more credit to recent touchpoints
Data-driven attribution using machine learning to determine optimal weighting
Cross-device tracking that follows customers across platforms
Data Analytics for Sales and Marketing Integration
The convergence of sales and marketing analytics creates unprecedented opportunities for revenue optimization, but successful integration requires careful planning and execution.
Breaking Down Silos
Traditional organizations operate with distinct marketing and sales analytics systems, creating data silos that limit visibility and collaboration. Modern revenue operations (RevOps) approaches integrate these systems to create a unified view of the customer journey from first touch to closed deal.
Shared Metrics and Accountability
Integration succeeds when both teams are measured on shared outcomes. Key shared metrics include:
Marketing-influenced pipeline: Percentage of sales opportunities that had marketing touchpoints
Sales velocity from marketing sources: How quickly marketing-generated leads progress through sales stages
Revenue attribution: Accurate measurement of marketing’s contribution to closed revenue
Customer expansion rates: Success in growing existing customer relationships
Technology Stack Alignment
Effective integration requires connected technology stacks that share data seamlessly. This typically includes:
CRM integration with marketing automation platforms
Unified analytics dashboards that show both sales and marketing metrics
Lead routing automation based on scoring and qualification criteria
Closed-loop reporting that tracks marketing touches through to revenue
Case Study: Integrated Analytics Success
One SR Analytics client, a leading e-learning platform, achieved remarkable results by integrating their sales and marketing analytics. By connecting HubSpot marketing data with Salesforce sales records, they identified that prospects who engaged with specific video content were 60% more likely to close.
This insight enabled them to:
Optimize content strategy around high-converting topics
Adjust lead scoring to prioritize video-engaged prospects
Align sales messaging with successful content themes
The result: a 6x increase in ROI and significantly improved lead quality scores.
Analytics Applications in Marketing and Sales

Modern analytics applications extend far beyond basic reporting to enable sophisticated automation, personalization, and optimization across the entire revenue cycle.
Predictive Customer Segmentation
Advanced analytics platforms use machine learning to identify customer segments based on behavior patterns, purchase probability, and lifetime value potential. This enables highly targeted marketing campaigns and personalized sales approaches.
Dynamic Content Optimization
Real-time analytics drive content personalization engines that adapt website experiences, email campaigns, and social media messaging based on individual visitor behavior and preferences. Studies show that 80% of consumers are more inclined to engage with businesses that provide personalized interactions.
Automated Campaign Optimization
Modern marketing platforms use analytics to automatically adjust bidding strategies, audience targeting, and creative elements in real-time. This continuous optimization improves performance while reducing manual management overhead.
Sales Intelligence and Enablement
Analytics-powered sales intelligence platforms provide representatives with real-time insights about prospect engagement, competitive landscape, and optimal timing for outreach. These tools significantly improve win rates and reduce sales cycle length.
Voice of Customer Analytics
Sentiment analysis and customer feedback analytics help businesses understand customer satisfaction drivers, identify potential churn risks, and uncover expansion opportunities within existing accounts.
Implementation Best Practices and Common Pitfalls
Successful sales and marketing analytics implementation requires careful attention to data quality, user adoption, and continuous optimization.
Data Quality Foundations
The most sophisticated analytics are worthless without clean, accurate data. Establish data governance practices that ensure:
Consistent data entry standards across all systems
Regular data cleansing to remove duplicates and errors
Validation rules that prevent bad data from entering systems
Audit trails that track data changes and sources
User Adoption Strategies
Analytics tools only deliver value when teams use them. Successful implementations focus on:
Training programs that build analytics literacy across teams
Dashboard design that prioritizes actionable insights over comprehensive data
Mobile accessibility for field sales teams and remote workers
Success metrics that reward data-driven decision making
Common Implementation Pitfalls
Many analytics initiatives fail due to predictable mistakes:
Trying to measure everything instead of focusing on key business metrics
Over-complicating dashboards with too many metrics and visualizations
Neglecting data privacy and compliance requirements
Underestimating change management needed for adoption
Scaling Analytics Capabilities
As organizations mature their analytics capabilities, they often follow a predictable progression:
Descriptive analytics: Understanding what happened
Diagnostic analytics: Understanding why it happened
Predictive analytics: Forecasting what will happen
Prescriptive analytics: Recommending optimal actions
ROI Measurement and Optimization
Measuring and optimizing ROI from sales and marketing analytics requires sophisticated attribution models and continuous testing methodologies.
Calculating Marketing Analytics ROI
Research indicates that companies using advanced analytics report 5–8% higher marketing ROI than their competitors. However, accurate ROI calculation requires careful consideration of both direct and indirect impacts.
Direct ROI Calculation:
Revenue attributed to specific campaigns or channels
Cost savings from automation and efficiency improvements
Reduced customer acquisition costs through better targeting
Indirect ROI Benefits:
Improved customer lifetime value through better retention
Faster sales cycles due to better lead quality
Enhanced cross-selling and upselling through predictive insights
A/B Testing and Optimization
Continuous optimization requires systematic testing of different approaches:
Campaign creative and messaging to improve engagement rates
Landing page elements to increase conversion rates
Email timing and frequency to maximize open and click rates
Sales approach and timing to improve close rates
Long-term Value Optimization
While short-term ROI metrics are important, the greatest value from analytics comes from long-term improvements in:
Customer lifetime value through better retention and expansion
Market positioning through competitive intelligence
Product development guided by customer analytics
Operational efficiency through automated processes
Future Trends in Sales and Marketing Analytics
The future of sales and marketing analytics is being shaped by advancing AI capabilities, privacy regulations, and evolving customer expectations.
AI-Powered Predictive Analytics
McKinsey research shows that organizations using AI in marketing and sales functions are most likely to see significant bottom-line impacts. Future developments include:
Conversational AI that provides natural language insights
Computer vision for retail and e-commerce analytics
Advanced forecasting models that account for external market factors
Automated optimization that continuously improves performance
Privacy-First Analytics
Evolving privacy regulations and customer expectations are driving new approaches to data collection and analysis:
First-party data strategies that reduce dependence on third-party cookies
Privacy-preserving analytics that maintain insights while protecting individual privacy
Consent management platforms that respect customer preferences
Synthetic data generation for testing and development
Real-Time Decision Making
The trend toward real-time analytics enables immediate response to changing conditions:
Live campaign optimization based on performance data
Dynamic pricing that responds to demand and competition
Instant personalization that adapts to individual behavior
Automated alerts that trigger immediate action when thresholds are met
Conclusion
Sales and marketing analytics have evolved from nice-to-have reporting tools to essential competitive advantages that separate market leaders from followers. The organizations thriving in today’s data-driven economy are those that successfully integrate their sales and marketing analytics to create unified views of customer behavior and revenue performance.
The path forward is clear: companies must move beyond fragmented, channel-specific reporting to embrace comprehensive analytics platforms that reveal the complete customer journey and enable predictive optimization.
With 60% of B2B sales organizations transitioning to data-driven selling by 2025, the window for competitive advantage through analytics leadership is rapidly closing. The question isn’t whether to invest in sales and marketing analytics — it’s how quickly you can implement systems that transform your scattered data into strategic advantages.
Ready to transform your sales and marketing performance through advanced analytics?
At SR Analytics, we specialize in helping businesses unlock the full potential of their sales and marketing data. Our team has helped companies achieve 6x ROI improvements and 25% reductions in customer acquisition costs through strategic analytics implementations.
Schedule a free consultation to discover how we can help you turn your data into measurable business results. Don’t let another quarter pass with incomplete visibility into your revenue engine — contact us today to begin your analytics transformation.
FAQ
How long does it take to see results from implementing sales and marketing analytics?
Most organizations see initial insights within 2–4 weeks of implementation, with meaningful business impact typically measurable within 2–3 months. However, the full value of analytics compounds over time as data quality improves and teams develop analytics-driven habits.
What’s the difference between marketing analytics and business intelligence?
Marketing analytics focuses specifically on measuring and optimizing marketing performance and customer acquisition. Business intelligence encompasses broader organizational data analysis including operations, finance, and strategic planning. Modern platforms often integrate both capabilities.
How do I choose the right analytics tools for my organization?
Start by defining your specific business objectives and measurement requirements. Consider factors like data integration capabilities, user experience, scalability, and total cost of ownership. The best tools align with your existing technology stack and team capabilities.
What are the most important metrics to track for B2B vs B2C companies?
B2B companies typically focus on lead quality, sales cycle length, account expansion, and lifetime value. B2C companies emphasize conversion rates, customer acquisition cost, retention rates, and transaction frequency. Both benefit from customer journey analytics and attribution modeling.
How can small businesses get started with sales and marketing analytics without a large budget?
Begin with free tools like Google Analytics, HubSpot’s free CRM, and native social media analytics. Focus on connecting these tools to create basic attribution and conversion tracking. As you demonstrate value, gradually invest in more sophisticated platforms that scale with your growth.
#Data analytics consulting#data analytics consulting services#data and analytics consulting#data analytics consultants#business intelligence services#business intelligence consulting#power bi consultant#data and analytics consultant#data analytics consulting company#data and analytics consulting#data analytics consultant#data analytics services#analytics consulting
0 notes
Text
CPG Analytics Solutions | Optimize Operations & Drive Growth

Consumer packaged goods (CPG) companies face unprecedented challenges in 2025, from volatile supply chains to shifting consumer preferences. Advanced cpg analytics solutions have become essential for brands seeking to optimize operations, drive growth, and maintain competitive advantage.
With global CPG retail sales $7.5 trillion in 2024, and 71% of CPG leaders adopting AI in at least one business function, the industry is rapidly evolving toward intelligent, analytics-driven operations. Our proven methodologies help consumer goods companies unlock the full potential of their data to drive profitable growth.
Why CPG Analytics Matter More Than Ever in 2025
The consumer packaged goods landscape has fundamentally shifted. Companies using advanced analytics consistently achieve 12% lower cost of goods sold ratios compared to non-users, while those relying on outdated approaches struggle to compete. Today’s CPG data analytics requirements extend far beyond traditional reporting.
Key Industry Challenges:
Supply Chain Volatility: Commodity prices remain 20–40% above 2019 levels, with climate change affecting 85% of major food commodities
Consumer Fragmentation: Rapid shifts in purchasing behavior that traditionally took 2–3 years now occur in 2–3 months
Digital Acceleration: E-commerce is forecasted to constitute 41% of global retail sales by 2027
Sustainability Pressure: Products marketed as sustainable are growing 6x faster than conventionally marketed products
Our data analytics consulting services address these challenges through sophisticated CPG analytics platforms that integrate seamlessly with existing operations.
Transform Your CPG Business with Advanced Analytics Solutions
Demand Forecasting & Inventory Optimization
Anticipate demand fluctuations and optimize stock levels using AI-powered predictive models. Our CPG demand forecasting analytics solutions help brands reduce waste while ensuring optimal product availability.
Key Capabilities:
Predictive Demand Sensing: Machine learning algorithms analyze historical sales, weather patterns, and market signals
Dynamic Inventory Optimization: Real-time adjustment of stock levels based on regional demand patterns
Automated Replenishment: Smart restocking decisions with retailer data integration
Results: Clients typically achieve a 15–25% reduction in inventory carrying costs while improving in-stock rates by 8–12%.
Consumer Insights & Personalization
Understand your customers at a granular level and create tailored experiences that drive loyalty. Personalization leaders grow 10 points faster than laggards in the CPG space, making consumer analytics a critical competitive advantage.
Advanced Analytics Include:
Behavioral Segmentation: Deep-dive analysis of purchase patterns and preferences
Sentiment Analysis: Real-time monitoring of brand perception across digital channels
Lifecycle Value Modeling: Predictive analytics for customer retention and growth
Our approach combines traditional market research with modern consumer packaged goods data intelligence to deliver actionable insights that drive product innovation and marketing effectiveness.
Trade Promotion Optimization
Maximize promotional impact and improve ROI through data-driven campaign strategies. Currently, 59% of trade marketing promotions do not break even, representing a massive opportunity for optimization.
Promotion Analytics Solutions:
Lift Analysis: Statistical modeling to measure true promotional impact
Channel Optimization: Determine optimal promotional mix across retail partners
Competitive Intelligence: Monitor competitor promotional strategies and market response
Market Expansion & Competitive Analysis
Identify growth opportunities and outperform competitors through comprehensive CPG analytics. Our geospatial and demographic analytics help brands make informed expansion decisions.
Strategic Capabilities:
Market Opportunity Assessment: Data-driven identification of high-potential regions
Competitive Benchmarking: Performance comparison across key metrics
Channel Strategy Optimization: Determine optimal retail partner mix and distribution strategies

CPG Analytics Use Cases That Drive Growth
Real-Time Performance Monitoring
Track KPIs across multiple channels with automated dashboards and alerting systems. Our Power BI consulting services help CPG brands visualize complex data relationships and identify trends before they impact business performance.
Supply Chain Analytics
Technology is expected to generate 55–60% savings in CPG supply chains within the next decade. Our supply chain analytics solutions provide end-to-end visibility and optimization opportunities.
Digital Shelf Analytics
Monitor online product performance across e-commerce platforms. With digital channels becoming increasingly important, CPG retail analytics software helps brands optimize product listings, pricing strategies, and promotional campaigns.
The Future of CPG Analytics: AI & Machine Learning
Artificial intelligence is reshaping the CPG industry. Our latest insights on data analytics trends explore how emerging technologies are creating new opportunities for growth and efficiency.
AI-Powered Solutions:
Generative AI for Content: Automated product descriptions and marketing copy optimization
Computer Vision: Automated shelf monitoring and compliance checking
Natural Language Processing: Consumer feedback analysis and sentiment tracking
Predictive Modeling: Advanced forecasting for demand, pricing, and promotion planning
A recent McKinsey survey found that 56% of CPG companies now use generative AI regularly, indicating the rapid adoption of these transformative technologies.
Looking to optimize your data processes? Explore our guide on data cleaning automation to streamline your analytics foundation.
Success Stories in CPG Analytics
Case Study: Regional Snack Food Manufacturer
Challenge: Declining market share and inefficient promotional spend
Solution: Implemented comprehensive trade promotion analytics and consumer insights platform
Results: 23% improvement in promotional ROI, 15% increase in market share within 18 months
Case Study: Global Beverage Brand
Challenge: Complex supply chain optimization across 40+ markets
Solution: AI-powered demand forecasting and inventory optimization system
Results: $12M annual savings in logistics costs, 35% reduction in stockouts
Our proven methodologies and expert team have helped dozens of CPG companies achieve similar transformational results.
Why Choose SR Analytics for Your CPG Transformation
As a specialized data analytics consulting firm, SR Analytics brings deep industry expertise and technical excellence to every CPG engagement. Our team combines statistical rigor with practical business acumen to deliver solutions that drive real results.
Our Advantages:
Industry Expertise: Deep experience across food & beverage, personal care, household products, and specialty CPG categories
Technical Excellence: Advanced capabilities in machine learning, statistical modeling, and data visualization
Integration Focus: Seamless connection with existing ERP, CRM, and retail data systems
Scalable Solutions: From pilot projects to enterprise-wide transformations
Getting Started
Ready to transform your CPG business with advanced analytics? Our consultation process begins with a comprehensive assessment of your current data infrastructure and analytics maturity. We then develop a customized roadmap that aligns with your business objectives and delivers measurable value.
Contact our CPG analytics experts today to schedule your free strategy session and discover how data-driven insights can accelerate your growth in 2025 and beyond.
#data analytics consulting services#data analytics consulting company#analytics consulting#data analytics consultant#data and analytics consultant#data analytics consulting#data analytics#data and analytics consulting
0 notes
Text
Business Intelligence Strategy in 2025: How to Build a Future-Proof Data Roadmap

In today’s fast-paced business environment, data isn’t just important — it’s everything. Every decision, every strategy, every campaign hinges on the ability to interpret data correctly and use it to inform action. But how do you tap into this valuable resource? The answer lies in having a robust Business Intelligence strategy. But what exactly does that look like, and why is it essential for success?

Why a Business Intelligence Strategy Matters
A Business Intelligence strategy is the backbone of any data-driven decision-making process. Think of it as a map guiding your business through the mountains of raw data to the peak of insightful, actionable intelligence. Without it, you risk stumbling through your data without clear direction or purpose.

Let’s look at the key benefits of having a BI strategy:
Informed Decision-Making: The primary goal of BI is to improve decision-making. With data-driven insights, you’re no longer guessing or making decisions based on gut feelings. You have the facts.
Efficiency Boost: BI systems automate data collection and analysis, freeing up valuable time for your team. Instead of spending hours sifting through spreadsheets, your team can focus on interpreting insights and acting on them.
Competitive Advantage: Companies that leverage BI can spot trends, understand market changes, and predict the future, giving them a significant edge over competitors who don’t use data as effectively.
Simply put, a good BI strategy helps businesses stay agile, informed, and competitive.
Key Components of a Successful BI Strategy
Building a BI strategy is like putting together a puzzle. It involves different elements that come together to form a cohesive, functioning system. Let’s break it down:
1. Data Collection: The Foundation of BI
Before diving into analytics, the first step is gathering the right data. Data collection forms the foundation of your entire BI strategy. Think of it like gathering ingredients for a recipe. You can’t bake a cake without the right ingredients, and you can’t analyze business performance without the right data.
Whether it’s sales data, customer behavior data, or operational data, you need to ensure you’re collecting the most relevant and high-quality data. This involves:
Identifying what data you need to make decisions.
Ensuring that the data comes from reliable, accurate sources.
Using the right tools to collect, store, and manage this data.
Remember, bad data leads to bad decisions, so the integrity of your data is crucial.
2. Data Integration: Bringing It All Together
Once you’ve collected data from various sources, the next step is integrating it. You can think of this like assembling a jigsaw puzzle. Each piece of data needs to fit together seamlessly, creating a full picture of your business performance.
Data integration means combining data from different departments, systems, and tools into one centralized platform. Whether your data comes from your CRM, ERP system, website analytics, or social media channels, integrating it ensures that everyone is working from the same set of information.
This integration gives you a 360-degree view of your business, allowing you to spot patterns, make connections, and uncover hidden insights that could drive growth.
3. Data Analysis: Turning Raw Data into Insight
Data on its own is just… data. It’s when you analyze it that it transforms into useful insights. This is where the magic happens. Business Intelligence allows you to dig deeper into your data to uncover trends, correlations, and anomalies that you wouldn’t notice on the surface.
Data analysis is crucial for:
Understanding customer preferences and behavior.
Optimizing your sales funnel and marketing campaigns.
Identifying inefficiencies in business operations.
By analyzing data, you gain actionable insights that can help you make strategic decisions. The right BI tools and techniques can turn data into your most valuable asset.
4. Visualization: Making Data Accessible
Data visualization is one of the most critical elements of a BI strategy. A BI dashboard, for example, is a great way to display your key performance indicators (KPIs) and other important metrics in a visually compelling way.
Visuals like charts, graphs, and heatmaps make complex data easier to understand. Instead of sifting through pages of data, decision-makers can quickly interpret trends and make decisions in real-time. A good BI dashboard presents data in a format that’s easy to digest, so everyone, from top executives to analysts, can access and understand the information they need.
5. Actionable Insights: The End Goal
The ultimate goal of a BI strategy is to turn insights into action. Data is valuable, but only when you use it to drive change within your organization. Whether it’s making marketing decisions, improving operational processes, or adjusting your product offerings, BI should empower your team to act on the insights they uncover.
Actionable insights are the bridge between knowledge and results. Without the right actions, data analysis is just a collection of interesting facts. It’s when that data leads to concrete actions that businesses see tangible improvements.
How to Build Your Business Intelligence Strategy

Step 1: Assess Your Needs and Set Clear Objectives
The first thing to do is assess your business needs and set clear goals. What do you hope to achieve with your BI strategy? Is it improving customer retention, increasing sales, optimizing operations, or something else entirely?
Setting specific goals will help you focus on the most relevant data and analytics for your business. The clearer your objectives are, the easier it will be to measure success and adjust your strategy along the way.
Step 2: Choose the Right BI Tools
The tools you use for your BI strategy are crucial. Power BI, Tableau, Google Data Studio, and other BI platforms all offer different features and capabilities. The right tool depends on your business needs, data sources, and the level of customization required.
For instance, Power BI is great for deep integration with Microsoft tools, while Tableau offers more advanced visualization options. Choose the tool that best fits your organization’s workflow and needs.
Step 3: Invest in Data Infrastructure
A solid data infrastructure is critical to the success of your BI strategy. This includes ensuring that your data is properly collected, integrated, and stored. Cloud-based data solutions like AWS, Google Cloud, and Azure are popular choices for businesses because they offer scalability, flexibility, and security.
Additionally, consider adopting data warehouses or lakes if you have large, complex data sets that require advanced storage and retrieval systems. Data infrastructure provides the foundation that ensures your BI strategy runs smoothly.
Step 4: Train Your Team
A BI strategy is only as effective as the people using it. Training your team to use BI tools, interpret data, and make data-driven decisions is essential for success. Whether it’s through workshops, online courses, or hands-on practice, make sure your team is equipped to handle the system.
A well-trained team will be able to generate insights, collaborate effectively, and take meaningful actions based on data.
Step 5: Iterate and Improve
Finally, remember that a BI strategy isn’t static. The business world — and your data — will evolve, so it’s crucial to periodically revisit your strategy. Regularly assess what’s working, what’s not, and make adjustments as needed. This ongoing improvement ensures that your BI strategy stays relevant and continues to deliver value.
Conclusion: Start Your BI Journey Today
A solid Business Intelligence strategy is no longer a luxury — it’s a necessity. The companies that thrive in today’s data-driven world are those that can effectively harness the power of their data. With the right tools, processes, and mindset, you can turn raw data into a competitive advantage.
Building a BI strategy takes time, but it’s a journey worth embarking on. The insights, efficiencies, and growth opportunities that come from making data-driven decisions will set your business on a path to long-term success.
So, are you ready to unlock the full potential of your data? The future of your business depends on it.
#data analytics consulting company#analytics consulting#data analytics#data analytics consultant#data analytics consulting services#data analytics consulting#data and analytics consultant#data and analytics consulting
0 notes
Text
10 Essential Benefits of Power BI That Transform Modern Businesses

Are you drowning in spreadsheets while your competitors make lightning-fast decisions with real-time data? You’re not alone. According to recent studies, over 2.5 quintillion bytes of data are created daily, yet most businesses struggle to turn this information goldmine into actionable insights.
That’s where Microsoft Power BI comes in — a revolutionary business intelligence platform that is changing how organizations approach data analytics.
What is Microsoft Power BI?
Think of Power BI as your organization’s data translator — it takes complex, scattered information and transforms it into crystal-clear insights anyone can understand.
Microsoft Power BI is a suite of business analytics tools that enables organizations to visualize data, share insights, and make informed decisions across every business level.

The Top 10 Benefits of Power BI for Your Business
1. Intuitive Data Visualization That Speaks to Everyone
One of the most compelling benefits of Power BI is its drag-and-drop interface that transforms raw numbers into compelling visual stories. We’ve seen marketing teams create stunning dashboards in minutes while executives get instant clarity on KPIs through interactive charts and graphs.
The platform offers over 30 visualization types, from simple bar charts to complex tree maps. What’s remarkable is how Power BI automatically suggests the best visualization based on your data type, making it nearly impossible to create confusing charts.
2. Real-Time Data Analytics for Lightning-Fast Decisions
In today’s fast-paced business environment, yesterday’s data is ancient history. Power BI excels at providing real-time insights that keep you ahead of the curve. Whether you monitor website traffic, track sales performance, or analyse social media engagement, the platform automatically refreshes data.
Companies reduce their decision-making time from weeks to hours by implementing real-time dashboards. Imagine spotting a trending product, identifying a supply chain bottleneck, or catching a customer service issue the moment it happens — that’s the power of real-time analytics.
3. Cost-Effective Solution with Exceptional ROI
Traditional business intelligence solutions often require massive upfront investments and ongoing maintenance costs that drain budgets. Power BI flips this model with subscription-based pricing starting at just $10 per monthly user.
Most organizations see ROI within 6–12 months. The cost savings come from reduced IT overhead, faster report generation, eliminated manual data processing, and improved decision-making that directly impacts revenue. Compared to enterprise BI solutions costing hundreds of thousands of dollars, the benefits of Power BI become crystal clear.
4. Seamless Microsoft Ecosystem Integration
If your organization uses Office 365, Azure, or other Microsoft products, Power BI is a natural extension of your existing toolkit. Without breaking a sweat, you can embed Power BI reports directly into SharePoint sites, Teams channels, or PowerPoint presentations.
This ecosystem advantage eliminates the typical friction associated with adopting new software. Your team already knows Microsoft interfaces and Single Sign-On capabilities, so there are no additional password management headaches.
5. Self-Service Analytics That Empower Every Team
Power BI democratizes data analysis across your organization by empowering non-technical users to independently create reports and discover insights. Sales teams can analyze pipeline performance, HR departments can track employee satisfaction metrics, and marketing teams can measure campaign effectiveness — all without submitting IT tickets.
This self-service approach speeds up analysis and frees up your IT team to focus on strategic initiatives. It’s one of the most transformative benefits of Power BI.
6. Enhanced Decision-Making Through Data-Driven Insights
Power BI transforms decision-making from an art into a science by providing concrete, data-backed insights that remove guesswork from strategic planning. The platform’s advanced analytics capabilities, including forecasting, trend analysis, and statistical modelling, help organizations identify patterns that human analysis might miss.
Companies using Power BI reports make more confident decisions, reduce risks, and identify opportunities previously hidden in their data.
7. Unmatched Scalability for Growing Businesses
Whether you’re a startup with five employees or a multinational corporation with thousands of users, Power BI scales effortlessly to meet your needs. The benefits of Power BI include flexible licensing options that grow with your organization — start small and expand without architectural overhauls.
The platform handles everything from megabytes to petabytes of data, with Microsoft’s cloud infrastructure ensuring consistent performance regardless of your data volume or user count.
8. Mobile-First Analytics for the Modern Workforce
In a world where remote work is the norm and decisions must be made on the go, mobile accessibility isn’t a luxury — it’s a necessity. Power BI’s mobile apps for iOS and Android deliver full-featured analytics experiences that rival desktop functionality.
Sales managers close deals faster by accessing real-time customer data during client meetings, and executives make critical decisions from airport lounges using mobile dashboards.
9. Advanced AI and Machine Learning Capabilities
Power BI incorporates Microsoft’s advanced AI capabilities, including natural language queries, automated insights, and machine learning models that forecast trends and identify anomalies. Features like Quick Insights automatically scan your data for interesting patterns, while Q&A functionality lets users ask questions in plain English and receive visual answers.
These AI-powered capabilities mean organizations without dedicated data science teams can leverage advanced analytics.
10. Robust Security and Governance Features
Data security is everything, and Power BI addresses this with enterprise-grade security features that protect your most sensitive information. Row-level security ensures users only see authorized data, while Azure Active Directory integration provides centralized access control.
The platform offers comprehensive auditing capabilities, data loss prevention, and compliance certifications for industries like healthcare and finance. These security benefits of Power BI give organizations the confidence to share insights while maintaining strict data governance.
Power BI ROI: The Numbers That Matter
Organizations typically report:
40–60% reduction in time spent on manual reporting
25–35% improvement in decision-making speed
15–25% increase in operational efficiency
ROI of 300–400% within the first 18 months
Industry-Specific Benefits of Power BI

Retail and E-commerce: Track inventory levels, analyze customer behaviour, and optimize pricing strategies with real-time sales dashboards.
Healthcare: Monitor patient outcomes, track operational efficiency, and ensure regulatory compliance while handling sensitive data securely.
Manufacturing: Monitor production lines, track quality metrics, and optimize supply chains with predictive maintenance dashboards.
Financial Services: Manage risk, detect fraud, and analyze customers while ensuring regulatory compliance through real-time monitoring.
Frequently Asked Questions About Power BI Benefits
How quickly can we see results from Power BI? Most organizations start seeing benefits within 2–4 weeks of implementation, with full ROI typically achieved within 6–12 months.
Is Power BI suitable for small businesses? Absolutely. Power BI’s flexible pricing and scalable architecture make it ideal for companies of all sizes.
Can Power BI replace our existing BI solution? In most cases, yes. Power BI’s extensive connectivity and feature set can handle most traditional BI platform requirements while offering additional benefits.
Transform Your Business with Power BI
The benefits of Power BI extend far beyond simple data visualization — they represent a fundamental shift in how organizations approach decision-making. By democratizing data access, enabling real-time insights, and providing enterprise-grade security at an affordable price point, Power BI levels the playing field for businesses of all sizes.
As we move further into the digital age, organizations that thrive will quickly adapt to changing conditions, identify opportunities before competitors, and confidently make data-driven decisions. Power BI provides the foundation for this transformation, turning every employee into a data analyst and every insight into a competitive advantage.
Ready to transform your business with the power of data? Power BI’s benefits are waiting to be unlocked in your organization. Start your journey today and discover how data-driven insights can propel your business to new heights.
#data analytics consulting company#data analytics consulting services#analytics consulting#data analytics consultant#data and analytics consultant#data analytics consulting#data analytics#data and analytics consulting
0 notes
Text
Boost Your Business with Expert Google Analytics Consulting
In today’s digital landscape, data isn’t just valuable — it’s essential. American businesses face unprecedented challenges as consumer behavior shifts dramatically, with most customer journeys now beginning and often ending online. This digital transformation demands real-time insights and data-driven decision-making to stay competitive.
Google Analytics, particularly the new GA4 platform, has emerged as the gold standard for understanding these complex customer journeys. However, maximizing its potential requires expertise that many organizations simply don’t have in-house.

Why U.S. Businesses Need Google Analytics Consulting Now
The analytics landscape underwent a seismic shift in 2023 when Google sunset Universal Analytics in favor of GA4. This wasn’t a simple update but a complete platform overhaul. Many U.S. companies are still struggling with this transition, losing critical historical data and missing opportunities for deeper insights.
For businesses running multichannel or omnichannel marketing campaigns — as most successful U.S. companies now do — the complexity of proper GA4 setup has increased exponentially. Each touchpoint requires careful configuration to create a cohesive data story.
Privacy regulations continue to tighten across America, with the California Consumer Privacy Act (CCPA) setting stringent standards that many other states are following. Expert Google Analytics consulting ensures your data collection remains compliant while still delivering valuable insights.
Most critically, as digital competition intensifies across every industry, businesses that leverage advanced analytics gain a significant competitive advantage. Those relying on basic, out-of-the-box tracking are increasingly falling behind their more data-savvy competitors.
What Is Google Analytics Consulting?
Google Analytics consulting is the specialized service of optimizing your analytics implementation to deliver accurate, actionable business intelligence. It goes beyond basic installation to create customized tracking solutions aligned with your specific business goals and KPIs.
This service proves especially valuable for:
E-commerce brands seeking a deeper understanding of product performance and customer behavior
Direct-to-consumer businesses navigating complex attribution models
SaaS companies track user engagement and retention metrics
Media outlets measuring content performance and audience development
The core benefits include more intelligent tracking configurations, truly actionable data that drives business decisions, and significantly better ROI from your digital marketing investments.
Key Services Tailored for U.S. Businesses
GA4 Implementation & Migration
Our team expertly handles the transition from Universal Analytics to GA4, preserving historical data where possible and creating a measurement strategy that aligns with your specific business model. We implement advanced event-based tracking to capture granular user behaviors that standard installations miss, giving you deeper insight into how Americans interact with your digital properties.
Google Analytics Audit
Many analytics installations contain critical errors that undermine decision-making. Our comprehensive audits identify data gaps, tracking misfires, and over-reporting issues that may be distorting your view of performance. We also ensure your setup adheres to U.S. data privacy standards, protecting you from potential compliance issues.
E-commerce & Conversion Tracking
For online retailers, we provide enhanced e-commerce setups compatible with all major platforms, including Shopify, WooCommerce, and Magento. Our specialized conversion tracking reveals exactly where customers abandon purchases, allowing you to optimize checkout processes and increase revenue immediately.
Looker Studio Dashboards
Transform complex data into crystal-clear visual reports with custom Looker Studio (formerly Data Studio) dashboards. We create executive-level summaries for leadership teams and investors, alongside detailed operational dashboards for marketing and sales teams — all designed to make data accessible to stakeholders throughout your organization.
Tag Management via Google Tag Manager
Clean, scalable tag management solutions eliminate the need for constant developer involvement. Our Google Tag Manager implementations give marketing teams the independence to launch new tracking initiatives without IT bottlenecks, while maintaining governance and quality control.
Ongoing Consulting & Training
Our relationship doesn’t end with implementation. We provide monthly support packages tailored to U.S. agencies and in-house teams, along with customized training programs designed around your team’s specific workflows and knowledge gaps.
Need to migrate to GA4 or optimize your existing implementation? Explore our Google Analytics Consulting Services
Why Choose SR Analytics as Your U.S. Analytics Partner
SR Analytics brings a proven track record working with American clients across industries — from startup e-commerce brands to enterprise B2B companies. We understand the unique characteristics of U.S. market behavior, the tools American businesses typically use, and the legal landscape that affects data collection and usage.
Our team consists of certified Google Analytics professionals who take a consultative approach rather than a one-size-fits-all methodology. We offer flexible pricing and engagement models suitable for businesses of all sizes, from small local companies to nationwide enterprises.
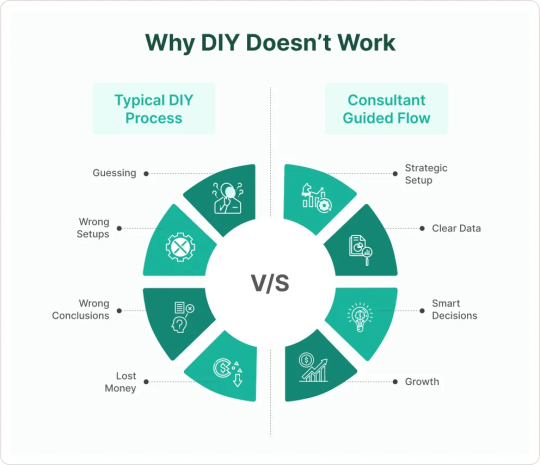
Case Studies: Data-Driven Success Stories
RevStyle Apparel: This growing DTC fashion brand saw conversion rates increase by 25% after our GA4 migration and enhanced e-commerce implementation. By identifying previously hidden friction points in their customer journey, they made targeted improvements that drove immediate revenue gains.
TechFlow SaaS Platform: Our custom dashboard solution helped this B2B software company streamline reporting processes, saving their marketing team over 10 hours per month while providing more actionable insights to guide their content strategy.
“SR Analytics helped Awe Inspired enhance operational efficiency and inventory management.
Awe Inspired, a fast-growing fine jewelry brand, partnered with SR Analytics to streamline inventory management, improve operational visibility, and support continued business growth.” — Tim Eisenmann, COO, Awe Inspired
Getting Started with SR Analytics
Our streamlined process makes it easy for U.S. companies to elevate their analytics capabilities:
Discovery: We learn about your business goals, current setup, and specific challenges
Audit: We thoroughly assess your existing implementation to identify opportunities
Setup: We implement customized tracking solutions aligned with your objectives
Reports: We deliver intuitive dashboards that make data accessible to all stakeholders
Optimization: We continuously refine your analytics ecosystem for ongoing improvement
Each step includes clear deliverables, transparent timelines, and defined success metrics, ensuring you know exactly what to expect throughout our engagement.
Conclusion
In today’s data-driven business environment, proper analytics implementation isn’t a luxury — it’s a necessity. With consumer behavior evolving rapidly and competition intensifying across digital channels, having expert guidance with Google Analytics provides a distinct competitive advantage.
By partnering with SR Analytics, you’re not just getting technical implementation — you’re gaining a strategic advisor who translates complex data into actionable business intelligence. In a competitive U.S. market, this expertise becomes a catalyst for sustainable growth and increased market share.
Don’t wait until data problems impact your bottom line. Take proactive steps now to ensure your business is making decisions based on accurate, comprehensive analytics.
Ready to Transform Your Analytics?
Schedule Your Free Consultation Today
#data analytics consulting services#data analytics consulting company#analytics consulting#data analytics consultant#data and analytics consultant#data analytics#data analytics consulting#data and analytics consulting
0 notes
Text
10 Business Intelligence & Analytics Trends to Watch in 2025
Introduction
In 2025, business intelligence and analytics will have evolved from optional advantages to essential business drivers. Organizations leveraging advanced analytics consistently outperform competitors, with Forrester reporting that data-driven companies are achieving 30% annual growth rates.
We’ve witnessed a significant shift from simple descriptive analytics to AI-powered predictive and prescriptive models that don’t just report what happened but forecast what will happen and recommend optimal actions.
According to Gartner’s latest Analytics Magic Quadrant, organizations implementing advanced BI solutions are seeing a 23% improvement in operational efficiency and a 19% increase in revenue growth. As McKinsey notes, “The gap between analytics leaders and laggards is widening at an unprecedented rate.”

Trend 1: Augmented Analytics Goes Mainstream
Augmented analytics has matured from an emerging technology to a mainstream capability, with AI automating insight discovery, preparation, and visualization. Tools like Microsoft Power BI with Copilot and Tableau AI now generate complex analyses that previously required data science expertise.
A manufacturing client recently implemented augmented analytics and identified supply chain inefficiencies that saved $3.2M annually. These platforms reduce analysis time from weeks to minutes while uncovering insights human analysts might miss entirely.
Trend 2: Data Fabric and Unified Data Environments
Data fabric architecture has emerged as the solution to fragmented data environments. First popularized by Gartner in 2020, this approach creates a unified semantic layer across distributed data sources without forcing consolidation.
Organizations implementing data fabric are reporting 60% faster data access and 40% reduction in integration costs. For enterprises struggling with data silos across departments, cloud platforms, and legacy systems, data fabric provides a cohesive view while maintaining appropriate governance and security.
Trend 3: AI and ML-Driven Decision Intelligence
Decision intelligence — combining data science, business rules, and AI — has become the framework for optimizing decision-making processes. This approach transcends traditional analytics by not just providing insights but recommending and sometimes automating decisions.
Financial institutions are using decision intelligence for real-time fraud detection, reducing false positives by 37%. Retailers are optimizing inventory across thousands of SKUs with 93% accuracy. This shift is fundamentally changing organizational culture, moving from “highest-paid person’s opinion” to data-validated decision frameworks.
Trend 4: Self-Service BI for Non-Technical Users
The democratization of analytics continues with increasingly sophisticated self-service tools accessible to business users. Platforms like Qlik and Looker have evolved their interfaces to allow drag-and-drop analysis with guardrails that maintain data integrity.
This shift has reduced report backlogs by 71% for IT departments while increasing analytics adoption company-wide. The key enabler has been improved data literacy programs, with 63% of Fortune 1000 companies now investing in formal training to empower employees across all functions.
Trend 5: Real-Time and Embedded Analytics
Real-time, in-context insights are replacing static dashboards as analytics becomes embedded directly within business applications. Technologies like Kafka, Snowflake Streams, and Azure Synapse are processing millions of events per second to deliver insights at the moment of decision.
Supply chain managers are tracking shipments with minute-by-minute updates, IoT platforms are monitoring equipment performance in real-time, and financial services are detecting market opportunities within milliseconds. The “data-to-decision” window has compressed from days to seconds.
Trend 6: Data Governance, Privacy & Ethical AI
With regulations like GDPR, CCPA, and the EU AI Act now fully implemented, governance has become inseparable from analytics strategy. Leading organizations have established formal ethics committees and data stewardship programs to ensure compliance and ethical use of data.
Techniques for bias detection, algorithmic transparency, and explainable AI are now standard features in enterprise platforms. Organizations report that strong governance paradoxically accelerates innovation by establishing clear frameworks for responsible data use.
Trend 7: Cloud-Native BI and Multi-Cloud Strategies
Cloud-native analytics platforms have become the standard, offering scalability and performance impossible with on-premises solutions. Google BigQuery, Snowflake, and Azure Synapse lead the market with petabyte-scale processing capabilities.
Multi-cloud strategies are now the norm, with organizations deliberately distributing analytics workloads across providers for resilience, cost optimization, and specialized capabilities. Orchestration platforms are managing this complexity while ensuring consistent governance across environments.
Trend 8: Natural Language Processing in BI Tools
Conversational interfaces have transformed how users interact with data. “Ask a question” features in platforms like Tableau GPT, ThoughtSpot, and Microsoft Copilot allow users to query complex datasets using everyday language.
These NLP capabilities have expanded analytics access to entirely new user groups, with organizations reporting 78% higher engagement from business stakeholders. The ability to simply ask “Why did sales drop in the Northeast last quarter?” and receive instant analysis has made analytics truly accessible.
Trend 9: Composable Data & Analytics Architectures
Composable architecture — building analytics capabilities from interchangeable components — has replaced monolithic platforms. This modular approach allows organizations to assemble best-of-breed solutions tailored to specific needs.
Microservices and API-first design have enabled “analytics as a service” delivery models, where capabilities can be easily embedded into any business process. This flexibility has reduced vendor lock-in while accelerating time-to-value for new analytics initiatives.
Trend 10: Data Democratization Across Organizations
True data democratization extends beyond tools to encompass culture, training, and governance. Leading organizations have established data literacy as a core competency, with training programs specific to each department’s needs.
Platforms supporting broad access with appropriate guardrails have enabled safe, controlled democratization. The traditional analytics bottleneck has disappeared as domain experts can now directly explore data relevant to their function.
Future Outlook and Preparing for 2025
Looking beyond 2025, we see quantum analytics, autonomous AI agents, and edge intelligence emerging as next-generation capabilities. Organizations successfully navigating current trends will be positioned to adopt these technologies as they mature.
To prepare, businesses should:
Assess their BI maturity against industry benchmarks
Develop talent strategies for both technical and business-focused data roles
Establish clear use cases aligned with strategic priorities
Create governance frameworks that enable rather than restrict innovation
Final Thoughts
The analytics landscape of 2025 demands adaptability, agility, and effective human-AI collaboration. Organizations that embrace these trends will gain sustainable competitive advantages through faster, better decisions.
For a personalized assessment of your analytics readiness and a custom BI roadmap, contact SR Analytics today. Our experts can help you navigate these trends and implement solutions tailored to your specific business challenges.
#data analytics consulting company#data analytics consulting services#analytics consulting#data analytics consultant#data and analytics consultant#data analytics#data and analytics consulting#data analytics consulting
0 notes
Text
How Data Visualization Enhances Decision-Making: A Comprehensive Guide
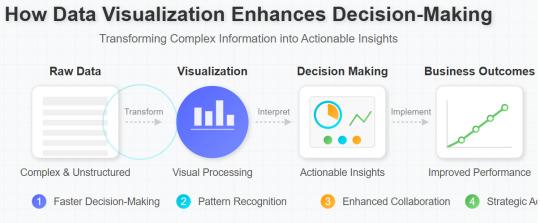
In today’s data-driven business landscape, organizations are drowning in information but starving for insights. As the volume and complexity of data continue to grow exponentially, the ability to transform raw numbers into actionable intelligence has become a critical competitive advantage.
Data visualization stands at the forefront of this transformation, offering powerful tools to enhance decision-making processes across industries.
Understanding Data Visualization in Modern Business
Data visualization is the graphical representation of information and data using visual elements like charts, graphs, and maps. What began as simple bar charts and pie diagrams has evolved into interactive dashboards and immersive visual experiences that reveal patterns, correlations, and trends that might otherwise remain buried in spreadsheets.
According to research from MIT, the human brain processes visual information 60,000 times faster than text.
This cognitive advantage explains why well-designed visualizations can dramatically accelerate understanding and decision-making in complex scenarios. In an era where time-to-decision directly impacts business outcomes, visualization has become essential rather than optional.
The Cognitive Impact of Visual Data Processing
Our brains are wired to process visual information more efficiently than text or numbers. This phenomenon, known as “preattentive processing,” allows us to grasp certain visual attributes — color, size, shape, and motion — almost instantaneously, without conscious effort.
Studies have consistently shown that people remember only about 10% of what they hear and 20% of what they read, but nearly 80% of what they see and do.
By leveraging this cognitive advantage, data visualization reduces the mental workload required to process complex information, allowing decision-makers to:
Quickly identify patterns and anomalies
Understand relationships between variables
Retain insights longer and more accurately
Share a common understanding across teams
How Visualization Transforms Decision-Making Processes
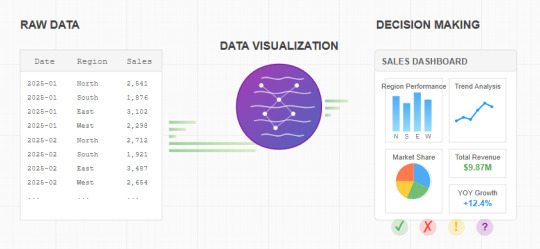
Accelerating Time-to-Decision
In competitive business environments, the speed of decision-making can be as important as the quality. Visualization dramatically reduces the time required to analyze and understand complex data sets.
For example, a global manufacturing company implemented real-time production dashboards across its facilities and reduced decision response time by 58%.
When quality issues appeared on the visualization, floor managers could immediately identify and address problems rather than waiting for end-of-day reports.
“Before implementing visualization tools, our weekly analysis meetings would last three hours as we pored over spreadsheets,” explains Sarah Chen, Chief Data Officer at a Fortune 500 financial services firm. “Now, with our interactive dashboards, we identify key insights in under 30 minutes and spend the rest of our time on strategic decisions rather than data interpretation.”
Discover -> Bad Data Visualization Examples
Enhancing Focus on Critical Insights
The human attention span is limited, making focus a precious commodity. Well-designed visualizations focus on what matters most, filtering out noise and highlighting significant patterns.
Consider healthcare settings, where patient monitoring generates enormous volumes of data. Visualization tools that highlight vital sign anomalies enable clinicians to identify patients requiring immediate attention quickly.
One hospital system reported a 23% improvement in early intervention after implementing visualization-based monitoring, directly improving patient outcomes.
Uncovering Hidden Patterns and Relationships
Some insights simply cannot be discovered without visualization. Complex relationships between variables often remain invisible in traditional reports but become immediately apparent when visualized effectively.
A retail chain analyzing customer behavior discovered an unexpected correlation between weather patterns and certain product categories only after visualizing their sales data geospatially.
This insight led to a dynamic inventory management system that increased seasonal product availability by 34% while reducing overstock by 27%.
Improving Collaborative Decision-Making
When teams share visualizations, they develop a common understanding that transcends departments and technical expertise.
Marketing teams can understand supply chain constraints; finance can appreciate customer experience metrics; executives can grasp technical challenges — all through the universal language of visual representation.
Real-World Applications Across Industries
Financial Services: Risk Visualization and Fraud Detection
Financial institutions handle massive data volumes while operating in highly regulated environments where risks must be carefully managed. Interactive heat maps and network visualizations help analysts quickly identify suspicious patterns that might indicate fraud.
JPMorgan Chase’s fraud detection systems reportedly process 5 million transactions daily, using visualization to highlight potential fraud patterns that would be impossible to detect manually. Their visualization-powered systems have improved fraud detection rates by over 30% while reducing false positives.
Healthcare: Improving Patient Outcomes Through Visual Analytics
Healthcare providers increasingly rely on visualization to manage patient populations and improve clinical outcomes. Visualizing patient data across demographics, conditions, and treatments helps identify high-risk patients and optimize care protocols.
Cleveland Clinic implemented visualization dashboards to monitor readmission risk factors, resulting in a 21% reduction in preventable readmissions.
Clinicians could visually identify which post-discharge interventions were most effective for specific patient populations, allowing for more personalized care planning.
Marketing: Customer Journey Visualization
Modern marketing generates vast data across multiple touchpoints. Visualization tools help marketers understand the complex customer journey and identify opportunities for engagement.
An e-commerce company used journey visualization to discover that customers who engaged with their mobile app within three days of website browsing were 67% more likely to complete a purchase.
This insight led to targeted app download prompts that increased conversion rates by 24%.
Discover -> Worth Investing In Data Visualization Tools For SMEs
Avoiding Common Visualization Pitfalls
Despite its power, data visualization can mislead when implemented poorly. Common pitfalls include:
Misleading scales and proportions: Manipulating axis scales can dramatically change perceptions
Correlation confusion: Visualization might suggest causation where only correlation exists
Overcomplication: Adding too many variables to a single visualization reduces clarity
Cherry-picking data: Selecting only data points that support a preferred narrative

To maintain integrity, organizations should establish visualization standards and train teams in visual literacy — the ability to read, interpret, and create visual representations of data.
The Future of Decision-Making Through Visualization
As technology advances, visualization continues to evolve. Emerging trends include:
Augmented analytics: AI-powered systems that automatically identify and highlight noteworthy patterns
Immersive visualization: VR/AR environments where users can “walk through” their data
Natural language interfaces: Systems that generate visualizations in response to conversational queries
Real-time, collaborative visualization: Platforms that enable multiple stakeholders to interact with live data simultaneously
Conclusion: Translating Visual Insights into Action
Data visualization’s true value lies not in creating beautiful graphics but in driving better decisions. Organizations that develop a visualization strategy aligned with their decision-making needs gain a significant competitive edge.
By reducing cognitive load, highlighting critical insights, uncovering hidden patterns, and fostering collaboration, data visualization transforms information overload into decision-making clarity.
In a business environment where the quality and speed of decisions directly impact success, the ability to effectively visualize data has become an essential capability rather than a nice-to-have skill.
As you consider your organization’s approach to data, remember that the most sophisticated analysis provides little value if key decision-makers cannot understand and act upon it. Effective visualization bridges this gap, ensuring that your data doesn’t just inform — it transforms.
#data analytics consulting services#data analytics consulting company#analytics consulting#data analytics consultant#data and analytics consultant#data analytics#data analytics consulting#data and analytics consulting
0 notes