#Data Visualization in Agriculture
Explore tagged Tumblr posts
Visit Tumblr Blog
Explore Tumblr blogs with no restrictions, modern design and the best experience.
Last Seen Tumblr Blogs


Fun Fact
Tumblr Inc. is using 66 technologies for its website.
Text
Data Visualization in Agriculture
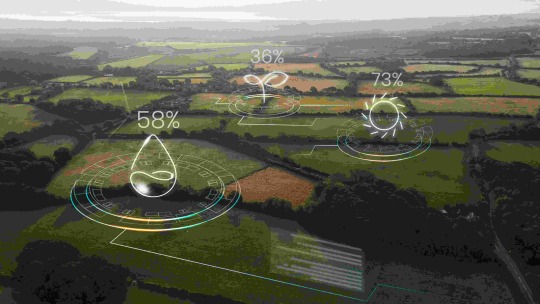
Explore how data visualization transforms agriculture by enhancing productivity, improving decision-making, and promoting sustainability through actionable insights and analytics. Farmers and agricultural professionals are now lending help from data visualization to simplify vast amounts of information.
1 note
·
View note
Text

An update to the famous HOG map
#map#geography#agriculture#hog#pig farming#data visualization#mapsontheweb#nemfrog#my art#my maps#niche postin#I have arcgis pro on my work computer and i've been really enjoying making maps when its slow the past nine months#lobster's adventures#i think its an interesting comparison. makes the shift from small farms to industrial farms very obvious#that one random county in Utah there's a big smithfield company farm#its by county btw im pretty sure the original map is also by county. realistically its the smallest unit you can get data on#also learned that USDA lets farms ask for their data not to be public#so when I used just one year there were big gaps. so i had to backfill certain counties from the most recent year data was available
8 notes
·
View notes
Text
Explore These Exciting DSU Micro Project Ideas
Explore These Exciting DSU Micro Project Ideas Are you a student looking for an interesting micro project to work on? Developing small, self-contained projects is a great way to build your skills and showcase your abilities. At the Distributed Systems University (DSU), we offer a wide range of micro project topics that cover a variety of domains. In this blog post, we’ll explore some exciting DSU…
#3D modeling#agricultural domain knowledge#Android#API design#AR frameworks (ARKit#ARCore)#backend development#best micro project topics#BLOCKCHAIN#Blockchain architecture#Blockchain development#cloud functions#cloud integration#Computer vision#Cryptocurrency protocols#CRYPTOGRAPHY#CSS#data analysis#Data Mining#Data preprocessing#data structure micro project topics#Data Visualization#database integration#decentralized applications (dApps)#decentralized identity protocols#DEEP LEARNING#dialogue management#Distributed systems architecture#distributed systems design#dsu in project management
0 notes
Text
Israel is demolishing northern Gaza and fortifying military positions, imagery shows
https://www.washingtonpost.com/world/2024/12/23/gaza-north-israel-jabalya-palestinians/
Israel is carrying out mass demolitions and erecting military fortifications in residential areas of northern Gaza where tens of thousands of Palestinians have been forced to flee their homes, according to satellite imagery, verified videos and interviews.
As areas are emptied of Palestinians, Israeli forces have demolished entire neighborhoods, established military fortifications and built new roads, according to a Washington Post analysis of high-resolution satellite images. The visual evidence shows almost half of Jabalya refugee camp was demolished or cleared between Oct. 14 and Dec. 15, connecting a preexisting road in the west to an expanded vehicle track in the east — carving out a military axis that stretches from the sea to the border fence with Israel.
The establishment of this corridor, the clearing of tracts of land on either side of it and the construction of square-shaped protected outposts resemble the IDF's transformation of the Netzarim Corridor, a strategic Israeli military zone in the center of Gaza, analysts said. While Israeli forces cut the Netzarim Corridor through a lightly populated, largely agricultural area, Israel's operations in the north are centered in dense urban neighborhoods — effectively destroying northern Palestinian cities.
As of Dec. 1, a third of all buildings across the North Gaza governate had been destroyed since the beginning of the war — including more than 5,000 in Jabalya, more than 3,000 in Beit Lahia and more than 2,000 in Beit Hanoun, according to the latest data from the U.N. Satellite Center. Sixty percent of the destruction in the Jabalya refugee camp took place between Sept. 6 and Dec. 1, the data showed, and the demolitions and displacement have continued in the weeks since.
A satellite image taken Dec. 15 shows widespread devastation across Beit Lahia and Jabalya, with a market, mosque, shops and homes flattened into heaps of concrete and dust. On Dec. 4, the Israeli military forced 5,500 people sheltering in schools in Beit Lahia to flee south to Gaza City, according to the U.N. humanitarian affairs office.
Earlier this month, former Israeli defense minister Moshe Ya'alon told local media in a series of interviews that the IDF was carrying out "ethnic cleansing" in northern Gaza. "Beit Lahia no longer exists, Beit Hanoun no longer exists, and now they are working on Jabalya," he said.
In interviews conducted by phone and text message over multiple weeks, 10 northern Gaza residents described to The Post the widespread targeting of civilian neighborhoods by Israeli forces, dangerous mass evacuations where men and teenage boys were separated from women and children, as well as the abuse and arbitrary detention of some of those trying to flee. Their accounts were consistent with photos and videos verified by The Post of mass screenings and arrests, as well as attacks on civilians.
"In northern Gaza, there is nothing left that sustains life," said Beit Lahia resident Said Kilani, 41. "Everything has been destroyed to force people out."
In the first three weeks of the IDF's new offensive in the north, more than 1,000 people were killed, the health ministry estimated, adding it was probably an undercount with so many bodies still on the streets or buried under rubble. Gaza's civil defense service said on Oct. 23 it could no longer operate safely there, leaving the area without ambulances or rescue workers.
7 notes
·
View notes
Text
Battletech: Mira planetary report
Mira Planetary Report 3025 year
Recharging station: none
ComStar Facility Class: B
Population: 3 million
Percentage and level of native life: 15% mammal
Note: These refer to land life, like most colonized worlds, native life is replaced with Terran species, nobody bothers with ocean life, unless is relevant somehow. In Mira case, algae are vital to the ecosystem but this means commercial fishing is not practicable as it clogs nets.
Star System Data
Star Type: F6III (subgiant)
Position in System: 4th planet (Mira IV)
Distance from Star: Approximately 3.16 AU (within the habitable zone of an F6III star)
Travel Time to Jump Point: 10 days at 1G acceleration
Mira orbits an F6III subgiant star, larger and brighter than Sol (a G2V star), which extends the habitable zone farther out and increases dropship travel time to the jump point compared to Terra’s 6-8 days. The 10-day journey reflects the standard BattleTech transit model: dropships accelerate at 1G for half the voyage, perform a turnover, and decelerate at 1G to arrive at zero velocity.
Planetary Data
Diameter: 12,000 km (comparable to Terra)
Gravity: 0.9g
Atmosphere: Standard, breathable; slightly thinner than Terra’s but enriched with oxygen due to abundant oceanic algae
Hydrosphere: 85% water coverage
Natural Satellites: Two small moons
Population: 2.8 million (as of 2975)
Government: Part of the Capellan Confederation (liberated by the 1st St. Ives Lancers in 2975)
Mira, the fourth planet in its system, orbits an F6III subgiant star at approximately 3.16 AU, placing it within the habitable zone. Its diameter and gravity (0.9g) are close to Terra’s, making it comfortable for human habitation. The atmosphere, though thinner than Terra’s, supports life with a higher oxygen content due to widespread algal blooms in its vast oceans, which cover 85% of the surface. Two small moons influence tidal patterns, while a strong magnetosphere shields the planet from stellar radiation. In 2975, Mira was liberated by the 1st St. Ives Lancers, integrating it into the Capellan Confederation.
Year Length: 1300 Earth days (3.55 years), with ~325-day seasons, orbiting at ~3.16 AU around a ~2.5 solar mass F6III star.
Axial Tilt: ~23.5°, supporting southern Russia/Crimea-like seasonal cycles.
Latitudinal Climate Gradient:
Temperate Zones (20°–50°N/S): Southern Russia/Crimea-like (5–25°C, 400–800 mm rainfall), with coastal resorts and agriculture.
Mountainous Regions: Caucasus-like, cooler (0–15°C), with snowfall.
Equatorial Zones (0°–20°N/S): Warm, humid (25–35°C, 800–1200 mm rainfall), supporting algal blooms.
Astronomical Quirk: Strong magnetosphere shields against F6III radiation; two moons stabilize orbit and tilt.
Oceanic Nature: 85% water coverage drives albedo, cloud cover, and precipitation, moderating climate for habitability.
Stellar Characteristics and Perception Mira’s parent star, an F6III subgiant, differs significantly from Sol (a G2V star) in ways that shape the planet’s environment and how its sunlight is perceived:
Luminosity: The F6III star is far more luminous than Sol, emitting approximately 20–30 times more light. This increased output pushes the habitable zone farther out, allowing Mira to sustain life at 3.16 AU despite the star’s intensity.
Apparent Size: From Mira’s surface, the star appears larger in the sky than Sol does from Terra. Given the F6III star’s larger physical size and the adjusted distance of the habitable zone, its apparent diameter might be 1.5–2 times that of Sol as seen from Earth, creating a striking visual presence.
Light Temperature: With a surface temperature of 6,500–7,000 K (compared to Sol’s 5,772 K), the star’s light is bluer and more intense. This higher color temperature results in a harsher daylight compared to Terra’s warmer, yellower sunlight. The bluish tint could require adaptations for human comfort—such as tinted visors or specialized architecture—and might influence plant photosynthesis, favoring species adapted to bluer wavelengths.
The sunlight on Mira is indeed harsher due to its intensity and blue-shift, contrasting with Sol’s gentler glow, altering the planet’s aesthetic and environmental dynamics.
Impact of Oceans and Cloud Cover Mira’s extensive oceans, covering 85% of its surface, interact with the star’s intense sunlight to moderate its effects. The brighter, more energetic light drives higher rates of evaporation compared to Terra (which has 71% water coverage), leading to increased cloud formation. This thick cloud cover acts as a natural filter, reflecting a portion of the star’s radiation back into space and diffusing the remaining light. As a result, the harshness of the sunlight is lessened, softening its impact on the surface and contributing to a more temperate climate. This interplay between intense stellar output and planetary water creates a balanced, livable environment despite the star’s power.
Geography
Mira is predominantly a waterworld, with oceans covering 85% of its surface. Its limited landmass consists of archipelagos and small continents, many featuring mountainous terrain. These islands, often volcanic in origin, exhibit active tectonics, akin to Terra’s Oceania region. Volcanic activity is moderate rather than absent, as waterworlds with fragmented landmasses typically experience tectonic movement due to thinner crusts and mantle convection—though less intense than on continents with massive tectonic plates. The scarce flat land is reserved for agriculture and settlements, while the mountains yield coal and metallic ores, though not in quantities sufficient for major industry. Offshore platforms exploit hydrocarbons (oil and gas) from the ocean floor, as the mountainous land lacks significant sedimentary deposits typical of flat terrains where fossil fuels accumulate.
Climate
Mira’s climate is moderated by its extensive oceans, which act as a heat sink to prevent extreme temperature swings. The temperate zones on larger landmasses resemble southern Russia—warm summers and cool winters—while coastal areas and islands enjoy a milder, Crimea-like climate, ideal for resorts. The mountains, similar to the Caucasus, experience cooler temperatures and seasonal snowfall. Despite orbiting a hotter F6III star, Mira’s water coverage balances the climate, making it more pleasant than Tikonov (a harsh world orbiting a G8V star). The temperate zones align with the Kuban and Crimea, offering a respite for Tikonov nobles accustomed to continental rigors.
History
Mira was settled in the early 22nd century by Russian colonists from nearby Tikonov, who named it “Mira”—Russian for “world” and “peace”—reflecting its tranquil appeal. Initially an independent colony, it was annexed by the Marlette Association by 2306. In 2309, the Tikonov Grand Union, under General Diana Chinn, captured Mira after a 23-week campaign, integrating it into their domain. Its proximity to Tikonov (a single jump away) and pleasant environment made it a resort planet, with its continent parceled out into luxury estates for Tikonov nobility.
During the Succession Wars, Mira’s strategic location transformed it into a contested frontier. In 2829, the Bloody Suns mercenary unit invaded, expecting an easy victory over the Third Chesterton Cavalry. The defenders resorted to chemical weapons, prompting Duke Hasek of the Federated Suns to order a nuclear strike, followed by the Eighth Crucis Lancers’ ruthless mop-up. This brutal conflict left a lasting mark. Mira changed hands repeatedly between the Capellan Confederation and Federated Suns, serving as a staging base for attacks on Tikonov. In 2975, it was liberated by the 1st St. Ives Lancers, integrating it into the Capellan Confederation.
Economy
Mira’s economy is modest, shaped by its sparse population and limited resources. Its textile industry, producing high-quality fabrics, has earned it the nickname “clothiers to the galaxy,” with exports reaching across the Inner Sphere.
Sea mining of hydrocarbons via offshore platforms in the shallow waters sustains some light and heavy industry, compensating for the lack of easily extractable mineral resources and fertile arable land, which has prevented major industrial or agricultural development.
Notable Features
Molotosky Water Purification Process: A Mira innovation, widely adopted for its efficiency in water purification.
Luxury Estates: Historic resorts of Tikonov nobles, blending Russian and Asian architectural styles, now cultural landmarks.
Textile Industry: Renowned for craftsmanship, a cornerstone of Mira’s identity.
Cultural Heritage: Reflects its Tikonov settlers’ Eurasian roots, evident in architecture and traditions.
Military Significance
Mira’s proximity to Tikonov makes it a strategic linchpin. Its ports and spaceports support military logistics, and its history as a staging base underscores its value in conflicts between the Capellan Confederation and Federated Suns.
4 notes
·
View notes
Text
Satellites: Their Orbits, Tracking Systems, and Essential Uses

Satellites: Their Positions, Tracking, and Importance
Satellites have become an essential part of modern life, orbiting Earth and providing us with services ranging from communication and navigation to weather forecasting and space exploration. As of 2024, thousands of active satellites are circling our planet, each performing a specific role to enhance the quality of life on Earth. This article delves into the positioning of satellites, how they are tracked, what they track, and the significance of their roles.
Types of Satellite Orbits and Their Positions
Satellites are positioned in various orbits depending on their intended functions. These orbits determine how close the satellite is to Earth, how fast it moves, and what areas it covers.
Low Earth Orbit (LEO): Altitude: 180 km to 2,000 km Satellites in LEO include most Earth observation satellites, the International Space Station (ISS), and some communication satellites. These satellites are closer to the Earth, enabling them to capture high-resolution images. Functions: Used for imaging, remote sensing, and some communication purposes. Examples: ISS, Earth observation satellites like Landsat.
Medium Earth Orbit (MEO): Altitude: 2,000 km to 35,786 km Satellites in MEO are mainly used for navigation. This orbit offers a good balance between coverage and latency. Functions: GPS satellites and other global navigation systems. Examples: GPS, GLONASS, and Galileo satellites.
Geostationary Orbit (GEO): Altitude: 35,786 km above the equator Satellites in GEO move at the same rotational speed as Earth, meaning they stay fixed over one location on Earth. These are mostly communication and weather satellites. Functions: Used for television broadcasts, weather monitoring, and some types of communication. Examples: Weather satellites (GOES series), telecommunication satellites.
Highly Elliptical Orbit (HEO): Orbit shape: An elongated orbit with one point closer to Earth (perigee) and another point much farther away (apogee). Functions: Ideal for regions at high latitudes, providing prolonged coverage over areas like Russia and parts of Canada. Examples: Molniya satellites for communication in Russia.
How Satellites Are Tracked
The sheer number of satellites in space, combined with space debris, means tracking them is essential to avoid collisions and ensure their functionality. Ground stations and dedicated space agencies continuously monitor satellites. Several methods are used to track satellites:
Radar and Ground-Based Systems: Ground stations use radar to track satellites in LEO. These systems bounce radio waves off the satellite and measure the time it takes for the signal to return. By doing this repeatedly, they can track a satellite's location and speed.
Global Positioning System (GPS): Satellites in higher orbits like MEO or GEO are tracked using onboard GPS receivers. GPS helps calculate the satellite’s position and relay that data back to Earth.
Optical Tracking: Telescopes and cameras are used to visually observe satellites in higher orbits. This method is particularly useful for tracking objects that do not emit radio signals or need to be monitored for their physical characteristics.
Space Surveillance Networks: Agencies such as the U.S. Space Surveillance Network (SSN) and similar organizations in other countries continuously monitor satellites and space debris. They catalog objects and issue alerts for potential collisions.
What Satellites Track
Satellites are equipped with various sensors, cameras, and instruments to track a wide array of data on Earth, in space, and beyond:
Weather and Climate Data: Satellites such as NOAA’s GOES series monitor weather patterns, hurricanes, and long-term climate changes. They provide crucial data for meteorological services.
Earth Observation: Satellites like Landsat capture high-resolution images of Earth's surface. These images are used for mapping, agricultural planning, disaster response, and environmental monitoring.
Navigation Signals: GPS and other GNSS (Global Navigation Satellite Systems) satellites send signals that are used for navigation by smartphones, vehicles, ships, and airplanes worldwide.
Communication: Satellites facilitate global communication by relaying TV, radio, and internet signals across vast distances.
Space Exploration: Space telescopes like the Hubble Space Telescope track distant galaxies, nebulae, and black holes, helping scientists study the universe.
Military Surveillance: Many satellites are designed for defense purposes, tracking missile launches, military movements, or spying on potential threats.
Number of Satellites in Space
As of 2024, there are approximately 8,000 operational satellites orbiting Earth. The exact number fluctuates as new satellites are launched and old ones are decommissioned. Additionally, space agencies and private companies like SpaceX continue to launch large satellite constellations, such as Starlink, which alone has over 5,000 satellites in orbit for global internet coverage.
The Usefulness of Satellites
Satellites have become indispensable in modern life, serving a wide variety of purposes that impact everyday activities and critical global functions:
Key Functions of Satellites:
Communication: Satellites enable long-distance communication by transmitting data, television, and internet services. Without them, global broadcasting and real-time communication in remote areas would be impossible.
Navigation: Systems like GPS help millions of people navigate in real-time. They are also vital for the functioning of aviation, maritime travel, and even agricultural practices.
Earth Observation: Satellites provide high-resolution imagery of Earth, helping with disaster management, urban planning, agriculture, and environmental monitoring. For instance, they can track deforestation or observe glaciers' melting rates.
Weather Forecasting: Weather satellites provide the data needed for accurate predictions, storm tracking, and climate monitoring. This information is critical for preparing for natural disasters like hurricanes or floods.
Scientific Research and Exploration: Space telescopes and interplanetary satellites gather data on space phenomena, expanding our understanding of the universe. Satellites also conduct scientific experiments in the microgravity of space.
Defense and Security: Satellites are used for military surveillance, early-warning systems, and missile detection, playing a crucial role in national security.
Satellite Highlights in Brief:
Types of orbits: LEO, MEO, GEO, HEO, each serving different purposes.
Tracking methods: Radar, GPS, optical tracking, and space surveillance networks.
Data tracked by satellites: Weather, Earth observation, navigation signals, space exploration, and military surveillance.
Number of active satellites: Approximately 8,000.
Key roles: Communication, navigation, weather forecasting, Earth observation, scientific research, and defense.
In conclusion, satellites are essential tools for global communication, navigation, monitoring Earth's environment, and scientific discovery. As technology advances and the number of satellites continues to grow, their impact on our daily lives will only increase. Whether improving how we predict the weather, navigate through traffic, or explore the universe, satellites will continue to be a critical resource for humanity.
Go To How Satellites Work and What They Track
#satellite orbits#satellite tracking#satellite functions#low earth orbit#geostationary orbit#medium earth orbit#space technology#GPS satellites#communication satellites#weather satellites#Earth observation#satellite uses#satellite positions#how satellites work#space surveillance#satellite navigation#satellite networks#satellite importance#global navigation systems
7 notes
·
View notes
Text
Tree Labeling in Agriculture: A Practical Guide for Farmers and Growers
Whether you’re running a small orchard, managing an agroforestry project, or operating a large-scale plantation, labeling your trees is one of the simplest but most powerful tools you can use. It helps you stay organized, track performance, and make informed decisions year after year.
In this guide, we’ll walk through why tree labeling matters, how to do it effectively (both physically and digitally), and practical tips to set up your own system. no matter your farm size or budget.
Why Label Trees on a Farm?
Labeling trees isn’t just for show. It plays a vital role in the daily operations and long-term health of your farm. Here’s why it's essential:
Tree Identification
Knowing the exact species or variety is key, especially in mixed orchards, experimental plots, or where grafted cultivars are involved. Accurate labels eliminate confusion.
Record-Keeping and Traceability
Labels allow you to link each tree to a digital record of its planting date, treatments, pruning, pest issues, and yields. This is crucial for certifications like Organic or GAP (Good Agricultural Practices).
Planning and Decision-Making
A well-labeled tree system helps with planning irrigation, pruning schedules, nutrient application, and even harvesting or replanting.
Worker Training and Efficiency
Field workers can be trained to use the labeling system to reduce mistakes, boost productivity, and communicate issues easily.
Types of Tree Labels
Depending on your goals, environment, and available resources, you can choose from various labeling methods — from simple handwritten tags to QR code-enabled digital systems.
1. Physical Labels (In the Field)
These are tags placed on or near each tree to allow for visual identification on-site.
Options:
Aluminum Tags: Weatherproof and long-lasting. Can be engraved or written on with permanent marker.
Plastic Tags: UV-resistant, cheaper, and color-coded. Good for short- to mid-term use.
Wooden Stakes: Ideal for nurseries or young seedlings before permanent labeling.
QR Code or RFID Tags: Scannable tech for advanced farms linking each tree to a database.
What to Include on the Label:
Tree ID (e.g., T-024)
Species and Cultivar (e.g., Mangifera indica – Alphonso)
Planting Date
Special Notes (e.g., Grafted, Zone 2B, Pest-prone)
Example Label:
Tree ID: T-024 Species: Mangifera indica (Alphonso) Planted: 2023-07-12 Notes: Grafted, Zone 2B
Best Practices:
Use UV-resistant ink or engrave to prevent fading.
Place labels on sturdy branches or stakes near the trunk.
Avoid wire directly on the bark — use flexible ties to prevent girdling.
Color-code for quick identification (e.g., green for productive, red for inspection needed).
2 Digital Labeling (Data Management)
A physical tag is just the beginning. To unlock the full value of tree labeling, connect your field system to a digital database.
Tools to Consider:
Spreadsheets: Google Sheets or Excel for small to mid-size farms.
Farm Management Apps: Like Croptracker, AgriWebb, FarmLogs.
GIS Mapping Tools: Useful for mapping tree locations, soil types, and water access.
Suggested Data Fields:
FieldExampleTree IDT-024Species/VarietyMangifera indica (Alphonso)GPS Location-1.2901, 36.8219Planting Date2023-07-12Health StatusHealthyYield History15 kg (2024), 22 kg (2025)NotesPruned in May 2025
Tip:
Make sure your physical label and digital record use the same Tree ID to avoid confusion.
Setting Up Your Tree Labeling System: Step-by-Step
Here’s a simple process you can follow to create an effective tree labeling system on your farm:
1. Develop a Tree ID Format
Use a consistent code. For example:
T-001 to T-500 for individual trees
A1-T045 for Block A1, Tree 45
2. Choose Label Materials
Pick a material based on durability, budget, and weather conditions. Aluminum tags last years. Plastic is more affordable and good for color-coding.
3. Create and Place Labels
Label trees shortly after planting and keep them visible but secure. Stake labels for seedlings or use hanging tags for mature trees.
4. Build a Digital Record
Start with a spreadsheet or use farm software. Log all essential details (see data table above) and update it after each season.
5. Train Your Team
Ensure workers understand how to read labels and update records. Use the system for pruning schedules, disease scouting, and yield logging.
Taking It Further: Tech Integration
If you're managing hundreds or thousands of trees, consider integrating technology:
QR Codes: Each code links to a full digital record. Can be scanned with a phone.
Drones or GPS tools: For mapping tree positions and checking health.
Irrigation + Sensor Data Integration: Label data can feed into smart irrigation decisions based on tree health and stage.
Final Thoughts
Tree labeling might seem like a small task, but it has a big impact on how efficiently and intelligently you run your farm. Whether you’re managing 10 or 10,000 trees, a good labeling system is the foundation for sustainable, productive agriculture.
Start simple, stay consistent, and as your farm grows, your tree labeling system will grow with it.
I hope this was helpful and happy gardening from Gardening with kirk
Here is a videos on additional tips on Pruning fruit trees 🌳
https://youtu.be/scvsi2oQK74?si=ENRGMxKrquBY8v9M
youtube
2 notes
·
View notes
Text

Mapping the genocide in Gaza
Forensic Architecture’s latest report documents the extent and intent of Israel’s assault on the Gaza Strip, strengthening South Africa’s case in the ICJ charging Israel with the crime of genocide.
In October, Forensic Architecture (FA) released a report meticulously documenting Israel’s military assault on Gaza. A Spatial Analysis of the Israeli Military’s Conduct in Gaza since October 2023 not only reports evidence of the military’s violence against all aspects of civilian life—from hospitals, schools, shelters, archeological sites, and religious centers to agricultural lands, water wells, bakeries, and aid distribution—it also documents how these incidents form patterns that, taken together, demonstrate the intent to commit genocide.
[...]
FA’s October report contains more than 800 pages of evidence, organizing thousands of well-documented acts of Israeli military violence into six categories: spatial control; displacement; destruction of agriculture and water resources; destruction of medical infrastructure; destruction of civilian infrastructure; and targeting of aid. These thousands of data points have been visually mapped on FA’s A Cartography of Genocide, revealing what it describes as overlapping “patterns of ‘incidents’.”
[...]
The report and its corresponding “Cartography of Genocide” further show how on these large tracts of agricultural land “the Israeli military constructed roads, temporary encampments, permanent bases, lines of fortification, and checkpoints”—which, in turn, aided in the displacement of Palestinians, lessened the space that Palestinians can occupy, and contaminated the soil and underground water resources. “When you add up the scale of crimes against humanity and genocide…,” Weizman said, “it’s all about relations. Genocide is all about relations between statements and actions, between intentions and consequences, between all different types of actions and consequences, what they add up to.” He said, “It’s evidence on a meta-level, meaning it’s evidence about evidence….” Layered over one another—these patterns of repeated displacement of Palestinians, the destruction of agricultural land and medical and civilian infrastructure, and the limiting of aid deliveries—demonstrate the underlying intent behind operational orders. The report concludes, “Our analysis found that these acts of destruction and construction were not haphazard, but followed consistent and clear spatial logic.”
2 notes
·
View notes
Text
UAVISUALS: Leading Australia’s Drone Inspection and Data Solutions with Precision and Innovation
Industries across Australia are transforming through the power of drone technology, and UAVISUALS stands at the forefront of this revolution. UAVISUALS offers advanced drone inspections and data solutions to enhance safety, efficiency, and data accuracy across multiple sectors. From construction and energy to environmental monitoring, UAVISUALS empowers industries to leverage aerial data insights that drive better decision-making and operational excellence.
Rethinking Inspections with Drone Technology
Traditional inspection methods are often labor-intensive, costly, and risky, requiring personnel to access difficult or dangerous locations. UAVISUALS redefines this process with drone technology, providing safe, efficient, and detailed inspections without the need for scaffolding, cranes, or extensive downtime. Licensed by the Civil Aviation Safety Authority (CASA), UAVISUALS brings a high standard of safety and regulatory compliance to every mission.
With drones equipped with high-resolution cameras, UAVISUALS captures precise visuals of assets such as power lines, towers, bridges, and rooftops, identifying potential issues before they escalate into costly repairs or operational interruptions. This proactive approach enables companies to conduct timely maintenance, reduce costs, and extend the life of their assets.
Comprehensive Data Solutions Across Industries
UAVISUALS is not just an inspection provider; it’s a full-spectrum data solutions partner. The company offers specialized services tailored to meet the diverse needs of Australia’s industries, including:
Asset and Infrastructure Inspections: UAVISUALS conducts thorough inspections on a wide range of industrial assets, capturing data from hard-to-reach places with exceptional clarity. Their drones can identify issues like corrosion, structural defects, and equipment wear, helping clients address maintenance needs efficiently.
3D Mapping and Topographic Surveys: Using photogrammetry and LiDAR, UAVISUALS generates accurate 3D models and maps, ideal for construction planning, urban development, and land management. These models provide essential measurements and an overall view that enhances precision for project managers, architects, and engineers.
Thermal Imaging and Fault Detection: UAVISUALS’ thermal drones detect temperature anomalies that signal equipment malfunctions or energy inefficiencies, making them invaluable for industries such as renewable energy, utilities, and manufacturing. By spotting issues early, clients can implement corrective actions, reducing risks and avoiding potential failures.
Environmental Monitoring: For agricultural and environmental applications, UAVISUALS offers drone solutions that monitor vegetation health, water quality, and land use. These insights are crucial for sustainable farming practices, conservation efforts, and ecological studies.
Empowering Australian Businesses with Actionable Insights
At UAVISUALS, the goal is not just to collect data but to provide clients with insights they can act on. The UAVISUALS team consists of experienced drone operators, data analysts, and industry experts who turn raw data into meaningful reports and recommendations. Whether it’s helping clients plan maintenance, optimize resource usage, or monitor environmental impacts, UAVISUALS delivers actionable insights that drive smarter, more informed decisions.
Their services streamline processes, save time, and enhance safety, allowing clients to focus on core operations while UAVISUALS handles data capture and analysis. From routine inspections to complex surveys, UAVISUALS’ solutions make data accessible, understandable, and highly relevant to each client’s objectives.
Pioneering the Future of Drone Technology in Australia
As demand for drone technology grows, UAVISUALS remains committed to staying at the cutting edge. The company continually invests in the latest drone models, advanced imaging technology, and data processing tools to ensure clients receive the best solutions available. This dedication to innovation positions UAVISUALS as a leader in the evolving drone services industry, ready to meet the changing needs of Australian businesses.
For companies looking to integrate advanced data solutions, UAVISUALS offers a partnership that combines technological excellence with practical expertise. By transforming how businesses approach inspections, mapping, and monitoring, UAVISUALS enables a safer, smarter, and more sustainable future across Australia.
2 notes
·
View notes
Text
The Importance of Big Cool Sci-Fi Stuff
(This was originally posted on Blogspot on March 13, 2023)

I finished watching Turn A Gundam recently, and it’s already cemented itself as one of my favorite Gundam shows and anime in general. But one detail I appreciate is that, even with its Americana setting, it still works in some interesting, immense technological set pieces that give a great sense of scale to the show in the portions where it heads to outer space. To put it bluntly, I appreciate it when science fiction has what I like to call “Big Cool Sci-Fi Stuff,” both for the novelty but also realizing the unique potential the medium has to create a unique sense of wonder.

A key plot point in the middle of Turn A is an orbital base called the Sackträger, which functions as a giant rotating space catapult flying around the Earth that docks and launches ships with enough momentum to overcome the Earth’s gravity and maintain inertia to reach the Moon. It doesn’t feature for many episodes, and in hindsight it mostly exists to set up the need for the journey to the Moon to take some time and thus more episodes.
But as a setpiece on its own, it’s really fun. There’s drama as the ship tries to position itself so the speeding catapult can catch it, which it only manages as Loran and Harry use their mecha to boost the ship’s thrust. The rest of the episode deals with the tension created by two enemy ships being docked so close that neither can risk attacking without destroying the station and thus their chance to get to the moon first. There are even moments where Loran and Sochie explore the size of the station with their mecha, with them and enemy mecha holding on to belted handles to traverse the immense structure. These details make the Sackträger a more unique and even characterized location with its different rules that affect the way the characters act, which also makes the episode more memorable on its own despite the location not getting revisited afterwards.

The show has similar setpieces in the later episodes, from a drifting agricultural colony to giant lunar data pods, and this got me thinking about what these design choices all accomplish; it’s all Big Cool Sci-Fi stuff. Sci-Fi is easy to do as a generic coat of paint where there’s some futuristic vehicles, spaceships, or robots. But one potential that I love, most so with media dealing with space, is the freedom to play around with massive structures and scales, technological or otherwise, that are much harder to do in other genres. Fantasy comes close at points, but visual science fiction has the added benefit of getting to use advanced technology to add to the size of these things that makes them more distinct. Space stations and larger ships, advanced towers and fortresses, natural megastructures, ruins, or even astronomical phenomena like nebulae can all fit under the umbrella of Big Cool Sci Fi Stuff, though from my view it best fits more with technological structures.

A similar anime example that stands out to me is the Sveto city from Heavy Metal L-Gaim. Without getting into too many spoilers, the enemy capital of Sveto is a giant floating city that shifts around the surface of the oceanic planet Gustgal, but it also has huge sprawling foundations and corridors that give off a great sense of scale. Again, there wouldn’t be that much difference to the broad strokes of story if this was just a tech city on a continent, but these facets of its design give a great sense of the city’s technological and size scale.
Big Cool Sci Fi Stuff is fairly common across science fiction and especially mecha anime, from the Zentradi fortress in Macross, and even the Macross itself, the Babylon project in Patlabor, the space elevator in Orguss, the Buff Clan’s Gando Rowa from Ideon, and the Iserholm Forteess from Legend of the Galactic Heroes to name a few. It’s not just any regular space station or structure, but one whose size is made a point within the story and used to stage different situations. The technological-enabled size of all of these structures makes them interesting locations on their own and also gives way to many different aesthetics used to render their scale compared to everything else.

My personal favorite example from growing up was seeing the myriad illustrations from the Terran Trade Authority books at my grandparents’ house. I mostly didn’t bother reading the actual stories or descriptions a lot of the time because I was so enthralled by the detailed and colorful illustrations on their own, and many of them conveyed that sense of wonder to me by how immense these varying spacecraft and stations were.

Aside from just wonder, Big Cool Sci Fi Stuff can also evoke larger feelings of mystery and dread as well. From the immense size and near endless internal rows of the Borg Cubes in Star Trek, the hulking derelict ship at the start of Alien, the unknown giant lenses from Story of your Life/Arrival, or the immense innards of the Citadel in Half Life 2, these all use the smallness of the humans present to instill the size of the forces within that could possibly wipe out mankind. Even the Death Star in Star Wars works on that same logic in-story as a symbol of fear by being a massive, moon-sized station that dwarfs every possible challenger and can annihilate civilizations.
More than anything else, just seeing small humans or even large spacecraft and mecha dwarfed by these towering megastructures is an engaging experience because it’s something far beyond the normal scope of humanity. Even without going into the precise scientific details of how they work, and perhaps not all of them are entirely plausible, the sense of scale alone gives a great sense of wonder that’s really only possible in science fiction. Not every science fiction work needs Big Cool Sci Fi Stuff to achieve wonder on its own, but it’s always something I appreciate whenever it's worked in.
26 notes
·
View notes
Text

Valerie LaVerne Thomas (February 8, 1943) is a scientist and inventor. She invented the illusion transmitter, for which she received a patent in 1980. She was responsible for developing the digital media formats and image processing systems used in the early years of the Landsat program.
She excelled in her mathematics and science courses at Morgan State University and graduated with the highest honors in physics. She went on to work for NASA.
She began working for NASA as a data analyst. She developed real-time computer data systems for satellite operations control centers. She oversaw the creation of the Landsat program, becoming an international expert in Landsat data. Her participation in this program expanded upon the works of other NASA scientists in the pursuit of being able to visualize Earth from space.
She headed a team of approximately 50 people for the Large Area Crop Inventory Experiment, a joint effort with the NASA Johnson Space Center, the National Oceanic, and Atmospheric Administration, and the Department of Agriculture. An unprecedented scientific project, LACIE demonstrated the feasibility of using space technology to automate the process of predicting wheat yield on a worldwide basis.
She obtained the patent for the illusion transmitter, a device that NASA continues to use today. She worked her way up to associate chief of the Space Science Data Operations Office at NASA. Her invention was depicted in a children’s fictional book, television, and video games.
She participated in projects related to Halley’s Comet, ozone research, satellite technology, and the Voyager spacecraft.
She retired from NASA and her position of associate chief of the NASA Space Science Data Operations Office, manager of the NASA Automated Systems Incident Response Capability, and chair of the Space Science Data Operations Office Education Committee. She is credited with being the TRUE creator of 3D imagery. africanhistory365 #africanexcellence
1 note
·
View note
Text
The Ultimate Guide to ESG Investing: Strategies and Benefits
Socio-economic and environmental challenges can disrupt ecological, social, legal, and financial balance. Consequently, investors are increasingly adopting ESG investing strategies to enhance portfolio management and stock selection with a focus on sustainability. This guide delves into the key ESG investing strategies and their advantages for stakeholders.
What is ESG Investing?
ESG investing involves evaluating a company's environmental, social, and governance practices as part of due diligence. This approach helps investors gauge a company's alignment with humanitarian and sustainable development goals. Given the complex nature of various regional frameworks, enterprises and investors rely on ESG data and solutions to facilitate compliance auditing through advanced, scalable technologies.
Detailed ESG reports empower fund managers, financial advisors, government officials, institutions, and business leaders to benchmark and enhance a company's sustainability performance. Frameworks like the Global Reporting Initiative (GRI) utilize globally recognized criteria for this purpose.
However, ESG scoring methods, statistical techniques, and reporting formats vary significantly across consultants. Some use interactive graphical interfaces for company screening, while others produce detailed reports compatible with various data analysis and visualization tools.
ESG Investing and Compliance Strategies for Stakeholders
ESG Strategies for Investors
Investors should leverage the best tools and compliance monitoring systems to identify potentially unethical or socially harmful corporate activities. They can develop customized reporting views to avoid problematic companies and prioritize those that excel in ESG investing.
High-net-worth individuals (HNWIs) often invest in sustainability-focused exchange-traded funds that exclude sectors like weapon manufacturing, petroleum, and controversial industries. Others may perform peer analysis and benchmarking to compare businesses and verify their ESG ratings.
Today, investors fund initiatives in renewable energy, inclusive education, circular economy practices, and low-carbon businesses. With the rise of ESG databases and compliance auditing methods, optimizing ESG investing strategies has become more manageable.
Business Improvement Strategies
Companies aiming to attract ESG-centric investment should adopt strategies that enhance their sustainability compliance. Tracking ESG ratings with various technologies, participating in corporate social responsibility campaigns, and improving social impact through local development projects are vital steps.
Additional strategies include reducing resource consumption, using recyclable packaging, fostering a diverse workplace, and implementing robust cybersecurity measures to protect consumer data.
Encouraging ESG Adoption through Government Actions
Governments play a crucial role in educating investors and businesses about sustainability compliance based on international ESG frameworks. Balancing regional needs with long-term sustainability goals is essential for addressing multi-stakeholder interests.
For instance, while agriculture is vital for trade and food security, it can contribute to greenhouse gas emissions and resource consumption. Governments should promote green technologies to mitigate carbon risks and ensure efficient resource use.
Regulators can use ESG data and insights to offer tax incentives to compliant businesses and address discrepancies between sustainable development frameworks and regulations. These strategies can help attract foreign investments by highlighting the advantages of ESG-compliant companies.
Benefits of ESG Investing Strategies
Enhancing Supply Chain Resilience
The lack of standardization and governance can expose supply chains to various risks. ESG strategies help businesses and investors identify and address these challenges. Governance metrics in ESG audits can reveal unethical practices or high emissions among suppliers.
By utilizing ESG reports, organizations can choose more responsible suppliers, thereby enhancing supply chain resilience and finding sustainable companies with strong compliance records.
Increasing Stakeholder Trust in the Brand
Consumers and impact investors prefer companies that prioritize eco-friendly practices and inclusivity. Aligning operational standards with these expectations can boost brand awareness and trust.
Investors should guide companies in developing ESG-focused business intelligence and using valid sustainability metrics in marketing materials. This approach simplifies ESG reporting and ensures compliance with regulatory standards.
Optimizing Operations and Resource Planning
Unsafe or discriminatory workplaces can deter talented professionals. A company's social metrics are crucial for ESG investing enthusiasts who value a responsible work environment.
Integrating green technologies and maintaining strong governance practices improve operational efficiency, resource management, and overall profitability.
Conclusion
Global brands face increased scrutiny due to unethical practices, poor workplace conditions, and negative environmental impacts. However, investors can steer companies towards appreciating the benefits of ESG principles, strategies, and sustainability audits to future-proof their operations.
As the global focus shifts towards responsible consumption, production, and growth, ESG investing will continue to gain traction and drive positive change.
5 notes
·
View notes
Text
The Intelligent Agricultural Harvesting Robotic System is based on HandsFree Robotics and an open-source system that enables the robots to capture images in real-time through cameras during agricultural production. Supported by deep learning technology, they can accurately recognize and harvest, constantly updating their data, accumulating learning, and becoming "smarter". The intelligent agricultural harvesting robotic system uses LiDAR on a mobile chassis to acquire object position information in an unstructured environment and uses SLAM algorithms to convert the position information into a navigation map of the unstructured environment. Subsequently, the robotic system acquires image data via a camera, processes the image data containing the fruit via a deep learning algorithm, and calculates the approximate location of the fruit. Subsequently, the robot compares the current position with the position of the fruit and sends motion commands to the mobile chassis to move the robot toward the vicinity of the fruit. Next, the position judgment ability of the depth camera is utilized, combined with the visual recognition algorithm, and real-time error correction is achieved through the visual servo algorithm to control the robotic arm to grasp the fruit.
4 notes
·
View notes
Text
Exploring the Future: Emerging Technologies Shaping Our World
The world of technology is in a constant state of evolution, and it's an exciting journey into the future. As we navigate the 21st century, we find ourselves surrounded by emerging technologies that promise to reshape our lives in profound ways. From artificial intelligence (AI) to virtual reality (VR) and beyond, the future is brimming with innovations that hold the potential to transform industries, improve our daily routines, and challenge our perceptions of what's possible. In this blog post, we'll take a closer look at some of these groundbreaking technologies and the impact they may have on our future.
Artificial Intelligence (AI): The Power of Machine Learning
AI, often described as the pinnacle of human achievement in technology, is already making waves across various industries. Machine learning algorithms are becoming increasingly sophisticated, enabling AI systems to analyze vast datasets, make predictions, and perform tasks that were once reserved for human experts. As AI continues to advance, we can expect to see its applications in healthcare, finance, autonomous vehicles, and even creative fields like art and music composition. AI-driven personal assistants and chatbots will become more intelligent and seamlessly integrated into our daily lives, making our interactions with technology more intuitive and efficient.
Virtual Reality (VR) and Augmented Reality (AR): Immersive Experiences
Virtual reality and augmented reality are revolutionizing the way we experience entertainment, education, and even work. VR immerses users in virtual worlds, while AR overlays digital information onto the physical world. These technologies are poised to redefine the way we learn, play, and connect with others. In education, students can explore historical events or distant planets through immersive VR experiences. In healthcare, surgeons can use AR to visualize patient data during surgery. The gaming industry continues to push the boundaries of VR, providing gamers with unparalleled levels of immersion. As hardware becomes more accessible and affordable, VR and AR will undoubtedly become integral parts of our lives.
5G Connectivity: The Backbone of the Internet of Things (IoT)
The rollout of 5G networks is another milestone in our technological journey. With speeds that dwarf those of 4G, 5G will unlock the full potential of the Internet of Things (IoT). Smart cities will become a reality, with connected devices and sensors optimizing everything from traffic flow to energy consumption. Telemedicine will thrive with low-latency connections, enabling remote consultations and surgeries. The way we work will transform, with remote collaboration tools benefiting from seamless, high-speed connectivity.
Sustainable Technology: A Greener Future
As we grapple with the challenges of climate change, technology is stepping up to provide solutions. Renewable energy sources like solar and wind power are becoming more efficient and affordable. Electric vehicles (EVs) are rapidly gaining popularity, and self-driving EVs promise to revolutionize transportation. Innovations in sustainable agriculture, such as vertical farming and precision agriculture, are increasing food production while minimizing environmental impact. These advancements in green technology are crucial steps toward a more sustainable and environmentally friendly future.
Conclusion
The future of technology is bright, filled with promise, and limited only by our imagination. As these emerging technologies become more integrated into our lives, they will undoubtedly bring about profound changes in the way we work, learn, communicate, and interact with the world around us. Embracing these innovations and staying informed about the latest developments will empower us to thrive in the dynamic landscape of the future. So, fasten your seatbelts, because the journey into the future of tech promises to be an exhilarating one, and we're just getting started.
#auto tech#future_tech#technology#tech news#security#tech house#software#retro tech#tips#witch tips#tech
2 notes
·
View notes
Text
A specialist who employs drones to carry out various activities in the agriculture sector is known as an agricultural drone pilot. These jobs may involve:
Crop monitoring: Crops can be inspected by drones for indications of pests, illnesses, or other issues. This can assist farmers in spotting issues as they arise and resolving them before they have a chance to do serious harm.
Precision agriculture: Data collection on crop health, soil quality, and other aspects is possible with drones. Detailed maps and reports that can assist farmers in making better educated decisions regarding their farming techniques can then be produced using this data.
Spraying pesticides and fertilizers: Pesticides and fertilizers may be sprayed on crops more effectively and precisely using drones than with conventional methods. This may facilitate cost and environmental impact reduction
Irrigation management: Drones can be used to monitor irrigation systems and soil moisture levels. As a result, farmers may be able to guarantee that their crops receive the appropriate amount of water without wasting any or generating runoff.
Livestock management: Drones can be used to keep an eye on livestock herds, locate specific animals, and spot ill or hurt animals. This can aid farmers in enhancing the welfare and health of their cattle.
Aside from these particular jobs, agricultural drone operators may also engage in other activities like:
Data analysis: Pilots of agricultural drones frequently need the ability to gather and evaluate data from their aircraft. Creating maps, reports, and other visualizations may include employing specialist software.
Equipment maintenance: Pilots of agricultural drones must be able to properly maintain their aircraft and make sure they are in operational condition.
Safety: Pilots of agricultural drones must be aware of and adhere to all safety guidelines for drone operations.
Pilots of agricultural drones are crucial to the current agriculture sector. Drones can assist farmers in increasing their production, efficiency, and profitability by collecting data and carrying out a variety of jobs.
The following are some advantages of employing agricultural drone pilots:
Increased crop yields: Drones can assist farmers in spotting and resolving issues early on, which may result in higher crop yields.
Cost savings: Using drones can help farms save money on irrigation, fertilizer, and pesticides.
Improved environmental impact: By using fewer pesticides and fertilizers, as well as assisting in the prevention of soil erosion and water runoff, drones can assist farmers in lessening their environmental impact.
Increased safety: Farmers can use drones to accomplish activities that are risky or challenging for humans, such spraying pesticides in difficult-to-reach places.
The demand for agricultural drone pilots is anticipated to rise as the usage of drones in agriculture continues to expand. There are several training and certification programs available if you're interested in a career as an agricultural drone pilot.
1 note
·
View note
Text
Data Science and IoT: A Powerful Combination for Smart Devices
In today’s rapidly advancing digital landscape, the integration of Data Science and the Internet of Things (IoT) is creating smarter, more responsive devices that are transforming industries. From healthcare to agriculture, this dynamic duo is reshaping the way systems operate. For those eager to excel in this innovative domain, enrolling in the best data science training in Hyderabad is a strategic first step toward building a rewarding career in this field.
What is IoT?
The Internet of Things (IoT) refers to a network of physical devices—such as smart appliances, vehicles, wearable gadgets, and industrial tools—embedded with sensors and software that allow them to collect and exchange data over the internet. These connected devices generate vast volumes of real-time data every second.
The Role of Data Science in IoT
Collecting data is just the beginning. Taking the time to analyze and interpret it is where the real power lies.Data Science enables us to make sense of IoT data through:
Statistical Analysis
Machine Learning
Predictive Modeling
Data Visualization
With these tools, Data Scientists can extract insights, detect anomalies, and forecast future outcomes, making smart devices truly “intelligent.”
Key Applications of IoT and Data Science
1. Smart Homes
Smart thermostats, lighting systems, and appliances use data to learn user preferences, optimize energy usage, and enhance convenience.
2. Healthcare and Wearables
Fitness trackers and health monitors collect biometric data. Data Science helps in identifying health trends, predicting medical issues, and improving patient care.
3. Industrial Automation (IIoT)
Sensors in factories collect performance data from machinery. Data analysis helps in preventive maintenance, reducing downtime and boosting productivity.
4. Smart Cities
IoT-enabled traffic lights, surveillance cameras, and waste systems generate data that cities can analyze to improve public services and urban planning.
5. Agriculture
IoT devices track soil conditions, weather, and crop growth. Data Science turns this information into actionable insights to increase agricultural efficiency.
Benefits of Combining Data Science with IoT
Real-Time Decision Making: Systems respond instantly based on live data.
Predictive Analytics: Anticipate problems before they occur.
Automation: Devices adapt and operate autonomously based on data trends.
Operational Efficiency: Reduces costs and enhances productivity across sectors.
The Future of Smart Devices
As more industries adopt smart technologies, the need for professionals who understand both Data Science and IoT will only increase. Innovations such as self-driving cars, AI-powered appliances, and intelligent healthcare systems rely on this integration to function seamlessly.
Conclusion
The convergence of IoT and Data Science is paving the way for a smarter, data-driven future. From everyday devices to complex industrial systems, this powerful combination is revolutionizing how we live and work. To stay ahead in this evolving tech landscape, consider enhancing your skills with expert guidance from SSSIT Computer Education, a trusted name in training tomorrow’s tech leaders.
#best data science training in hyderabad#best data science training in kukatpally#best data science training in KPHB
0 notes