#Geocoded Location
Explore tagged Tumblr posts
Visit Tumblr Blog
Explore Tumblr blogs with no restrictions, modern design and the best experience.
Last Seen Tumblr Blogs


Fun Fact
After the announcement of the deal with Yahoo!, there were 170K signatures of unhappy Tumblr users petitioning to prevent the sale in 2013.
Text
Geolocation in Boosting Retail Industry

Geolocation Technology plays a pivotal role in boosting the growth of the retail industry. Enhanced customer experiences, Targeted marketing, and operational efficiency are key benefits.
1. Personalized Marketing Geolocation allows retailers to send targeted promotions and discounts to customers based on their location. Tailored offers increase customer engagement and drive foot traffic to stores.
2. Location-Based Services Retailers leverage geolocation for services like in-store navigation, helping customers easily find products. This enhances the overall shopping experience and encourages repeat visits.
3. Inventory Management Geolocation assists in tracking inventory across multiple locations. Retailers can optimize stock levels, reduce overstock situations, and enhance supply chain efficiency.
4. Competitive Advantage Retailers gain a competitive edge by analyzing foot traffic patterns. Insights into customer behavior help in optimizing store layouts and making informed decisions on product placement.
5. E-commerce Enhancements Geolocation enables personalized online shopping experiences by recommending products based on the user's location, weather, or local trends.
Conclusion
Geolocation technology is a game-changer for the retail industry, offering a multitude of opportunities to enhance customer engagement, streamline operations, and stay ahead in a competitive market.
0 notes
Text
Here be treasure!
Geocoding provides competitive edge #DataQuality
Geocoding has historically been confined to the geographical information systems (GIS) arena and had limited use within mainstream business. This is changing as the importance of knowing one’s customer’s location is becoming increasingly obvious for marketing, planning and operational purposes. Location information can bring a vast amount of insight to any business – supporting an enhanced…

View On WordPress
0 notes
Text
"In 2019, we told you about a new interactive digital "murder map" of London compiled by University of Cambridge criminologist Manuel Eisner. Drawing on data catalogued in the city coroners' rolls, the map showed the approximate location of 142 homicide cases in late medieval London. It's easy to lose oneself down the rabbit hole of medieval murder for hours, filtering the killings by year, choice of weapon, and location. Think of it as a kind of 14th-century version of Clue: It was the noblewoman's hired assassins armed with daggers in the streets of Cheapside near St. Paul's Cathedral. And that's just the juiciest of the various cases described in a new paper published in the journal Criminal Law Forum.
The noblewoman was Ela Fitzpayne, wife of a knight named Sir Robert Fitzpayne, lord of Stogursey. The victim was a priest and her erstwhile lover, John Forde, who was stabbed to death in the streets of Cheapside on May 3, 1337. “We are looking at a murder commissioned by a leading figure of the English aristocracy," said University of Cambridge criminologist Manuel Eisner, who heads the Medieval Murder Maps project. "It is planned and cold-blooded, with a family member and close associates carrying it out, all of which suggests a revenge motive."
Members of the mapping project geocoded all the cases after determining approximate locations for the crime scenes. Written in Latin, the coroners' rolls are records of sudden or suspicious deaths as investigated by a jury of local men, called together by the coroner to establish facts and reach a verdict. Those records contain such relevant information as where the body was found and by whom; the nature of the wounds; the jury's verdict on cause of death; the weapon used and how much it was worth; the time, location, and witness accounts; whether the perpetrator was arrested, escaped, or sought sanctuary; and any legal measures taken.
A brazen killing
The murder of Forde was one of several premeditated revenge killings recorded in the area of Westcheap. Forde was walking on the street when another priest, Hascup Neville, caught up to him, ostensibly for a casual chat, just after Vespers but before sunset. As they approached Foster Lane, Neville's four co-conspirators attacked: Ela Fitzpayne's brother, Hugh Lovell; two of her former servants, Hugh of Colne and John Strong; and a man called John of Tindale. One of them cut Ford's throat with a 12-inch dagger, while two others stabbed him in the stomach with long fighting knives.
At the inquest, the jury identified the assassins, but that didn't result in justice. “Despite naming the killers and clear knowledge of the instigator, when it comes to pursuing the perpetrators, the jury turn a blind eye,” said Eisner. “A household of the highest nobility, and apparently no one knows where they are to bring them to trial. They claim Ela’s brother has no belongings to confiscate. All implausible. This was typical of the class-based justice of the day.”
Colne, the former servant, was eventually charged and imprisoned for the crime some five years later in 1342, but the other perpetrators essentially got away with it.
Eisner et al. uncovered additional historical records that shed more light on the complicated history and ensuing feud between the Fitzpaynes and Forde. One was an indictment in the Calendar of Patent Rolls of Edward III, detailing how Ela and her husband, Forde, and several other accomplices raided a Benedictine priory in 1321. Among other crimes, the intruders "broke [the prior's] houses, chests and gates, took away a horse, a colt and a boar... felled his trees, dug in his quarry, and carried away the stone and trees." The gang also stole 18 oxen, 30 pigs, and about 200 sheep and lambs.
There were also letters that the Archbishop of Canterbury wrote to the Bishop of Winchester. Translations of the letters are published for the first time on the project's website. The archbishop called out Ela by name for her many sins, including adultery "with knights and others, single and married, and even with clerics and holy orders," and devised a punishment. This included not wearing any gold, pearls, or precious stones and giving money to the poor and to monasteries, plus a dash of public humiliation. Ela was ordered to perform a "walk of shame"—a tamer version than Cersei's walk in Game of Thrones—every fall for seven years, carrying a four-pound wax candle to the altar of Salisbury Cathedral.
Ela outright refused to do any of that, instead flaunting "her usual insolence." Naturally, the archbishop had no choice but to excommunicate her. But Eisner speculates that this may have festered within Ela over the ensuing years, thereby sparking her desire for vengeance on Forde—who may have confessed to his affair with Ela to avoid being prosecuted for the 1321 raid. The archbishop died in 1333, four years before Forde's murder, so Ela was clearly a formidable person with the patience and discipline to serve her revenge dish cold. Her marriage to Robert (her second husband) endured despite her seemingly constant infidelity, and she inherited his property when he died in 1354.
“Attempts to publicly humiliate Ela Fitzpayne may have been part of a political game, as the church used morality to stamp its authority on the nobility, with John Forde caught between masters,” said Eisner. “Taken together, these records suggest a tale of shakedowns, sex, and vengeance that expose tensions between the church and England’s elites, culminating in a mafia-style assassination of a fallen man of god by a gang of medieval hitmen.”
I, for one, am here for the Netflix true crime documentary on Ela Fitzpayne, “a woman in 14th century England who raided priories, openly defied the Archbishop of Canterbury, and planned the assassination of a priest," per Eisner.
The role of public spaces
The ultimate objective of the Medieval Murder Maps project is to learn more about how public spaces shaped urban violence historically, the authors said. There were some interesting initial revelations back in 2019. For instance, the murders usually occurred in public streets or squares, and Eisner identified a couple of "hot spots" with higher concentrations than other parts of London. One was that particular stretch of Cheapside running from St Mary-le-Bow church to St. Paul's Cathedral, where John Forde met his grisly end. The other was a triangular area spanning Gracechurch, Lombard, and Cornhill, radiating out from Leadenhall Market.
The perpetrators were mostly men (in only four cases were women the only suspects). As for weapons, knives and swords of varying types were the ones most frequently used, accounting for 68 percent of all the murders. The greatest risk of violent death in London was on weekends (especially Sundays), between early evening and the first few hours after curfew.
Eisner et al. have now extended their spatial analysis to include homicides committed in York and London in the 14th century with similar conclusions. Murders most often took place in markets, squares, and thoroughfares—all key nodes of medieval urban life—in the evenings or on weekends. Oxford had significantly higher murder rates than York or London and also more organized group violence, "suggestive of high levels of social disorganization and impunity." London, meanwhile, showed distinct clusters of homicides, "which reflect differences in economic and social functions," the authors wrote. "In all three cities, some homicides were committed in spaces of high visibility and symbolic significance."
Criminal Law Forum, 2025. DOI: 10.1007/s10609-025-09512-7 (About DOIs)."
33 notes
·
View notes
Text
Bugs: [teasing Wile E. about coloring in a map] You know, I coulda got you a coloring book at the airport.
Wile E.: I'm creating a topographical map weighing down and geocoding all key locations looking for algorithms.
Bugs: [nods, confused] Yeah, that's exactly what I thought you were doing.
14 notes
·
View notes
Text
Upstream Oil and Gas Production and Community COVID-19 Case and Mortality Rates in California, USA - Published Nov 7, 2024
Wiley's urls never embed correctly.... An interesting study connecting oil and gas production pollution with higher rates of covid 19 mortality.
Abstract Higher concentrations of ambient air pollutants, including PM2.5 and NO2, and other pollutants have been found near active oil and gas wells and may be associated with adverse COVID-19 outcomes. We assessed whether residential exposure to nearby oil and gas production was associated with higher rates of the respiratory infection COVID-19 and related mortality using a population-based ecological study in California. Using gridded population estimates, we estimated area-level exposure to annual average oil and gas production volume from active wells within 1 kilometer (km) of populated areas within census block groups from 2018 to 2020. We geocoded confirmed cases and associated deaths to assess block group case and mortality rates from COVID-19 from February 2020 to January 2021. We fit hierarchical Poisson models with individual and area covariates (e.g., age, sex, socioeconomic disadvantage), and included time and other interactions to assess additional variation (e.g., testing, reporting rates). In the first 4 months of the study period (February–May 2020), block groups in the highest tertile of oil and gas production exposure had 34% higher case rates (IRR: 1.34 95% CI: 1.20, 1.49) and 55% higher mortality rates (MRR: 1.52 95%: CI: 1.14, 2.03) than those with no estimated production, after accounting for area-level covariates. Over the entire study period, we observed moderately higher mortality rates in the highest group (MRR: 1.16 95%: CI: 1.01, 1.33) and null associations for case rates.
Key Points
Using gridded population estimates, we estimated exposure to oil and gas production in areas within 1 km of an active well
We observed higher reported case and mortality rates in areas with higher estimated oil and gas production from February to May 2020
We geocoded COVID-19 cases and deaths to census block groups and estimated age and sex-specific mortality rates from February 2020 to January 2021
Plain Language Summary Exposure to air, noise, light pollution and other localized stressors from active oil and gas drilling may affect the immune and cardiovascular systems and respiratory health, including diseases such as COVID-19. This study reports on COVID-19 case and death rates in communities within 10 km of active oil and gas production. We observed that California communities that were located less than 1 km from an actively producing oil and gas well were more likely to have higher COVID-19 case and death rates in the first 4 months of the pandemic, especially when the level of production was high. Across our entire study time (February 2020–January 2021), we did not observe higher rates of cases or deaths in these communities, except for deaths in communities with the highest amount of production. These results suggest that if there is an effect of oil and gas production on COVID-19 rates, it may be on the number of people that become severely ill; overall, it suggests that more research may help to understand why different communities had different levels of COVID-19.
#mask up#pandemic#public health#wear a mask#covid#wear a respirator#still coviding#covid 19#coronavirus#sars cov 2
4 notes
·
View notes
Video

flickr
O&W Inspection Car por Cornell University Library Por Flickr: Collection: De Forest Douglas Diver Railroad Photographs, ca. 1870 - 1948, Cornell University Library Title: O&W Inspection Car Place: New York (State) Medium: Gelatin silver print Notes: Inspector Car Provenance: Diver, De Forest Douglas, 1878-1958, Collector Finding Aid: rmc.library.cornell.edu/EAD/htmldocs/RMM01948.html Location: 1948/Box 2/Folder 34/26 RMC ID: RMC2004_1034 Persistent URI: hdl.handle.net/1813.001/5xsg There are no known U.S. copyright restrictions on this image. The digital file is owned by the Cornell University Library which is making it freely available with the request that, when possible, the Library be credited as its source. We had some help with the geocoding from Web Services by Yahoo!
3 notes
·
View notes
Text
How Match Data Pro LLC Leverages Fuzzy Matching and Address Matching Software for Precision
In today’s digital-first world, managing data across multiple systems is a massive challenge. Whether it's CRM entries, eCommerce customer data, or third-party databases, discrepancies in records can lead to critical failures in communication, analytics, and decision-making. Match Data Pro LLC solves this with its robust data integration platform, powered by best-in-class fuzzy matching software and specialized address matching software.
With unmatched precision, their advanced fuzzy matching software enables businesses to streamline workflows, eliminate duplication, and unify complex data structures without compromising accuracy or performance.
Why Clean, Matched Data Matters
When you deal with thousands—or millions—of records, even slight variations can create havoc. Imagine these variations:
These seemingly minor inconsistencies can:
Corrupt reporting dashboards
Ruin marketing personalization
Cause delays in order fulfillment or service delivery
Create compliance and legal headaches
That’s why fuzzy and address matching aren’t luxuries anymore. They're necessities.
Advanced Fuzzy Matching Software: Smarter Algorithms, Cleaner Results
Match Data Pro’s advanced fuzzy matching software uses AI-enhanced algorithms that can compare, evaluate, and link records even when traditional exact-match systems fail.
Core Features:
Levenshtein and Jaro-Winkler algorithms for string similarity
Token-based comparison and phonetic matching (Soundex, Metaphone)
Contextual matching using metadata and secondary fields
Custom match rules and confidence scoring
Scalable to millions of records with parallel processing support
This level of intelligence allows companies to:
Identify and resolve duplicate customer profiles
Merge inconsistent vendor or supplier records
Unify transaction history across regions or systems
Address Matching Software: Normalize and Validate Location Data
Addresses are one of the most error-prone data types. Misspellings, abbreviations, or varying formats can result in failed deliveries, bad segmentation, and poor customer experiences.
Match Data Pro’s address matching software ensures location records are not only accurate, but standardized and validated.
Benefits Include:
Auto-correction of common address errors
Standardization based on postal formats (USPS, international)
Real-time validation via third-party APIs
Geocoding for geographic analytics and route planning
Smart linking to customer and order records
The system is ideal for:
eCommerce businesses needing accurate shipping data
Real estate platforms managing multiple listing formats
Government and utilities with citizen address databases
Unified Data Integration Platform: Connect and Clean in One Place
At the heart of Match Data Pro’s solution is a comprehensive data integration platform. It connects your business systems—CRMs, ERPs, eCommerce platforms, and marketing tools—into a single environment where you can clean, match, and optimize data without needing multiple vendors.
Highlights:
ETL (Extract, Transform, Load) pipeline capabilities
Real-time and batch processing
Support for CSV, XML, JSON, and SQL inputs
Drag-and-drop interface for non-technical users
Enterprise-grade security and user permissions
This platform ensures that your data quality efforts are not just a one-time fix, but an ongoing operational advantage.
Who Can Benefit?
Retail & E-commerce: Eliminate duplicate customers and ensure shipping accuracyHealthcare: Match patient records across systems without HIPAA violationsBanking & Finance: Reconcile client profiles and avoid KYC errorsGovernment: Manage clean, standardized citizen data for public servicesLogistics: Validate and plan routes with accurate address information
No matter your industry, if data quality impacts your operations, Match Data Pro has a solution tailored for you.
Final Thoughts: Precision Matching for the Modern Data Ecosystem
Data is only as useful as it is accurate. With Match Data Pro LLC’s smart fuzzy matching software, specialized address matching software, and unified data integration platform, your organization can unlock clean, trusted, and enriched data—ready for analytics, personalization, compliance, and decision-making.
0 notes
Text
☕ Brew Smarter Market Strategies with Starbucks Store Location Data Insights
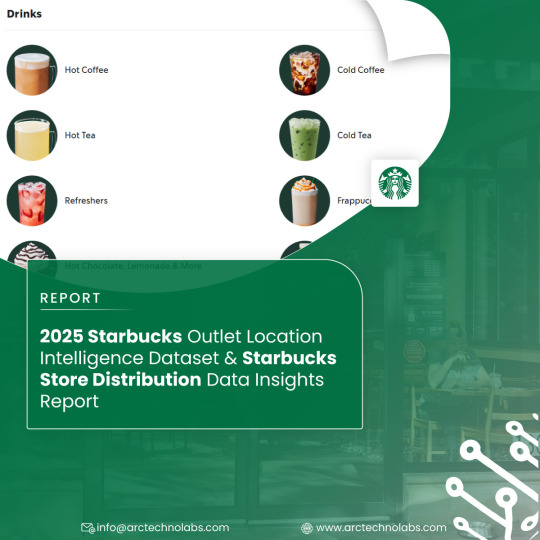
For brands targeting growth in retail and foodservice, understanding store distribution patterns is essential. This Starbucks Store Location Dataset provides detailed insights into global and regional store networks—helping businesses spot market saturation, expansion opportunities, and competitor footprints.
🔍 Key Insights You Can Extract:
Detailed store locations, geocodes & addresses
City, region, and country-level distribution
Store counts per region for benchmarking & competitor analysis
Market expansion trends & white-space opportunities
💡 “Location intelligence is the secret ingredient behind smarter retail growth.”
Perfect for market analysts, franchise consultants, retail strategists, and location planners aiming to fuel data-driven site selection and market planning.
#mobileappscrapingservices#arctechnolabs#webscrapingservices#advancewebscrapingservices#webscrapingapiservices#technology#india#starbucks
0 notes
Text
Regional Grocery Stores: Leading the Way in a Competitive Market
In the bustling arena of retail, regional grocery stores are emerging as pioneers, steering their way through the competitive market with resilience and innovation. These local gems have carved a niche for themselves, offering a unique shopping experience that larger chains often struggle to match. In a world where personalization is key, regional grocery stores have become community hubs, understanding the local needs and preferences of their customers like no other.
Tailored to Local Tastes and Preferences: Unlike large supermarket chains, regional grocery stores have an intimate understanding of the local community's tastes and preferences. They curate their offerings based on the specific needs of the people they serve. Whether it's sourcing fresh produce from local farmers or stocking niche products that resonate with the regional culture, these stores excel in tailoring their inventory to match the local demand.
Emphasis on Personalized Service: Regional grocery stores take customer service to a whole new level. The staff often knows their customers by name, offering personalized recommendations and a friendly, familiar atmosphere. This personalized touch creates a sense of belonging and loyalty, transforming ordinary shopping trips into delightful experiences. In a competitive market, this level of customer engagement is a powerful differentiator.
Community Engagement and Support: Regional grocery stores are deeply rooted in the communities they serve. They sponsor local events, support neighborhood causes, and actively participate in community initiatives. This engagement not only fosters a strong sense of community but also builds trust and credibility. Customers are more inclined to support businesses that actively contribute to the well-being of their local area, giving regional grocery stores a significant advantage.
Agility and Innovation: Regional stores have the agility to adapt swiftly to changing market trends and customer preferences. They can experiment with innovative ideas, introduce new products, and implement feedback-driven changes without the bureaucratic hurdles faced by larger corporations. This flexibility allows them to stay ahead of the curve, offering unique products and services that cater to evolving consumer needs.
In essence, regional grocery stores are not just businesses; they are pillars of community strength and unity. Their ability to understand, engage, and innovate sets them apart in the competitive market, making them not only preferred shopping destinations but also integral parts of the communities they serve. As they continue to lead the way, their impact goes far beyond retail, shaping the social and economic fabric of the regions they call home. #RegionalGroceryStores #CompetitiveMarket #CommunityEngagement #RetailInnovation #LocalBusinesses
0 notes
Text
Global Geospatial Analytics Market – $33B (2024) to $56B by 2029, 11.1% CAGR
Segmentation Overview The geospatial analytics market is segmented by:
Type: Surface & field analytics; Geovisualization; Network analysis; Artificial neural networks; Others
Technology: Remote sensing; GPS; GIS; Others
Solutions: Geocoding & reverse geocoding; Reporting & visualization; Thematic mapping & spatial analysis; Data integration & ETL; Others
Applications: Surveying; Disaster risk reduction & management; Medicine & public safety; Climate change adaptation; Predictive asset management; Others
End-Users: Agriculture; Defense & intelligence; Utilities & communication; Automotive; Government; Travel & logistics; Others
Regions: North America; Latin America; Europe; Asia-Pacific; Middle East & Africa To buy the report, click on https://www.datamintelligence.com/buy-now-page?report=geospatial-analytics-market
Market Size & Forecast
The global geospatial analytics market is projected to expand at a CAGR of 12.8% between 2024 and 2031.
Other projections estimate market growth from USD 32.97 billion in 2024 to USD 55.75 billion by 2029.
A broader estimate values the market at USD 114.3 billion in 2024, expected to reach over USD 226.5 billion by 2030.
Introduction & Definition
Geospatial analytics is the process of gathering, interpreting, and visualizing location-based data—drawn from satellites, GPS, mobile devices, sensors, and social media—using GIS, AI, and computer vision. This powerful fusion helps governments and businesses gain real-time insights into transportation, urban planning, agriculture, disaster response, defense, utilities, and logistics.
Market Drivers & Restraints
Key Drivers:
Smart City Expansion: The proliferation of IoT sensors and connected devices in urban infrastructure drives demand for spatial analytics to manage traffic, utilities, public safety, and emergency planning.
Technological Integration: Advances in AI, 5G, satellite imaging, and edge computing enable high-resolution, real-time spatial decision-making.
Enterprise Adoption: Widespread demand for location intelligence across sectors—such as agriculture, defense, utilities, transportation, and retail—boosts comprehensive geospatial integration.
Restraints:
Privacy & Security: Handling sensitive spatial data raises concerns over surveillance, data protection, and regulatory compliance.
Data Complexity: Integrating varied data sources—maps, sensors, satellite imagery—remains a challenge due to formatting and standardization issues.
Cost & Skills Gap: High initial investment and talent shortages for GIS and AI expertise hinder full-scale adoption.
Segmentation Analysis
By Type: Surface & field analytics lead due to applications in topography, hydrology, and asset monitoring. Geovisualization supports urban planning and stakeholder communication.
By Technology: GIS dominates software solutions; GPS and remote sensing—particularly LiDAR, radar, and GNSS—are key data capture technologies.
By Solutions: Thematic mapping and ETL tools are in high demand for data-driven decisions across utilities, logistics, and infrastructure.
By Applications: Surveying, disaster mitigation, climate adaptation, asset management, medicine, and public safety are major application fields.
By End-Users: Agriculture (precision farming), defense (geospatial intelligence), utilities, transportation, government services, and logistics are top verticals.To get a free sample report, click on https://www.datamintelligence.com/download-sample/geospatial-analytics-market
Geographical Insights
North America: Holds the largest market share (~34% in 2024), driven by government and defense investments, smart cities, and GIS adoption.
Europe: Adoption spans from transport and delivery logistics to environmental tracking; EU programs boost earth observation and AI integration.
Asia-Pacific: Fastest-growing region due to rapid urbanization and expansion in countries like China, India, and Japan.
Middle East & Africa: High growth supported by smart city initiatives and infrastructure investments.
Recent Trends or News
AI-Embedded Spatial Tools: Major GIS platforms are embedding AI and machine learning for predictive analysis.
Mobile Mapping & 3D Scanning: Use of LiDAR-equipped vehicles and drones is increasing rapidly in infrastructure and mapping applications.
Pandemic & Disaster Applications: The pandemic accelerated use of geospatial analytics for vaccine distribution, health mapping, and crisis response.
Competitive Landscape
Leading companies in the geospatial analytics market include:
Microsoft
Google
General Electric (GE)
SAP
Salesforce
Precisely
Oracle
RMSI
OmniSci
Maxar Technologies
Hexagon AB
TomTom
Trimble
Esri
CARTO
Orbital Insight
These companies lead through AI-powered tools, cloud-native GIS, satellite imagery, mobile solutions, and strategic acquisitions.
Impact Analysis
Economic Impact: Geospatial analytics streamlines operations—optimizing routes, reducing resource wastage, and enhancing project ROI.
Environmental Impact: Unlocks data for spatial monitoring—supporting climate modeling, land-use mapping, environmental compliance, and disaster mitigation.
Social Impact: Shapes public health response systems, emergency services, and urban planning, while challenging privacy norms.
Technological Impact: Drives growth in cloud GIS, AI-engineered mapping, real-time analytics, and sensor networks, enabling scalable spatial insights.
Key Developments
GeoAnalytics Engine by Esri: An AI-integrated GIS platform for advanced spatial querying and real-time analytics.
Hexagon Captura Launch: Optical sensor-based system enhancing spatial measurement precision.
CADLM Acquisition by Hexagon: Adds simulation and reliability modeling for enhanced engineering workflows.
Orbital Insight Growth: Enhances satellite-based analytics capabilities through new partnerships and investment.
Report Features & Coverage
This market report includes:
Global and regional market sizing (2018–2024) with forecasts to 2031
In-depth segmentation by type, technology, solution, application, industry, and region
Competitive landscape with company profiling
Key trends, opportunities, and growth challenges
SWOT analysis, Porter’s Five Forces, and market attractiveness index
Recent innovations and investment updates
About Us
We are a global market intelligence firm committed to delivering in-depth insights across emerging technologies. Our expertise in geospatial analytics helps clients unlock data-driven innovation, streamline operations, and improve strategic planning across industries. We provide accurate forecasting, custom reports, and actionable guidance tailored to enterprise and government needs.
Contact Us
Email: [email protected]
Phone: +1 877 441 4866
0 notes
Text
Efficient Naver Map Data Extraction for Business Listings

Introduction
In today's competitive business landscape, having access to accurate and comprehensive business data is crucial for strategic decision-making and targeted marketing campaigns. Naver Map Data Extraction presents a valuable opportunity to gather insights about local businesses, consumer preferences, and market trends for companies looking to expand their operations or customer base in South Korea.
Understanding the Value of Naver Map Business Data
Naver is often called "South Korea's Google," dominating the local search market with over 70% market share. The platform's mapping service contains extensive information about businesses across South Korea, including contact details, operating hours, customer reviews, and location data. Naver Map Business Data provides international and local businesses rich insights to inform market entry strategies, competitive analysis, and targeted outreach campaigns.
However, manually collecting this information would be prohibitively time-consuming and inefficient. This is where strategic Business Listings Scraping comes into play, allowing organizations to collect and analyze business information at scale systematically.
The Challenges of Accessing Naver Map Data
Unlike some other platforms, Naver presents unique challenges for data collection:
Language barriers: Naver's interface and content are primarily Korean, creating obstacles for international businesses.
Complex website structure: Naver's dynamic content loading makes straightforward scraping difficult.
Strict rate limiting: Aggressive anti-scraping measures can block IP addresses that require too many requests.
CAPTCHA systems: Automated verification challenges to prevent bot activity.
Terms of service considerations: Understanding the Legal Ways To Scrape Data From Naver Map is essential.
Ethical and Legal Considerations
Before diving into the technical aspects of Naver Map API Scraping, it's crucial to understand the legal and ethical framework. While data on the web is publicly accessible, how you access it matters from legal and ethical perspectives.
To Scrape Naver Map Data Without Violating Terms Of Service, consider these principles:
Review Naver's terms of service and robots.txt file to understand access restrictions.
Implement respectful scraping practices with reasonable request rates.
Consider using official APIs where available.
Store only the data you need and ensure compliance with privacy regulations, such as GDPR and Korea's Personal Information Protection Act.
Use the data for legitimate business purposes without attempting to replicate Naver's services.
Effective Methods For Scraping Naver Map Business Data
There are several approaches to gathering business listing data from Naver Maps, each with advantages and limitations.
Here are the most practical methods:
1. Official Naver Maps API
Naver provides official APIs that allow developers to access map data programmatically. While these APIs have usage limitations and costs, they represent the most straightforward and compliant Naver Map Business Data Extraction method.
The official API offers:
Geocoding and reverse geocoding capabilities.
Local search functionality.
Directions and routing services.
Address verification features.
Using the official API requires registering a developer account and adhering to Naver's usage quotas and pricing structure. However, it provides reliable, sanctioned access to the data without risking account blocks or legal issues.
2. Web Scraping Solutions
When API limitations prove too restrictive for your business needs, web scraping becomes a viable alternative. Naver Map Scraping Tools range from simple script-based solutions to sophisticated frameworks that can handle dynamic content and bypass basic anti-scraping measures.
Key components of an effective scraping solution include:
Proxy RotationRotating between multiple proxy servers is essential to prevent IP bans when accessing large volumes of data. This spreads requests across different IP addresses, making the scraping activity appear more like regular user traffic than automated collection.Commercial proxy services offer:1. Residential proxies that use real devices and ISPs.2. Datacenter proxies that provide cost-effective rotation options.3. Geographically targeted proxies that can access region-specific content.
Request Throttling Implementing delays between requests helps mimic human browsing patterns and reduces server load. Adaptive throttling that adjusts based on server response times can optimize the balance between collection speed and avoiding detection.
Browser Automation Tools like Selenium and Playwright can control real browsers to render JavaScript-heavy pages and interact with elements just as a human user would. This approach is efficient for navigating Naver's dynamic content loading system.
3. Specialized Web Scraping API Services
For businesses lacking technical resources to build and maintain scraping infrastructure, Web Scraping API offers a middle-ground solution. These services handle the complexities of proxy rotation, browser rendering, and CAPTCHA solving while providing a simple API interface to request data.
Benefits of using specialized scraping APIs include:
Reduced development and maintenance overhead.
Built-in compliance with best practices.
Scalable infrastructure that adapts to project needs.
Regular updates to counter anti-scraping measures.
Structuring Your Naver Map Data Collection Process
Regardless of the method chosen, a systematic approach to Naver Map Data Extraction will yield the best results. Here's a framework to guide your collection process:
1. Define Clear Data Requirements
Before beginning any extraction project, clearly define what specific business data points you need and why.
This might include:
Business names and categories.
Physical addresses and contact information.
Operating hours and service offerings.
Customer ratings and review content.
Geographic coordinates for spatial analysis.
Precise requirements prevent scope creep and ensure you collect only what's necessary for your business objectives.
2. Develop a Staged Collection Strategy
Rather than attempting to gather all data at once, consider a multi-stage approach:
Initial broad collection of business identifiers and basic information.
Categorization and prioritization of listings based on business relevance.
Detailed collection focusing on high-priority targets.
Periodic updates to maintain data freshness.
This approach optimizes resource usage and allows for refinement of collection parameters based on initial results.
3. Implement Data Validation and Cleaning
Raw data from Naver Maps often requires preprocessing before it becomes business-ready.
Common data quality issues include:
Inconsistent formatting of addresses and phone numbers.
Mixed language entries (Korean and English).
Duplicate listings with slight variations.
Outdated or incomplete information.
Implementing automated validation rules and manual spot-checking ensures the data meets quality standards before analysis or integration with business systems.
Specialized Use Cases for Naver Product Data Scraping
Beyond basic business information, Naver's ecosystem includes product listings and pricing data that can provide valuable competitive intelligence.
Naver Product Data Scraping enables businesses to:
Monitor competitor pricing strategies.
Identify emerging product trends.
Analyze consumer preferences through review sentiment.
Track promotional activities across the Korean market.
This specialized data collection requires targeted approaches that navigate Naver's shopping sections and product detail pages, often necessitating more sophisticated parsing logic than standard business listings.
Data Analysis and Utilization
The actual value of Naver Map Business Data emerges during analysis and application. Consider these strategic applications:
Market Penetration AnalysisBy mapping collected business density data, companies can identify underserved areas or regions with high competitive saturation. This spatial analysis helps optimize expansion strategies and resource allocation.
Competitive BenchmarkingAggregated ratings and review data provide insights into competitor performance and customer satisfaction. This benchmarking helps identify service gaps and opportunities for differentiation.
Lead Generation and OutreachFiltered business contact information enables targeted B2B marketing campaigns, partnership initiatives, and sales outreach programs tailored to specific business categories or regions.
How Retail Scrape Can Help You?

We understand the complexities involved in Naver Map API Scraping and the strategic importance of accurate Korean market data. Our specialized team combines technical expertise with deep knowledge of Korean digital ecosystems to deliver reliable, compliance-focused data solutions.
Our approach to Naver Map Business Data Extraction is built on three core principles:
Compliance-First Approach: We strictly adhere to Korean data regulations, ensuring all activities align with platform guidelines for ethical, legal scraping.
Korea-Optimized Infrastructure: Our tools are designed for Korean platforms, offering native language support and precise parsing for Naver’s unique data structure.
Insight-Driven Delivery: Beyond raw data, we offer value-added intelligence—market insights, tailored reports, and strategic recommendations to support your business in Korea.
Conclusion
Harnessing the information available through Naver Map Data Extraction offers significant competitive advantages for businesses targeting the Korean market. Organizations can develop deeper market understanding and more targeted business strategies by implementing Effective Methods For Scraping Naver Map Business Data with attention to legal compliance, technical best practices, and strategic application.
Whether you want to conduct market research, generate sales leads, or analyze competitive landscapes, the rich business data available through Naver Maps can transform your Korean market operations. However, the technical complexities and compliance considerations make this a specialized undertaking requiring careful planning and execution.
Need expert assistance with your Korean market data needs? Contact Retail Scrape today to discuss how our specialized Naver Map Scraping Tools and analytical expertise can support your business objectives.
Source : https://www.retailscrape.com/efficient-naver-map-data-extraction-business-listings.php
Originally Published By https://www.retailscrape.com/
#NaverMapDataExtraction#BusinessListingsScraping#NaverBusinessData#SouthKoreaMarketAnalysis#WebScrapingServices#NaverMapAPIScraping#CompetitorAnalysis#MarketIntelligence#DataExtractionSolutions#RetailDataScraping#NaverMapBusinessListings#KoreanBusinessDataExtraction#LocationDataScraping#NaverMapsScraper#DataMiningServices#NaverLocalSearchData#BusinessIntelligenceServices#NaverMapCrawling#GeolocationDataExtraction#NaverDirectoryScraping
0 notes
Text
🔍 Unlock Strategic Insights with Sainsbury’s UK Store Location Data
In today's competitive retail landscape, having access to comprehensive store location data is crucial for informed decision-making. RealDataAPI offers a meticulously curated dataset of Sainsbury’s store locations across the UK, updated as of June 4, 2025.
This dataset includes essential information such as geocoded addresses, phone numbers, and store statuses, enabling businesses to:
Identify optimal locations for new store openings
Analyze market saturation and competitor presence
Enhance supply chain and logistics planning
Tailor marketing strategies to specific regions
Whether you're in retail expansion, market analysis, or strategic planning, this dataset serves as a valuable resource to drive growth and efficiency.
0 notes
Text
How Transport Management System Revolutionizes Delivery Accuracy and Customer Experience in the Middle East
The logistics landscape of the Middle East is as vibrant as the region’s fast-emerging economies. The Middle East has busy downtown areas like Dubai and Riyadh, as well as large rural spaces. This region presents unique challenges and opportunities for companies that want to deliver efficiently and accurately. In an age where speed and transparency expectations from the customer are taking off, a solid Transport Management System (TMS) is no longer an indulgence but a basic requirement for enhancing delivery precision and taking the customer experience to new heights.
The TMS Solution: Transforming Delivery Operation
A transport management system offers the cyber infrastructure to overcome these difficulties and to greatly enhance delivery precision. Here’s why:
Smart Route Optimization: Finding the shortest path is common in old systems. A modern transport management system uses real-time traffic data. It also looks at past delivery trends and driver availability. This helps create the best routes. They have unspecific addresses with advanced geocoding, so drivers can easily get to the destination. Dynamic rerouting helps the system deal with unexpected delays, like traffic or accidents. It guides drivers to a new route while keeping the delivery schedule on track.
Real-Time Visibility and Tracking: This is probably the most critical capability of delivery accuracy. A TMS offers end-to-end visibility by shipment. Dispatchers are provided with real-time location of the vehicle, driver, and delivery status on a computerized dashboard. Such preemptive monitoring enables intervention at one go in the event of deviation or delay, averting trouble ahead.
Automated Load Planning and Dispatch: Planning manually takes too much time and is human error. With a TMS, trip planning is done automatically with intelligent clustering of deliveries by destination, weight, and volume. It makes the best use of vehicles, cuts down on empty miles, and improves delivery grouping. This leads to more deliveries per shift and fewer missed attempts.
Digital Proof of Delivery (POD): Skipping paper POD, a Transport Management System allows drivers to digitally sign, capture images, and even describe failed deliveries using handheld devices. This gives immediate, precise proof of delivery, lowers contention, and simplifies billing.
Accurate deliveries are the foundation of an exceptional customer experience—crucial in today’s competitive business environment.
Proactive Communication: With real-time visibility, a Transport Management System can push automated email or SMS notifications to customers at each point of the delivery experience—from dispatch through “driver on the way” and successful delivery. This transparency gives assurance and allays fears, reducing incoming customer service calls.
Accurate ETAs: With real-time information and predictive analysis, a transport management system provides very accurate estimated times of arrival (ETAs). Customers prefer to be able to know exactly when their package will arrive so that they can better plan their day.
Self-Service Tracking: Branded customer portals allow the receiver to track their shipments themselves, eliminating the need for customer service calls for status.
Fewer Missed Deliveries: By streamlining routes and providing real-time driving directions, a TMS minimizes missed delivery attempts by removing the frustration of packages that never arrive and the hassle of rescheduling redelivery appointments.
Flexible Delivery Choices: Some advanced TMS software programs are even capable of offering customers the option of rescheduling or rerouting to a different pick-up site, providing greater convenience and control.
Middle East-Wide Benefits of TMS
How Transport Management System is adding value to Middle East Logistics
Cost Savings: The optimized routes result in lower fuel consumption. Increased efficiency provides the ability to make more deliveries using an equivalent number of vehicles, potentially minimizing the need for fleet growth. Fewer errors and conflicts also translate into fewer operating costs.
Scalability: As Middle East e-commerce continues to grow at an ever-faster rate, a cloud-based TMS can only be scaled to accommodate higher volumes of orders without incurring significant infrastructure expense.
Greater Compliance: A TMS is able to manage border problems and customs documentation and offer home regulation conformity.
Data-Driven Insights: The platform collects massive amounts of data about delivery performance, driver behavior, and route optimization. It uses this data to identify bottlenecks, improve processes even more, and make data-driven business decisions.
Conclusion
In the Middle East, the logistics industry is changing quickly. It is now important to invest in a good transport management system. This investment is essential for success. With the promise of real-time location, intelligent route optimization, and automated processes, a transport management system empowers businesses with the potential to overcome geographical challenges, significantly improve the accuracy of deliveries, and, most importantly, deliver a better customer experience. Its implementation is the window to achieving efficiency, profitability, and sustainable growth in the region’s ever-changing marketplace. https://www.instagram.com/quickmovetechnologies/
#transportmanagementsystem#freightforwarding#freight#quickmovetechnologies#warehousemanagementsystem
0 notes
Text
Location Analytics Market Size, Share, Trends, Demand, Future Growth, Challenges and Competitive Analysis
"Global Location Analytics Market - Size, Share, Demand, Industry Trends and Opportunities
Global Location Analytics Market, By Component (Solutions and Services), Solution (Geocoding and Reverse Geocoding, Data Integration and ETL, Reporting and Visualization, Thematic Mapping and Spatial Analysis and Others), Service (Consulting, Integration and Deployment and Support and Maintenance), Location Type (Indoor Location and Outdoor Location), Application (Risk Management, Emergency Response Management, Customer Experience Management, Remote Monitoring, Supply Chain Planning and Optimization, Sales and Marketing Optimization, Location Selection and Optimization and Others), Vertical (Retail, Manufacturing, Government and Defence, Media and Entertainment, Transportation and Logistics, Energy and Utilities, Telecom and IT, Education and Others), Country (U.S., Canada, Mexico, Brazil, Argentina, Rest of South America, Germany, France, Italy, U.K., Belgium, Spain, Russia, Turkey, Netherlands, Switzerland, Rest of Europe, Japan, China, India, South Korea, Australia, Singapore, Malaysia, Thailand, Indonesia, Philippines, Rest of Asia-Pacific, U.A.E, Saudi Arabia, Egypt, South Africa, Israel, Rest of Middle East and Africa) Industry Trends
Access Full 350 Pages PDF Report @
**Segments**
- **By Component:** The location analytics market can be segmented based on components into software and services. Software encompasses various applications and tools used for location-based services and analysis. Services include consulting, maintenance, and training provided by vendors to their clients for effectively utilizing location analytics solutions.
- **By Location Type:** Location analytics solutions can also be segmented by location type, including indoor and outdoor. Indoor location analytics focus on analyzing data within closed environments like shopping malls, airports, and stadiums. Outdoor location analytics, on the other hand, deal with analyzing data in open spaces like cities, rural areas, and transportation systems.
- **By Application:** This market segment categorizes location analytics based on its application across various industries. Applications include spatial analysis, risk management, emergency response, customer behavior analysis, asset tracking, and others. Each application caters to the specific needs of the industry it serves, providing valuable insights through location-based data analysis.
**Market Players**
- **Google LLC:** Google offers location analytics solutions through its Google Maps platform, providing businesses with mapping, geocoding, and location-based services. With its vast user base and rich data repository, Google is a key player in the location analytics market.
- **Esri:** Esri specializes in geographic information system (GIS) software and location intelligence solutions. Its ArcGIS platform offers a comprehensive suite of tools for location analytics, catering to industries like urban planning, natural resource management, and public safety.
- **HERE Technologies:** HERE Technologies provides location data and platform services for mapping, navigation, and location-based analytics. Its solutions enable businesses to optimize logistics, enhance customer experiences, and make data-driven decisions using location insights.
- **TomTom International BV:** TomTom offers location-based technologies for automotive, enterprise, and consumer applications. Its mapping, traffic, and navigation services are utilized for location analytics purposes, helping businesses improve operational efficiency and strategic planning.
- **Pitney Bowes Inc.:** Pitney Bowes combines locationPitney Bowes Inc. is a significant player in the location analytics market, offering a wide range of location-based services and solutions to businesses. The company's location intelligence capabilities help organizations leverage geospatial data for enhanced decision-making and operational efficiencies across various industries. Pitney Bowes' spectrum of services includes location data management, geocoding, spatial analytics, and mapping solutions that empower businesses to gain valuable insights from location-based data. With a focus on driving innovation and providing reliable location intelligence tools, Pitney Bowes is poised to meet the evolving needs of businesses looking to incorporate location analytics into their operations.
Pitney Bowes leverages its expertise in location technology to help businesses across sectors optimize their supply chain operations, enhance customer engagement, and improve overall business performance. By integrating location analytics into their strategies, organizations can gain a deeper understanding of geographical trends, customer preferences, and market dynamics. Pitney Bowes' solutions enable businesses to visualize and analyze location-based data effectively, leading to informed decision-making and a competitive edge in their respective industries.
In a highly competitive market landscape, Pitney Bowes differentiates itself by offering comprehensive location intelligence solutions tailored to meet the diverse needs of businesses of all sizes. The company's commitment to innovation and continual enhancement of its location analytics offerings positions it as a trusted partner for organizations seeking to harness the power of spatial data for strategic advantage. By providing a robust suite of location-based services and technologies, Pitney Bowes equips businesses with the tools they need to extract actionable insights from location data and drive business growth.
Pitney Bowes' dedication to delivering reliable and accurate location analytics solutions has earned the company a strong reputation in the market. With a focus on driving customer success and fostering long-term partnerships, Pitney Bowes continues to innovate and expand its portfolio of location intelligence offerings to address the evolving needs of businesses in an increasingly data-driven world. As organizations increasingly recognize the value of location-based insights in driving operational efficiencies and enhancing decision**Global Location Analytics Market**
- **By Component (Solutions and Services)** - **Solution (Geocoding and Reverse Geocoding, Data Integration and ETL, Reporting and Visualization, Thematic Mapping and Spatial Analysis, and Others)** - **Service (Consulting, Integration and Deployment, and Support and Maintenance)** - **Location Type (Indoor Location and Outdoor Location)** - **Application (Risk Management, Emergency Response Management, Customer Experience Management, Remote Monitoring, Supply Chain Planning and Optimization, Sales and Marketing Optimization, Location Selection and Optimization, and Others)** - **Vertical (Retail, Manufacturing, Government and Defence, Media and Entertainment, Transportation and Logistics, Energy and Utilities, Telecom and IT, Education, and Others)** - **Country (U.S., Canada, Mexico, Brazil, Argentina, Rest of South America, Germany, France, Italy, U.K., Belgium, Spain, Russia, Turkey, Netherlands, Switzerland, Rest of Europe, Japan, China, India, South Korea, Australia, Singapore, Malaysia, Thailand, Indonesia, Philippines, Rest of Asia-Pacific, U.A.E, Saudi Arabia, Egypt, South Africa, Israel, Rest of Middle East and Africa)**
The global location analytics market is witnessing significant growth, driven by the increasing adoption of location-based services across various industries. The market is segmented based on components into software and services, offering a range of solutions for analyzing location data effectively. Businesses are leveraging location analytics for spatial analysis
The report provides insights on the following points:
Market Penetration: Comprehensive information on the product portfolios of the top players in the Location Analytics Market.
Product Development/Innovation: Detailed insights on the upcoming technologies, R&D activities, and product launches in the market.
Competitive Assessment: In-depth assessment of the market strategies, geographic and business segments of the leading players in the market.
Market Development: Comprehensive information about emerging markets. This report analyzes the market for various segments across geographies.
Market Diversification: Exhaustive information about new products, untapped geographies, recent developments, and investments in the Location Analytics Market.
Table of Content:
Section 01: Executive Summary
Section 02: Scope of The Report
Section 03: Research Methodology
Section 04: Introduction
Section 05: Market Landscape
Section 06: Market Sizing
Section 07: Five Forces Analysis
Section 08: Market Segmentation by Product
Section 09: Market Segmentation by Application
Section 10: Customer Landscape
Section 11: Market Segmentation by End-User
Section 12: Regional Landscape
Section 13: Decision Framework
Section 14: Drivers and Challenges
Section 15: Market Trends
Section 16: Competitive Landscape
Section 17: Company Profiles
Section 18: Appendix
The following are the regions covered in this report.
North America [U.S., Canada, Mexico]
Europe [Germany, UK, France, Italy, Rest of Europe]
Asia-Pacific [China, India, Japan, South Korea, Southeast Asia, Australia, Rest of Asia Pacific]
South America [Brazil, Argentina, Rest of Latin America]
The Middle East & Africa [GCC, North Africa, South Africa, Rest of the Middle East and Africa]
This study answers to the below key questions:
What are the key factors driving the Location Analytics Market?
What are the challenges to market growth?
Who are the key players in the Location Analytics Market?
What are the market opportunities and threats faced by the key players?
Browse Trending Reports:
Porcine Vaccines Market Polyimide Films Market Lentil Protein Market Dairy and Ruminants Disinfectants Market Speciality Malts Market Dairy Flavors Market Mobile Money Market Aquatic Feed Enzymes Market Nursing and Residential Care Market Garage and Service Station Market Agriculture Biological Control Agents Market Light-Emitting Diode (LED) Probing and Testing Equipment Market
About Data Bridge Market Research:
Data Bridge set forth itself as an unconventional and neoteric Market research and consulting firm with unparalleled level of resilience and integrated approaches. We are determined to unearth the best market opportunities and foster efficient information for your business to thrive in the market. Data Bridge endeavors to provide appropriate solutions to the complex business challenges and initiates an effortless decision-making process.
Contact Us:
Data Bridge Market Research
US: +1 614 591 3140
UK: +44 845 154 9652
APAC : +653 1251 975
Email: [email protected]"
0 notes
Text
How Address Matching and Entity Resolution Software Is Revolutionizing Modern Data Management
In today’s data-centric economy, businesses must deal with a flood of information from various sources — customer databases, CRM systems, marketing tools, and more. However, when this data is inconsistent, duplicated, or misaligned, it can disrupt operations, cause compliance issues, and negatively affect customer experiences. That’s where advanced tools like Address Matching Software, Entity Resolution Software, and Data Management Software come into play.
Match Data Pro LLC is at the forefront of data integration and quality, offering intelligent tools that help organizations turn fragmented data into unified, reliable information. Let’s explore how these solutions work and why they are crucial for any business that relies on clean, actionable data.
The Challenge of Dirty and Disconnected Data
Data quality problems often stem from:
Typographical errors in names or addresses
Variations in data formats across systems
Duplicate entries for the same customer or entity
Incomplete or outdated records
These challenges lead to confusion, wasted resources, poor customer service, and flawed analytics. Moreover, regulatory compliance and data governance become nearly impossible when data integrity is compromised.
The Role of Address Matching Software
Address Matching Software is a specialized tool that standardizes, validates, and matches address data across multiple records or databases. For example, “123 Main Street Apt. 5” and “123 Main St #5” may refer to the same location but appear differently in systems. This software ensures that all variations are recognized as a single, accurate address.
Key Features:
Standardization: Formats addresses according to local postal guidelines.
Validation: Verifies addresses using official postal data.
Geocoding: Converts addresses into geographic coordinates for advanced mapping.
Deduplication: Identifies and merges duplicate address records.
For businesses in logistics, e-commerce, and finance, address matching is essential for timely deliveries, targeted marketing, and fraud prevention.
What is Entity Resolution Software?
While address matching focuses on physical locations, Entity Resolution Software (ERS) deals with identifying and linking different records that refer to the same real-world entity — such as a person, company, or product — even when the data doesn’t match exactly.
For instance, the records “Jon A. Smith,” “J. Smith,” and “Jonathan Smith” might all represent the same individual. ERS uses advanced algorithms to detect these connections based on attributes like name, address, email, phone number, and more.
Core Capabilities:
Fuzzy Matching Algorithms: Detects variations and misspellings.
Custom Matching Rules: Adjusted to your specific industry or dataset.
Confidence Scoring: Assigns match probability to suggest potential duplicates.
Golden Record Creation: Generates a single, trusted version of an entity.
By eliminating redundancies and resolving identity conflicts, entity resolution software enables more accurate reporting, better customer experiences, and streamlined operations.
Why Data Management Software Matters
While address and entity resolution tools solve specific data quality issues, Data Management Software provides a comprehensive approach to maintaining and leveraging high-quality data.
This software acts as a central hub where businesses can:
Import and unify data from multiple systems
Clean, standardize, and validate datasets
Track data changes and maintain audit logs
Monitor data quality with real-time dashboards
Enforce governance policies and ensure regulatory compliance
Match Data Pro LLC’s data management platform integrates seamlessly with other enterprise tools and APIs, offering scalable solutions tailored to your industry needs.
Use Cases Across Industries
Retail & E-commerce
Ensure consistent customer profiles across platforms, personalize offers, and reduce cart abandonment with accurate address and identity data.
Financial Services
Identify fraudulent activity by resolving identity mismatches and ensure compliance with KYC (Know Your Customer) regulations.
Healthcare
Consolidate patient records across hospitals, labs, and clinics to improve care coordination and reduce billing errors.
Government
Link citizen records from various departments to deliver efficient public services and prevent identity duplication.
Benefits of Using Match Data Pro LLC’s Solutions
Improved Accuracy: Say goodbye to duplicate records and inconsistent data.
Better Decision-Making: Reliable data leads to smarter, more confident decisions.
Enhanced Customer Experience: Deliver personalized, error-free service.
Regulatory Compliance: Meet GDPR, HIPAA, and other global data regulations.
Cost Savings: Reduce waste caused by errors and duplicated efforts.
Whether you’re a growing startup or a large enterprise, investing in intelligent data tools pays off in operational efficiency and business growth.
Final Thoughts
In an increasingly digital and data-dependent world, organizations must go beyond basic data entry and embrace smart tools like Address Matching Software, Entity Resolution Software, and Data Management Software to maintain a competitive edge.
Match Data Pro LLC delivers state-of-the-art solutions that make your data smarter, cleaner, and more valuable. It’s time to unlock the full potential of your business data and make informed decisions with confidence.
Ready to upgrade your data strategy? Contact Match Data Pro LLC today and see how accurate data can transform your business performance.
0 notes