#Pentaho Data Integration & Analytics
Explore tagged Tumblr posts
Visit Tumblr Blog
Explore Tumblr blogs with no restrictions, modern design and the best experience.
Last Seen Tumblr Blogs


Fun Fact
Tumblr posted its first advertisements in May 2012 and subsequently earned $13M in revenue.
Text
Pentaho Data Integration & Analytics: Expert Consulting by Helical IT Solutions
What Is Pentaho Data Integration (PDI)?
Pentaho Data Integration (PDI), also known as Kettle, is an open-source ETL (Extract, Transform, Load) tool designed to help organizations manage data workflows efficiently. Acquired by Pentaho in 2005, Kettle evolved into PDI, with both a freely available community edition and a more feature-rich enterprise version.
While the community version is suitable for basic ETL tasks, the enterprise edition of PDI offers enhanced features such as scalability, advanced security, real-time data processing, and integration with enterprise data platforms. This makes it the perfect option for settings with a lot of data and complexity.
Pentaho offers PDI as part of its Business Intelligence (BI) suite, enabling end-to-end data operations such as: Data cleaning and transformation, Data migration between databases or systems, Bulk data loading and processing, Data quality enforcement, Governance and compliance
Organizations looking to implement or scale these capabilities often rely on Pentaho data integration consulting services to ensure efficient architecture, optimized workflows, and successful deployment.
PDI consists of several core components that support various stages of the ETL process:
Spoon – A visual design tool for ETL developers to build data transformations (data flows) and jobs (execution workflows).
Pan – A command-line utility used to execute transformations created in Spoon.
Kitchen – Executes jobs designed in Spoon from the command line or automated scripts.
Carte – A lightweight web server for remotely executing and monitoring ETL jobs.
With its modular architecture and strong community support, PDI is a leading choice for businesses looking to build scalable and automated data pipelines. Helical IT Solutions offers expert Pentaho data integration consulting services to help organizations implement, customize, and optimize PDI for their specific data environments.
Why Choose Pentaho for Data Integration and Analytics?
Pentaho Data Integration (PDI) is a powerful and flexible ETL platform that helps organizations unify, transform, and analyse data from multiple sources. With support for cloud, big data, and traditional systems, Pentaho enables end-to-end data workflows—from ingestion to insightful dashboards.
Businesses choose Pentaho because it offers:
A user-friendly, visual interface for designing data pipelines
Tight integration with business intelligence and reporting tools
Scalable support for real-time and batch processing
Flexible deployment (on-premises, cloud, or hybrid)
Open-source extensibility with enterprise-grade features
Pentaho becomes a complete solution for building modern, efficient, and customized data architectures tailored to your business needs.
Common Data Challenges Businesses Face Without a Proper ETL Solution
Many businesses struggle with data chaos stemming from disparate sources, inconsistent formats, and a lack of proper data governance. Without a robust ETL (Extract, Transform, Load) solution, they face challenges like:
Inaccurate Reporting: Relying on manual processes or partial data leads to flawed insights and poor decision-making.
Operational Inefficiencies: Time is wasted on data reconciliation and cleaning, diverting resources from core business activities.
Limited Scalability: Growing data volumes overwhelm existing systems, hindering expansion and agility.
Data Silos: Critical information remains isolated, preventing a unified view of the business.
Compliance Risks: Difficulty in tracking and auditing data can lead to regulatory non-compliance.
These issues directly impact profitability and growth. This is where a powerful ETL tool like Pentaho Data Integration & Analytics becomes crucial.
How Helical IT Solutions Enhances Your Pentaho Implementation
While Pentaho Data Integration & Analytics is a powerful tool, maximizing its potential requires specialized expertise. Helical IT Solutions elevates your Pentaho implementation by offering:
Deep Pentaho Expertise: Our certified consultants possess extensive experience across the entire Pentaho suite (PDI, Analyzer, Report Designer, etc.), ensuring you leverage every feature.
Tailored Solutions: We don't just implement; we customize Pentaho to perfectly align with your unique business needs, data sources, and analytical goals.
End-to-End Services: From initial consultation and data strategy to development, integration, migration, support, and training, we cover the full project lifecycle.
Optimized Performance: We focus on building efficient data pipelines, optimizing performance, and ensuring data quality for accurate, timely insights.
Cost-Effective Implementation: As a Pentaho partner with a strong track record, we deliver high-quality solutions that maximize your ROI and minimize overhead.
What Helical IT Solutions Offers
Certified Pentaho consulting and development
Pentaho Data Integration (Kettle) services
Pentaho Report Designer (PRPT) and dashboard development
Embedding Pentaho analytics in web applications
SSO, high availability, and load balancing setup
OLAP schema modelling and advanced analytics
End-to-end implementation, training, and post-deployment support
Helical IT Solutions delivers expert Pentaho consulting and implementation services, enabling businesses to unlock the full potential of their data integration and analytics initiatives with tailored, scalable, and reliable solutions
Why Helical IT Solutions Is the Right Pentaho Partner for You
With years of hands-on experience in implementing Pentaho Data Integration across industries, Helical IT Solutions brings the technical expertise, flexibility, and client-first approach needed for successful data projects. We focus on delivering custom, scalable, and cost-effective solutions—whether you're starting from scratch or optimizing an existing setup.
Our deep understanding of both community and enterprise editions, combined with a strong track record in ETL, BI, and analytics, makes us a trusted partner for businesses looking to turn data into actionable insights.
Contact Us for Expert Pentaho Consulting Services
Contact Helical IT Solutions for a demo, client references, or to discuss your requirements:
Email: [email protected] | [email protected]
Phone: +91-7893947676
Experience the difference of working with a dedicated Pentaho partner focused on your success.
0 notes
Text
What does AIV stand for in data analytics?
In the context of data analytics, AIV stands for Active Intelligence Visualization. It’s a powerful, AI-driven business intelligence platform that empowers organizations to gain real-time insights and make data-driven decisions through interactive dashboards, automated reporting, and smart data visualizations.
AIV supports AI assistants, known as AIV Buddies, that simplify data visualization, automate SQL generation, and streamline dashboard creation. Additionally, AIV integrates seamlessly with open-source tools like BIRT, Jasper Reports, and Pentaho, offering customizable dashboards that make analytics faster, smarter, and accessible for users at all levels.
Explore the full capabilities of AIV in our official documentation: AIV Documentation
Need help? Contact us at

0 notes
Text
Connected Device Analytics Market Evolution, Emerging Trends, and Forecast 2032
TheConnected Device Analytics Market Size was valued at USD 26.94 Billion in 2023 and is expected to reach USD 173.96 Billion by 2032 and grow at a CAGR of 23.0% over the forecast period 2024-2032
The Connected Device Analytics Market is experiencing rapid expansion as businesses and industries increasingly rely on IoT-driven data insights. With billions of connected devices generating vast amounts of real-time data, organizations are leveraging analytics to enhance efficiency, improve decision-making, and drive innovation. Growing demand for predictive analytics, AI-driven insights, and real-time monitoring is propelling this market forward.
The Connected Device Analytics Market continues to evolve as industries such as healthcare, manufacturing, retail, and smart cities integrate IoT devices into their operations. The ability to process, analyze, and derive actionable insights from connected devices is revolutionizing business models. As digital transformation accelerates, the demand for sophisticated analytics solutions that provide enhanced security, automation, and data-driven intelligence is expected to surge.
Get Sample Copy of This Report: https://www.snsinsider.com/sample-request/3727
Market Keyplayers:
Microsoft (US) (Azure IoT, Power BI)
Oracle Corporation (US) (Oracle IoT Cloud, Oracle Analytics Cloud)
IBM Corporation (US) (IBM Watson IoT, IBM Cognos Analytics)
SAP SE (Germany) (SAP Leonardo IoT, SAP Analytics Cloud)
PTC (US) (ThingWorx, Kepware)
Cisco (US) (Cisco Kinetic, Cisco Jasper)
Google (US) (Google Cloud IoT Core, Google BigQuery)
SAS Institute (US) (SAS IoT Analytics, SAS Visual Analytics)
Adobe (US) (Adobe Analytics, Adobe Sensei)
Teradata (US) (Teradata Vantage, Teradata IoT Analytics)
AWS (US) (AWS IoT Analytics, Amazon QuickSight)
HPE (US) (HPE Edgeline, HPE Vertica)
Hitachi (Japan) (Hitachi Lumada, Pentaho)
Software AG (Germany) (Cumulocity IoT, TrendMiner)
GE (US) (GE Digital Predix, GE APM (Asset Performance Management))
Cloudera (US) (Cloudera DataFlow, Cloudera Machine Learning)
Guavus (US) (Guavus AI-based Analytics, Guavus Reflex)
Splunk (US) (Splunk Industrial IoT, Splunk Enterprise)
TIBCO Software (US) (TIBCO Spotfire, TIBCO Streaming)
Qlik (US) (Qlik Sense, Qlik Data Integration)
Salesforce (US) (Salesforce IoT Cloud, Tableau)
Infor (US) (Infor IoT, Infor Birst)
Mnubo (Canada) (Mnubo SmartObjects, Mnubo Data Science Studio)
Arundo Analytics (US) (Arundo Edge, Arundo Analytics Platform)
Key Trends Driving Market Growth
1. Rise of Edge Computing and AI-Driven Analytics
With the increasing number of IoT devices, edge computing has emerged as a crucial trend. Organizations are leveraging AI-driven analytics at the edge to process data closer to the source, reducing latency and enhancing real-time decision-making. This approach enables faster responses in critical applications such as healthcare, autonomous vehicles, and industrial automation.
2. Expansion of Predictive and Prescriptive Analytics
Businesses are shifting from traditional descriptive analytics to predictive and prescriptive analytics to anticipate trends and optimize operations. Connected devices equipped with advanced analytics capabilities can forecast equipment failures, monitor energy usage, and improve supply chain efficiency, significantly reducing operational costs.
3. Growing Adoption of 5G Connectivity
The rollout of 5G networks is significantly enhancing the capabilities of connected devices. With ultra-low latency and high-speed data transfer, 5G enables seamless real-time analytics, making applications like smart cities, autonomous vehicles, and remote healthcare monitoring more efficient and reliable.
4. Increasing Focus on Cybersecurity and Data Privacy
As connected devices collect vast amounts of sensitive data, cybersecurity and data privacy have become critical concerns. Organizations are investing in advanced encryption, AI-powered threat detection, and blockchain technology to ensure data integrity and compliance with global security regulations such as GDPR and CCPA.
5. Integration of IoT with Cloud and Hybrid Analytics
Many enterprises are adopting cloud-based and hybrid analytics models to handle massive datasets generated by connected devices. Cloud platforms enable scalability, while hybrid approaches offer a balance between security and efficiency, ensuring businesses can analyze IoT data in real-time while maintaining control over sensitive information.
Enquiry of This Report: https://www.snsinsider.com/enquiry/3727
Market Segmentation:
By Component
Solution
Service
By Application
Sales and Customer Management
Security & Emergency Management
Remote Monitoring
Predictive Maintenance Asset Management
Inventory Management
Energy Management
Building Automation
Others
By Organization Size
Large Enterprise
Small and Medium Size Enterprise
By Deployment Mode
On-premises
Cloud
Market Analysis and Current Landscape
Surging IoT Adoption: The number of IoT-connected devices is projected to exceed 30 billion by 2030, generating massive amounts of analyzable data.
Rising Need for Operational Efficiency: Companies are leveraging analytics to optimize processes, reduce downtime, and enhance predictive maintenance.
Government and Industry Regulations: Compliance with data security standards and regulations is prompting businesses to adopt robust analytics solutions to manage and secure IoT-generated data.
Competitive Industry Landscape: Tech giants such as Microsoft, IBM, Google, AWS, and SAP are investing in advanced connected device analytics platforms, intensifying market competition.
Despite these promising trends, challenges such as data silos, interoperability issues, and the high cost of analytics implementation remain barriers to widespread adoption. However, as technology advances, businesses are finding scalable and cost-effective solutions to overcome these obstacles.
Future Prospects: What Lies Ahead?
1. Evolution of AI-Powered Autonomous Systems
The next phase of connected device analytics will witness the rise of AI-powered autonomous systems capable of making real-time decisions without human intervention. These systems will be widely used in smart factories, healthcare, transportation, and logistics, driving unprecedented efficiency.
2. Growth of Digital Twins Technology
Digital twins, virtual replicas of physical assets, are becoming mainstream in industries such as manufacturing, construction, and energy. These AI-driven models use connected device analytics to simulate scenarios, predict failures, and optimize asset performance in real time.
3. Blockchain for Secure Data Transactions
Blockchain technology will play a crucial role in securing IoT transactions by ensuring transparency, immutability, and authentication. This will be particularly beneficial for industries dealing with sensitive data, such as financial services, healthcare, and supply chain management.
4. Expansion into Smart Homes and Consumer Electronics
As IoT adoption grows in the consumer segment, smart home devices, wearables, and connected appliances will rely on analytics to improve user experiences. AI-powered assistants, personalized recommendations, and home automation solutions will redefine how consumers interact with their devices.
5. Industry-Specific Analytics Solutions
Companies are increasingly demanding industry-tailored analytics solutions that cater to their specific operational needs. Custom-built analytics platforms for automotive, energy, retail, and telecom sectors will drive deeper market penetration and growth.
Access Complete Report: https://www.snsinsider.com/reports/connected-device-analytics-market-3727
Conclusion
The Connected Device Analytics Market is set for significant expansion, driven by technological innovations, increasing IoT adoption, and the rising demand for real-time data insights. As industries embrace AI, edge computing, and predictive analytics, businesses that invest in advanced analytics solutions will gain a competitive edge. The future of this market will be shaped by the seamless integration of cloud, AI, and cybersecurity measures, ensuring connected devices operate efficiently and securely. With continued advancements, connected device analytics will not only enhance business operations but also transform how industries leverage data for smarter decision-making and automation.
About Us:
SNS Insider is one of the leading market research and consulting agencies that dominates the market research industry globally. Our company's aim is to give clients the knowledge they require in order to function in changing circumstances. In order to give you current, accurate market data, consumer insights, and opinions so that you can make decisions with confidence, we employ a variety of techniques, including surveys, video talks, and focus groups around the world.
Contact Us:
Jagney Dave - Vice President of Client Engagement
Phone: +1-315 636 4242 (US) | +44- 20 3290 5010 (UK)
#Connected Device Analytics Market#Connected Device Analytics Market Analysis#Connected Device Analytics Market Scope#Connected Device Analytics Market Growth#Connected Device Analytics Market Trends
0 notes
Text
Choosing the Right Reporting Tool for Your Business
For any business striving for success, gathering data and generating reports are critical for assessing performance, understanding customer behavior, and making well-informed decisions. With an abundance of reporting tools available, finding the right one for your organization can be challenging.
This guide aims to simplify the process by helping you identify the best data reporting tool to meet your company’s specific needs. We’ll explore popular software options, highlighting their features, benefits, and potential limitations.
What Are Reporting Tools?
A reporting tool is a software solution designed to help organizations collect, analyze, and present data in a clear and organized format. These tools enable businesses to create various types of reports—such as financial, operational, sales, and marketing reports—which can inform strategic decisions and track progress.
Key features of reporting tools often include:
Data visualization capabilities
Customizable report templates
Automated report generation
Integration with diverse data sources
By leveraging these tools, businesses can uncover insights, monitor trends, and track key performance indicators (KPIs), ultimately driving growth and operational efficiency.
Types of Reporting Tools
Different reporting tools serve distinct purposes. Below are some common types of tools to consider:
1. Business Intelligence (BI) Tools
BI tools help analyze and visualize complex datasets, supporting better decision-making. Popular examples include Tableau, Microsoft Power BI, and QlikView. Many BI tools offer advanced capabilities such as predictive analytics, data mining, and machine learning.
2. Dashboard Reporting Tools
These tools specialize in creating interactive dashboards that display real-time KPIs and metrics. Examples include Sisense, Domo, and Klipfolio. They provide a visual overview of data, making it easier to monitor performance at a glance.
3. Spreadsheet-Based Tools
Spreadsheet tools like Microsoft Excel and Google Sheets are widely used for their simplicity and flexibility. Users can create charts, perform calculations, and organize data within a familiar interface.
4. Ad Hoc Reporting Tools
Designed for quick, custom report creation, these tools often feature drag-and-drop interfaces and pre-built templates. Examples include Zoho Analytics and Birst. They are ideal for users without technical expertise who need tailored reports.
5. Financial Reporting Tools
These tools focus on generating financial reports, such as balance sheets, income statements, and cash flow analyses. Examples include Oracle Hyperion, SAP Financial Statement Insights, and IBM Cognos. They are crucial for tracking financial health and ensuring compliance.
6. CRM Reporting Tools
Integrated into Customer Relationship Management systems, these tools provide insights into customer data, sales performance, and marketing campaigns. Examples include Salesforce, HubSpot, and Microsoft Dynamics 365.
7. Open-Source Reporting Tools
Open-source tools are free to use and highly customizable, making them a good option for businesses with tight budgets. Examples include BIRT (Business Intelligence and Reporting Tools), JasperReports, and Pentaho.
Top 5 Reporting Tools of 2023
Here are five top-rated reporting tools to consider for your business:
1. Tableau
Tableau is a leading BI and data visualization tool known for its intuitive interface, extensive customization options, and strong community support. It’s suitable for organizations of all sizes looking to create interactive dashboards and reports.
2. Domo
Domo is a cloud-based BI platform offering real-time data visualization, collaboration tools, and mobile access. Its user-friendly design and pre-built connectors make it ideal for businesses seeking to streamline reporting processes.
3. Looker
Looker provides advanced analytics and reporting capabilities, with a focus on data governance and integration with popular data warehouses. Acquired by Google in 2019, Looker’s customizable data models make it a strong choice for businesses prioritizing data accuracy.
4. Microsoft Power BI
Power BI integrates seamlessly with Microsoft products like Office 365 and Azure. Its robust data analysis, visualization features, and competitive pricing make it appealing for organizations leveraging Microsoft’s ecosystem.
5. Sisense
Sisense is renowned for its ease of use and scalability. Its In-Chip™ technology enables faster data processing, while its capability to handle large datasets and embed analytics into other applications makes it an excellent choice for complex reporting needs.
0 notes
Text
Principais Ferramentas para Construir Pipeline de Dados - Real Time Analytics
Leonardo Santos da Mata
Engenheiro de Dados, DBA | SQL, Python para Analise de Dados, Pentaho Data Integration, Cloud AWS, Cloud Azure, Mongodb, Mongodb Compass, Docker e Portainer.io
19 de outubro de 2024
A construção de pipelines de dados para Real Time Analytics envolve a escolha de ferramentas que permitam processar, analisar e visualizar dados em tempo real. Abaixo, listamos algumas das principais ferramentas, com seus prós, contras e os tipos de projetos em que cada uma se destaca.
1. Tableau
Prós:
Interface amigável e intuitiva
Grande capacidade de criação de visualizações interativas
Suporte para integração com diversas fontes de dados
Contras:
Custo elevado para grandes equipes
Limitações no processamento de grandes volumes de dados em tempo real
Aplicação: Projetos que demandam visualização interativa de dados para decisões de negócios, como relatórios e dashboards executivos.
2. Amazon Kinesis
Prós:
Excelente para processar e analisar grandes volumes de dados em tempo real
Integrado com o ecossistema AWS
Altamente escalável e flexível
Contras:
Curva de aprendizado acentuada para iniciantes
Custo pode aumentar conforme o volume de dados processado
Aplicação: Ideal para projetos de IoT, análise de logs de aplicações e monitoramento de eventos em tempo real.
3. Metabase
Prós:
Open-source e de fácil uso
Suporte a várias bases de dados
Boa opção para equipes menores que buscam relatórios simples
Contras:
Funcionalidades limitadas para grandes volumes de dados
Menos opções de personalização de visualizações
Aplicação: Pequenas e médias empresas que precisam de relatórios básicos e acessíveis com rápida implementação.
4. Looker Studio
Prós:
Integração com diversas fontes de dados, incluindo Google Analytics
Interface de fácil uso para criação de relatórios e dashboards interativos
Bom para análises colaborativas em tempo real
Contras:
Funcionalidades limitadas para manipulação avançada de dados
Pode ser mais simples do que necessário para grandes volumes de dados
Aplicação: Ideal para empresas que já estão no ecossistema Google e precisam de dashboards fáceis de usar.
5. Apache Flink
Prós:
Processamento de dados em tempo real com baixa latência
Suporte a análise de grandes volumes de dados distribuídos
Flexível para integração com diferentes pipelines de dados
Contras:
Requer uma curva de aprendizado significativa
Configuração complexa para iniciantes
Aplicação: Processamento de dados em tempo real para casos de uso como análise de fraudes, monitoramento de IoT e sistemas de recomendação.
6. Apache Druid
Prós:
Alta performance no processamento e análise de dados em tempo real
Otimizado para grandes volumes de dados com baixas latências de consulta
Suporte a OLAP (Online Analytical Processing)
Contras:
Configuração e gerenciamento podem ser desafiadores
Requer conhecimento técnico avançado para configuração otimizada
Aplicação: Projetos que exigem ingestão de grandes volumes de dados em tempo real, como análise de streaming de eventos e relatórios analíticos.
7. Apache Superset
Prós:
Open-source e gratuito
Suporte a uma ampla gama de fontes de dados
Flexível para criação de dashboards e visualizações
Contras:
Requer conhecimento técnico para instalação e configuração
Limitado para análise em tempo real em comparação com outras soluções
Aplicação: Empresas que precisam de uma solução open-source para visualização de dados sem custo de licenciamento.
8. Azure Synapse Analytics
Prós:
Totalmente integrado ao ecossistema Azure
Suporta análise em tempo real de grandes volumes de dados
Possui recursos de SQL e big data integrados
Contras:
Curva de aprendizado para quem não está familiarizado com Azure
Pode ter um custo elevado dependendo do uso
Aplicação: Projetos de grande escala que exigem processamento de dados em tempo real com integração total no Azure.
9. Redash
Prós:
Open-source e fácil de usar
Suporte a várias bases de dados
Ótima ferramenta para equipes que precisam de consultas rápidas
Contras:
Funcionalidades limitadas para grandes empresas
Não é ideal para processamento de dados complexos em tempo real
Aplicação: Empresas pequenas a médias que precisam de uma ferramenta simples e acessível para relatórios e dashboards.
10. MicroStrategy
Prós:
Ampla gama de funcionalidades de business intelligence
Suporte a dados em tempo real com alto nível de personalização
Ótimo para projetos corporativos de grande escala
Contras:
Custo elevado
Curva de aprendizado acentuada
Aplicação: Grandes corporações que precisam de uma solução robusta para business intelligence e análise em tempo real.
11. Dataedo
Prós:
Excelente para documentação e governança de dados
Interface simples e fácil de usar
Ajuda na visualização e organização dos metadados
Contras:
Não é projetado para análise de dados em tempo real
Funcionalidades limitadas para grandes volumes de dados
Aplicação: Projetos que exigem documentação e governança de dados clara, como ambientes de big data corporativos.
12. Power BI
Prós:
Fácil de usar e integrado ao ecossistema Microsoft
Boa solução para visualização de dados em tempo real
Grande variedade de conectores e integração com várias fontes de dados
Contras:
Limitações na manipulação de grandes volumes de dados
Custo de licenciamento pode ser alto para grandes equipes
Aplicação: Projetos de relatórios executivos e visualizações interativas para pequenas e médias empresas.
13. Presto
Prós:
Alta performance para consultas distribuídas em grandes volumes de dados
Suporte a SQL, ideal para grandes análises
Integração com vários sistemas de armazenamento de dados
Contras:
Configuração complexa
Requer conhecimento técnico avançado para otimização
Aplicação: Análises distribuídas em ambientes de big data, como consultas em clusters Hadoop.
Essas ferramentas são fundamentais para construir pipelines de dados eficientes para análises em tempo real, cada uma com seu conjunto de vantagens e limitações. A escolha da ferramenta depende do tipo de projeto, dos volumes de dados a serem processados e do nível de personalização e complexidade exigido.
0 notes
Text

Dive into the world of Pentaho with Proexcellency's top-notch online training! Master the comprehensive suite of Pentaho tools, from data integration to visualization, at your own pace and from anywhere with an internet connection. Benefit from experienced instructors, hands-on projects, and certification preparation resources. Proexcellency, a leading Pentaho training provider, ensures you're equipped for exciting career opportunities in India's booming IT sector. Unleash the power of Pentaho and chart your course to a rewarding career in data analytics. Explore transformative courses and enroll today! For inquiries, contact us at +91 8722079509 | 08031508687 or email [email protected] or [email protected].
0 notes
Text
Elevate Your Business with Expert Data Integration Consulting Services
In the dynamic realm of data-driven enterprises, harnessing the potential of diverse datasets is a critical stride towards success. Yet, the intricacies of managing data from assorted sources can be daunting. Here, the role of Data Integration Consulting services emerges, offering seamless solutions to harmonize, optimize, and extract actionable insights from your data.
Data Integration Consulting: Simplifying Complexity for Enhanced Insights
Tailored to meet the demands of contemporary data landscapes, Data Integration Consulting services provide a guiding light. Whether it involves social media data, unstructured content, extensive logs, or voluminous IoT data, these services are designed to adeptly integrate disparate sources. Emphasizing real-time integration and analytics, experts ensure your data metamorphoses into valuable insights driving informed decision-making.
Key Benefits of Data Integration Consulting:
Unified Perspective: By consolidating data from various sources, a coherent, reliable, and unified perspective emerges, fostering accurate analysis and reporting.
Optimized Efficiency: Expertise in fine-tuning ETL processes leads to efficiency improvements of up to 10x, expediting data processing and insights delivery.
Data Excellence: Accompanied by rigorous data quality checks and master data management practices, integration guarantees precision and pertinent insights.
Contextual Understanding: Domain-specific data modeling capabilities infuse industry-specific insights, enriching your data's value.
Technology Adaptability: Proficiency across diverse technology stacks, including SAP BODS, Pentaho Kettle, Informatica, etc., ensures tailored solutions to suit your unique organizational needs.
Unleash Your Data's Potential with Data Integration Consulting
A holistic approach to data integration consulting empowers organizations to unlock their data's true potential. With extensive experience surpassing 2 million person-hours, these services are the bedrock for seamless data integration solutions on a global scale.
Whether managing real-time data streams, grappling with big data complexities, or navigating intricate data landscapes, Data Integration Consulting services offer the expertise and technology to surmount challenges and glean actionable insights. Empower your data, steer it into a strategic asset, and propel your business forward with trusted data integration solutions.
0 notes
Text
What is a Data Lake?
A data lake refers to a central storage repository used to store a vast amount of raw, granular data in its native format. It is a single store repository containing structured data, semi-structured data, and unstructured data.
A data lake is used where there is no fixed storage, no file type limitations, and emphasis is on flexible format storage for future use. Data lake architecture is flat and uses metadata tags and identifiers for quicker data retrieval in a data lake.
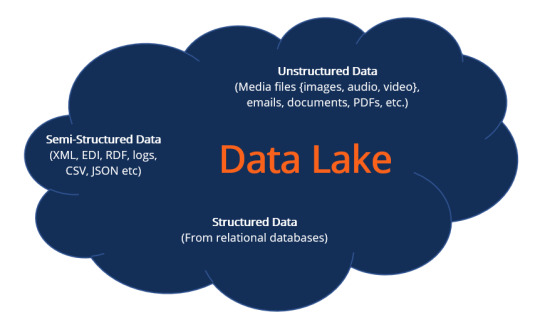
The term “data lake” was coined by the Chief Technology Officer of Pentaho, James Dixon, to contrast it with the more refined and processed data warehouse repository. The popularity of data lakes continues to grow, especially in organizations that prefer large, holistic data storage.
Data in a data lake is not filtered before storage, and accessing the data for analysis is ad hoc and varied. The data is not transformed until it is needed for analysis. However, data lakes need regular maintenance and some form of governance to ensure data usability and accessibility. If data lakes are not maintained well and become inaccessible, they are referred to as “data swamps.”
Data Lakes vs. Data Warehouse
Data lakes are often confused with data warehouses; hence, to understand data lakes, it is crucial to acknowledge the fundamental distinctions between the two data repositories.
As indicated, both are data repositories that serve the same universal purpose and objective of storing organizational data to support decision-making. Data lakes and data warehouses are alternatives and mainly differ in their architecture, which can be concisely broken down into the following points.
Structure
The schema for a data lake is not predetermined before data is applied to it, which means data is stored in its native format containing structured and unstructured data. Data is processed when it is being used. However, a data warehouse schema is predefined and predetermined before the application of data, a state known as schema on write. Data lakes are termed schema on read.
Flexibility
Data lakes are flexible and adaptable to changes in use and circumstances, while data warehouses take considerable time defining their schema, which cannot be modified hastily to changing requirements. Data lakes storage is easily expanded through the scaling of its servers.
User Interface
Accessibility of data in a data lake requires some skill to understand its data relationships due to its undefined schema. In comparison, data in a data warehouse is easily accessible due to its structured, defined schema. Many users can easily access warehouse data, while not all users in an organization can comprehend data lake accessibility.
Why Create a Data Lake?
Storing data in a data lake for later processing when the need arises is cost-effective and offers an unrefined view to data analysts. The other reasons for creating a data lake are as follows:
The diverse structure of data in a data lake means it offers a robust and richer quality of analysis for data analysts.
There is no requirement to model data into an enterprise-wide schema with a data lake.
Data lakes offer flexibility in data analysis with the ability to modify structured to unstructured data, which cannot be found in data warehouses.
Artificial intelligence and machine learning can be employed to make profitable forecasts.
Using data lakes can give an organization a competitive advantage.
Data Lake Architecture
A data lake architecture can accommodate unstructured data and different data structures from multiple sources across the organization. All data lakes have two components, storage and compute, and they can both be located on-premises or based in the cloud. The data lake architecture can use a combination of cloud and on-premises locations.
It is difficult to measure the volume of data that will need to be accommodated by a data lake. For this reason, data lake architecture provides expanded scalability, as high as an exabyte, a feat a conventional storage system is not capable of. Data should be tagged with metadata during its application into the data lake to ensure future accessibility.
Below is a concept diagram for a data lake structure:

Data lakes software such as Hadoop and Amazon Simple Storage Service (Amazon S3) vary in terms of structure and strategy. Data lake architecture software organizes data in a data lake and makes it easier to access and use. The following features should be incorporated in a data lake architecture to prevent the development of a data swamp and ensure data lake functionality.
Utilization of data profiling tools proffers insights into the classification of data objects and implementing data quality control
Taxonomy of data classification includes user scenarios and possible user groups, content, and data type
File hierarchy with naming conventions
Tracking mechanism on data lake user access together with a generated alert signal at the point and time of access
Data catalog search functionality
Data security that encompasses data encryption, access control, authentication, and other data security tools to prevent unauthorized access
Data lake usage training and awareness
Hadoop Data Lakes Architecture
We have singled out illustrating Hadoop data lake infrastructure as an example. Some data lake architecture providers use a Hadoop-based data management platform consisting of one or more Hadoop clusters. Hadoop uses a cluster of distributed servers for data storage. The Hadoop ecosystem comprises three main core elements:
Hadoop Distributed File System (HDFS) – The storage layer whose function is storing and replicating data across multiple servers.
Yet Another Resource Negotiator (YARN) – Resource management tool
MapReduce – The programming model for splitting data into smaller subsections before processing in servers
Hadoop supplementary tools include Pig, Hive, Sqoop, and Kafka. The tools assist in the processes of ingestion, preparation, and extraction. Hadoop can be combined with cloud enterprise platforms to offer a cloud-based data lake infrastructure.

Hadoop is an open-source technology that makes it less expensive to use. Several ETL tools are available for integration with Hadoop. It is easy to scale and provides faster computation due to its data locality, which has increased its popularity and familiarity among most technology users.
Data Lake Key Concepts
Below are some key data lake concepts to broaden and deepen the understanding of data lakes architecture.
Data ingestion – The process where data is gathered from multiple data sources and loaded into the data lake. The process supports all data structures, including unstructured data. It also supports batch and one-time ingestion.
Security – Implementing security protocols for the data lake is an important aspect. It means managing data security and the data lake flow from loading, search, storage, and accessibility. Other facets of data security such as data protection, authentication, accounting, and access control to prevent unauthorized access are also paramount to data lakes.
Data quality – Information in a data lake is used for decision making, which makes it important for the data to be of high quality. Poor quality data can lead to bad decisions, which can be catastrophic to the organization.
Data governance – Administering and managing data integrity, availability, usability, and security within an organization.
Data discovery – Discovering data is important before data preparation and analysis. It is the process of collecting data from multiple sources and consolidating it in the lake, making use of tagging techniques to detect patterns enabling better data understandability.
Data exploration – Data exploration starts just before the data analytics stage. It assists in identifying the right dataset for the analysis.
Data storage – Data storage should support multiple data formats, be scalable, accessible easily and swiftly, and be cost-effective.
Data auditing – Facilitates evaluation of risk and compliance and tracks any changes made to crucial data elements, including identifying who made the changes, how data was changed, and when the changes took place.
Data lineage – Concerned with the data flow from its source or origin and its path as it is moved within the data lake. Data lineage smoothens error corrections in a data analytics process from its source to its destination.
Benefits of a Data Lake
A data lake is an agile storage platform that can be easily configured for any given data model, structure, application, or query. Data lake agility enables multiple and advanced analytical methods to interpret the data.
Being a schema on read makes a data lake scalable and flexible.
Data lakes support queries that require a deep analysis by exploring information down to its source to queries that require a simple report with summary data. All user types are catered for.
Most data lakes software applications are open source and can be installed using low-cost hardware.
Schema development is deferred until an organization finds a business case for the data. Hence, no time and costs are wasted on schema development.
Data lakes offer centralization of different data sources.
They provide value for all data types as well as the long-term cost of ownership.
Cloud-based data lakes are easier and faster to implement, cost-effective with a pay-as-you-use model, and are easier to scale up as the need arises. It also saves on space and real estate costs.
Challenges and Criticism of Data Lakes
Data lakes are at risk of losing relevance and becoming data swamps over time if they are not properly governed.
It is difficult to ensure data security and access control as some data is dumped in the lake without proper oversight.
There is no trail of previous analytics on the data to assist new users.
Storage and processing costs may increase as more data is added to the lake.
On-premises data lakes face challenges such as space constraints, hardware and data center setup, storage scalability, cost, and resource budgeting.
Popular Data Lake Technology Vendors
Popular data lake technology providers include the following:
Amazon S3 – Offers unlimited scalability
Apache – Uses Hadoop open-source ecosystem
Google Cloud Platform (GCP) – Google cloud storage
Oracle Big Data Cloud
Microsoft Azure Data Lake and Azure Data Analytics
Snowflake – Processes structured and semi-structured datasets, notably JSON, XML, and Parquet
More Resources
To keep learning and developing your knowledge base, please explore the additional relevant resources below:
Business Intelligence
Data Mart
Scalability
Data Protection
1 note
·
View note
Text
Are Data Lakes And Data Warehouses The Two Sides Of A Modern Cloud Data Platform

A true cloud data platform is capable of providing a plethora of functions, which complement and overlap one another. The majority of the business organizations consolidate the data from different resources into the singular customizable platform for big data analytics.
A separate platform for data analytics offers the prerequisite choice to create the dashboards for analyzing, aggregating, and segmenting high-dimensional data. It provides a helping hand in creating low-latency queries for performing real-time analytics.
Data lakes and Data warehouses are also known to be common alternatives. Data warehouses and data lakes are believed to be the two different sides of the recent cloud data platform, which offers a wide array of benefits.
What is Data Lake?
Data Lake Solutions refers to a term which was introduced in the year 2011 by James Dixon, Pentaho CTO. It contributes to being the large data repository in the unstructured and natural form.
Raw data is known to flow into the data lake. Also, users have the opportunity to correlate, segregate, and analyze various data parts, following the needs.
Data Lake depends on low-cost storage options, which are beneficial in storing the raw data. Data gets collected from different sources in real-time, after which it is transferred into the data lake in the original format.
It is possible to update the data in the data lake in batches and real-time, thereby creating the volatile structure.
What is Data Warehouses?
A data warehouse contributes to being the central repository of the data, which is collected from a vast array of diverse sources, such as in-house repositories and cloud-based applications.
The data warehouse makes use of column-oriented storage, referred to as the columnar database. The database is capable of storing the data by the columns and not by rows.
Hence, it is believed to be an excellent choice for data warehousing. If there is a data warehouse enriched with historical and current data, people in the business organization will use it to create trend reports and forecasting dashboards with the aid of different tools.
A data warehouse boasts of certain characteristics, which include scalable, structured, non-volatile, and integrated. The scalable data warehouse is capable of accomplishing the enhanced demands for the storage space.
The structured data warehouse uses a columnar data store to bring an improvement in the analytical query speed. As the data present in the data warehouse is uploaded periodically, the momentary change does not affect decision making.
The integrated data warehouse involves the extraction and cleansing of data uniformly, instead of the original source.
The data warehouse serves as the data-tier application known to define the schemas, instance-level objects, and database objects used by the client-server or three-tier application.
Data Warehouse and Data lakes- Two sides of the cloud data platform
Data lakes and Data Warehouses are recognized to be the two sides of the cloud data platform, which offers a helping hand in making an informed purchase decision.
There are specific use cases that boast of a data analytics engine in which the data warehouse and data lake will co-exist. However, it depends on the area's different functional requirements, which include data adaptability, data structure, and performance.
Data Performance
As you aim to create a data warehouse, the data source analysis happens to be a significant time-consuming factor. It is useful in the creation of an organized and structured data model, which is meant for individual reporting needs.
A crucial part of the process is deciding the type of data which should be included, and things, that need to be excluded from the data warehouses.
It includes the data collected from different resources, after which the data should be aggregating and cleansing. Also referred to as data scrubbing, data cleaning refers to the technique of data clean up.
It happens before the data is loaded into the data warehouse. The objective of data cleansing is the elimination of outdated data.
After the completion of data cleansing, it is ready for analysis. However, it takes the prerequisite energy and time, owing to the sequence involved in data cleansing techniques.
Data warehouse works wonders in cleaning the data. However, it is a bit pricey. A data lake includes relevant data sets, regardless of the structure and source. It is responsible for the data storage in the original form.
Data warehouses are created for the purpose of faster analytical processing. The columnar and underlying RDBMS provides accelerated performance, which is optimized for the purpose of analytical query processing.
It is inclusive of high concurrency and complicated joins. However, it would be best if you keep in mind that data lakes are not performance-optimized. However, if you have any access to it, you will be capable of exploring the data at their own discretion, leading to a non-uniformed data representation technique.
Adaptability
A robust data warehouse has the ability to change faster and adapt to various scenarios. However, the data lake is faster to adapt to different changing requirements to adjust to multiple scenarios.
The complications of the upfront tasks need the resources and time of the developer. Data Lake can adapt to other changing requirements owing to the fact that data is present in the raw and unstructured form.
Such type of unstructured data is available to the potential audience, which has the power to use and access it for forming the analysis, catering to the requirements. The developers should devote and hump the resources and time, which is necessary to get meaningful information from the data.
Microsoft, Google, and Amazon confer Data Lake and Data Warehouse services, which offer platforms, against which the business organizations will run the BI reporting and analytics in real-time.
Microsoft Azure and Amazon Redshift are developed on the relational database model's top. It also provides large-scale and elastic data warehouse solutions. Google Cloud Datastore contributes to being the NoSQL Database as a Service of SaaS capable of automatically scaling. Every data warehouse is equipped with BI tools, which are integrated into the services.
1 note
·
View note
Text
GrayMatter SAP BI Center of Excellence (CoE) Customer Success Stories – Part 1
A globally reputed BI and Analytics specialist, GrayMatter has an in-house center of excellence for SAP BI solutions with expertise in SAP BOBJ, SAP BW, SAP HANA, and SAP BODS. The company has implemented SAP BI projects across data integration, dashboarding, reporting, consulting, migration, support, and training as well as in advanced analytics, for marquee customers across the globe. This series of blogs shall focus on GrayMatter’s SAP BI engagements delivered for global clients. This blog, the first in this series, is focused on GrayMatter’s project for GMR. GMR Group is one of the largest and fastest growing global infrastructure enterprises from India with interests in Airports, Energy, Highways and Urban Infrastructure sectors.
Following are the challenges, solution and business benefits that the engagement involved:
Challenges
High reaction times due to lag in consolidation of information across enterprise
Need for simple and clear insights to accelerate decision making
Need for insights on the go, for key executives and personnel on the field
Migration of existing Xcelsius dashboards
Solution
Developed dashboards around OTP (On time Performance), Aero Revenue, Aero Financial, ASQ (Airport Service Quality)
Implemented GrayMatter’s unique UI strategy for visualizations to enable sharp and insightful dashboards
Enabled mobile responsive dashboards offering actionable insights in a couple of clicks
GrayMatter experts enabled smooth transition to Design Studio dashboards
Benefits
Management gets quick snapshot of entire airport business at the corporate level on live data
Faster and more accurate decision making
Enhanced information sharing and collaboration leading to business benefits e.g., identification and elimination of revenue leakages
Contact for Expert Consultation
Customer Delight is the ultimate measure of results delivered. True to the results delivered through the engagement, the client provided glowing testimonials to GrayMatter. Mr. PS Nair, CEO – Corporate, Airports sector at GMR Group stated, “The GMR group strongly believes in harnessing the ‘Power of Information’ across all its businesses. By deploying GrayMatter’s Airport Analytics solution AA+ on SAP BO, GMR Airports has taken a quantum leap forward. The analytic solution enables GMR’s Airport Management team to take quick, timely and informed decisions on various aspects of the airport business across all GMR Airports”
About GrayMatter’s SAP BI TCoE:
GrayMatter has a dedicated SAP BI center of excellence (SAPBICoE) that ensures that the industry trends and best practices are constantly incorporated in its offerings. The entire range of offerings from ETL to reports, dashboards to predictive analytics on SAP are governed and directed by the center of excellence, for every single engagement, including project management, program management as well as executive guidance.
GrayMatter is powered by the technology assets created by SAPBICoE including 20 different data models, 30+ source system connectors, 20+ custom components, migration effort calculators, 10 dashboarding techniques, “RADIUS” dashboarding framework etc. As an illustration of the span of coverage of these assets, the source system connectors include ECC connectors, BW connectors, connectors to unstructured data using BODS, connectors to data on cloud and so on.
Some of the path-breaking innovations that it has done in the recent past include:
GrayMatter addressed certain requirements that are not available out-of-the-box in tools like SAP Design Studio, SAP WebI, for example processing of data, capturing and saving user inputs, connecting to web interface etc. To address such requirements, GrayMatter has created many services and interfaces which are used across Design Studio and WebI. All these services are created using Java based web technology that can be easily deployed and managed in the web servers.
Data quality and data governance process have been implemented by integrating BODS and ProcessMaker where the data quality is automated using BODS with a design to scale easily to add more Data Quality rules. Process Maker is integrated using standard web interface with BODS to bring automation to the workflow of data governance requirements
Predictive analytics systems have been devised using a mix of R and BODS e.g. car park revenue management system to predict car park slot prices.
Enabled data loads and file management from cloud (AWS) using latest BODS adapter
Designed BO universes to overcome the limitations of Sybase IQ SQL functions like top, rank etc.
Airport Big Data , Business Intelligence Consulting Services in US , Big Data Analytics Services in US , Data Integration Services in US , Pentaho Consulting Services in US , Qlik Sense Services in US , Qlik Consulting Services in US , SAP BI Services in US , Airport Big Data Analytics , Dashboard Services in US
#sapbi#businessintelligence#qliksense#qlikview#qlik#bigdata#bigdataanalytics#dataintegration#pentaho
2 notes
·
View notes
Text
Pentaho Report Designer Training Services in USA
Professional Pentaho Report Designer training services are offered in the USA by AIVHub. The creation, customization, and deployment of reports using Pentaho technologies are the main topics of their extensive courses. Participants will maximize their analytical talents by improving their data integration, reporting, and business intelligence skills with practical experience and expert mentoring.

#pentahoreportdesignertraining#pentahoconsultancy#birtserver#aivconsultant#aivconsultancy#embeddedanalytics#jaspersoftconsultancy#aivtraining
0 notes
Text
Hadoop Big Data Analytics Market Demand, Key Trends, and Future Projections 2032
The Hadoop Big Data Analytics Market size was valued at USD 11.22 billion in 2023 and is expected to Reach USD 62.86 billion by 2032 and grow at a CAGR of 21.11% over the forecast period of 2024-2032
The Hadoop Big Data Analytics market is expanding rapidly as businesses increasingly rely on data-driven decision-making. With the exponential growth of structured and unstructured data, organizations seek scalable and cost-effective solutions to process and analyze vast datasets. Hadoop has emerged as a key technology, offering distributed computing capabilities to manage big data efficiently.
The Hadoop Big Data Analytics market continues to thrive as industries recognize its potential to enhance operational efficiency, customer insights, and business intelligence. Companies across sectors such as healthcare, finance, retail, and manufacturing are leveraging Hadoop’s open-source framework to extract meaningful patterns from massive datasets. As data volumes continue to grow, businesses are investing in Hadoop-powered analytics to gain a competitive edge and drive innovation.
Get Sample Copy of This Report: https://www.snsinsider.com/sample-request/3517
Market Keyplayers:
Cloudera Inc. (Cloudera Data Platform)
Hortonworks, Inc. (Hortonworks Data Platform)
Hadapt, Inc. (Hadapt)
Amazon Web Services LLC (Amazon EMR)
Outerthought (Outerthought Hadoop)
MapR Technologies, Inc. (MapR Converged Data Platform)
Platform Computing (Platform Symphony)
Karmasphere, Inc. (Karmasphere Analytics)
Greenplum, Inc. (Greenplum Database)
Hstreaming LLC (Hstreaming)
Pentaho Corporation (Pentaho Data Integration)
Zettaset, Inc. (Zettaset Orchestrator)
IBM Corporation (IBM BigInsights)
Microsoft Corporation (Azure HDInsight)
Teradata Corporation (Teradata Analytics Platform)
SAP SE (SAP HANA)
Oracle Corporation (Oracle Big Data Appliance)
Dell Technologies (Dell EMC Isilon)
SAS Institute Inc. (SAS Viya)
Qlik Technologies (Qlik Sense)
Market Trends Driving Growth
1. Increasing Adoption of AI and Machine Learning
Hadoop is being widely integrated with AI and machine learning models to process complex data structures, enabling predictive analytics and automation.
2. Growth in Cloud-Based Hadoop Solutions
The demand for cloud-based Hadoop solutions is rising as businesses look for flexible, scalable, and cost-effective data management options. Leading cloud providers are offering Hadoop-as-a-Service (HaaS) to simplify deployment.
3. Real-Time Data Processing and Streaming Analytics
Organizations are increasingly focusing on real-time data analysis for instant decision-making, leading to the adoption of Hadoop-powered stream processing frameworks like Apache Kafka and Spark.
4. Industry-Specific Hadoop Implementations
Sectors like banking, healthcare, and retail are implementing Hadoop to enhance fraud detection, patient care analytics, and customer behavior analysis, respectively.
5. Growing Demand for Data Security and Governance
With the rise in cybersecurity threats and data privacy regulations, businesses are adopting Hadoop for secure, compliant, and well-governed big data storage and processing.
Enquiry of This Report: https://www.snsinsider.com/enquiry/3517
Market Segmentation:
By Component
Software
Services
By Application
Risk & Fraud Analytics
Internet of Things (IoT)
Customer Analytics
Security Intelligence
Distributed Coordination Service
Merchandising Coordination Service
Merchandising & Supply Chain Analytics
Others
By End-User
BFSI
IT & Telecommunication
Retail
Government & Defense
Manufacturing
Transportation & Logistics
Healthcare
Others
Market Analysis and Current Landscape
Surging data volumes from IoT, social media, and enterprise applications.
Growing enterprise investment in big data infrastructure.
Advancements in cloud computing, making Hadoop deployments more accessible.
Rising need for cost-effective and scalable data storage solutions.
Challenges such as Hadoop’s complex deployment, data security concerns, and the need for skilled professionals persist. However, innovations in automation, cloud integration, and managed Hadoop services are addressing these issues.
Future Prospects: What Lies Ahead?
1. Advancements in Edge Computing and IoT Analytics
Hadoop is expected to play a key role in processing data from IoT devices at the edge, reducing latency and improving real-time insights.
2. Expansion of Hadoop in Small and Medium Enterprises (SMEs)
As Hadoop-as-a-Service gains popularity, more SMEs will adopt big data analytics without the need for large-scale infrastructure investments.
3. Enhanced Integration with Blockchain Technology
Hadoop and blockchain integration will help improve data security, traceability, and regulatory compliance in industries like finance and healthcare.
4. Automation and No-Code Hadoop Solutions
The emergence of no-code and low-code platforms will simplify Hadoop deployments, making big data analytics more accessible to non-technical users.
5. Continued Growth in Hybrid and Multi-Cloud Hadoop Deployments
Organizations will increasingly adopt hybrid cloud and multi-cloud strategies, leveraging Hadoop for seamless data processing across different cloud environments.
Access Complete Report: https://www.snsinsider.com/reports/hadoop-big-data-analytics-market-3517
Conclusion
The Hadoop Big Data Analytics market is poised for sustained growth as businesses continue to harness big data for strategic decision-making. With advancements in AI, cloud computing, and security frameworks, Hadoop’s role in enterprise data analytics will only strengthen. Companies investing in scalable and innovative Hadoop solutions will be well-positioned to unlock new insights, improve efficiency, and drive digital transformation in the data-driven era.
About Us:
SNS Insider is one of the leading market research and consulting agencies that dominates the market research industry globally. Our company's aim is to give clients the knowledge they require in order to function in changing circumstances. In order to give you current, accurate market data, consumer insights, and opinions so that you can make decisions with confidence, we employ a variety of techniques, including surveys, video talks, and focus groups around the world.
Contact Us:
Jagney Dave - Vice President of Client Engagement
Phone: +1-315 636 4242 (US) | +44- 20 3290 5010 (UK)
#Hadoop Big Data Analytics market#Hadoop Big Data Analytics market Analysis#Hadoop Big Data Analytics market Scope#Hadoop Big Data Analytics market Share#Hadoop Big Data Analytics market Growth
0 notes
Text
Learn Pentaho Online with Expert Training

In today's digital world, staying on top of the latest technology can make a big difference when it comes to keeping your career and business competitive. Pentaho is one of the leading open-source business intelligence (BI) platforms, and taking a Pentaho online training course can provide you with the essential skills to stay ahead in this field. In this article, we'll take a closer look at Pentaho, the benefits of online learning, how to find the right course, and how to ensure success when taking an online Pentaho course.
What is Pentaho?
Pentaho is an open-source business intelligence platform that provides powerful data analysis and reporting capabilities, as well as ETL (Extract, Transform, Load) and data mining tools. It is used by a variety of organizations, from small businesses to large corporations, for analyzing and reporting on data from multiple sources. With its intuitive user interface and powerful capabilities, Pentaho is considered one of the most popular open-source BI platforms.
Pentaho is designed to be highly extensible, allowing users to customize the platform to meet their specific needs. It also offers a wide range of features, including data visualization, predictive analytics, and machine learning. Additionally, Pentaho integrates with a variety of other systems, such as Hadoop, MongoDB, and Spark, making it easy to access and analyze data from multiple sources.
Benefits of Learning Pentaho
Pentaho's flexible architecture and scalability make it an attractive choice for businesses of all sizes. It can be used for a variety of tasks, from simple reporting and data analysis to more advanced data mining projects. With Pentaho, you can identify new trends, create detailed reports, and gain valuable insights into your data. This can help you make better decisions and stay ahead in today's competitive market.
Pentaho also offers a wide range of features and tools that can be used to create custom solutions for your business. It is easy to use and can be integrated with other systems, such as databases and web services. Additionally, Pentaho is open source, meaning it is free to use and modify. This makes it an ideal choice for businesses looking to save money while still getting the most out of their data.
What You'll Learn in an Online Pentaho Course
A Pentaho online training course can provide you with the skills to use this powerful platform effectively. You'll learn how to set up Pentaho projects, design data models, create reports, query databases, and create dashboards. You'll also learn how to use Pentaho's ETL tools to extract and transform data from multiple sources. With an online course, you'll have access to comprehensive learning materials and on-demand support from expert instructors.
You'll also gain an understanding of the Pentaho architecture and how to integrate it with other systems. You'll learn how to use Pentaho's data integration tools to create data pipelines and automate data processing tasks. Additionally, you'll learn how to use Pentaho's analytics tools to analyze data and create visualizations. By the end of the course, you'll have the skills to use Pentaho to create powerful data-driven applications.
Finding the Right Online Training Course
When searching for an online Pentaho course, you should look for a program that is designed for your needs. Look for courses that offer comprehensive learning materials, such as video tutorials and quizzes. You should also make sure that the course is taught by experienced instructors who are available to answer any questions you may have. Finally, check if the course is accredited by a professional organization to ensure that it meets industry standards.
It is also important to consider the cost of the course. While some courses may be more expensive, they may also offer more comprehensive learning materials and support. Additionally, you should look for courses that offer flexible payment options, such as monthly or annual payments. This will help you budget for the course and ensure that you can complete it without any financial strain.
Tips for Successful Learning with an Online Course
When taking an online Pentaho course, it's important to set clear goals for yourself and plan out your learning schedule in advance. This will help you stay focused and motivated when learning. You should also break up your lessons into smaller tasks so that you don't get overwhelmed. Finally, practice your skills regularly and ask questions when you're stuck – this will help you master the material faster.
It's also important to take regular breaks while studying. Taking a few minutes to relax and clear your head can help you stay focused and productive. Additionally, it's important to stay organized and keep track of your progress. This will help you stay motivated and on track with your learning goals.
Taking Your Knowledge Further with Advanced Online Pentaho Training
Once you have mastered the basics of working with Pentaho, you can take your knowledge further with advanced online training. This type of training will provide you with more advanced skills, such as using predictive analytics and visualizing data. With advanced training, you'll be able to use more sophisticated techniques when analyzing data and creating reports.
Advanced Pentaho Online Training can also help you to develop a deeper understanding of the software and its capabilities. You'll learn how to use the software to its fullest potential, and you'll be able to create more complex reports and dashboards. Additionally, you'll gain a better understanding of the data structures and how to manipulate them to get the most out of your data.
The Future of Pentaho and its Applications
As technology advances, Pentaho will continue to grow in popularity and become even more powerful. With its powerful tools and user-friendly interface, Pentaho can be used for a wide range of applications, from simple data analysis to complex predictive analytics projects. With the right skills and knowledge, you'll be able to take advantage of the latest technology and stay ahead in today's digital world.
In the future, Pentaho will continue to develop new features and capabilities to make it even easier to use. For example, Pentaho could develop a more intuitive user interface, or add new features such as automated data cleansing and data visualization. Additionally, Pentaho could expand its capabilities to include machine learning and artificial intelligence, allowing users to create more sophisticated predictive models. With these new features, Pentaho will become an even more powerful tool for data analysis and predictive analytics.
Conclusion
Pentaho online training is a great way to learn the basics and advanced concepts of Pentaho data integration and analytics. It provides a comprehensive learning experience that can help you become a successful Pentaho user. With an array of online resources, tutorials, and support, you can gain the skills necessary to become a successful Pentaho user. With the right training, you can quickly become an expert in Pentaho and begin using it to its fullest potential.
1 note
·
View note
Text
Informatica Training - IDESTRAININGS
Fundamentals
Informatica training is a way to learn how to use the Informatica products. It covers the following topics:
What is Informatica?
What is ETL?
What is PowerCenter?
Introduction
Informatica is a data integration software and services company. Informatica provides solutions for data preparation, data quality, master data management, and analytics. The company's products are used in the telecommunications, financial services, healthcare, insurance and manufacturing industries.
The ETL (Extract Transform Load) process is used to extract data from multiple sources such as databases or files; transform that information into a standard format; load it into another database or file; then store it there permanently so that it can be accessed by other applications.
Workflow Monitor, Workflow Manager and Workflow Tasks are all part of PowerCenter. They are used to monitor jobs, manage jobs, and control task execution respectively. Designer Tool allows you to create your own transformations using Embedded Transformer Language (ETL).

PowerCenter Basics
PowerCenter is the ETL tool of the Informatica family. It's used to extract data from various sources and load it into various targets. You can create complex data transformation and data migration processes using PowerCenter. For example, you can implement a business process that loads customer master data into an enterprise knowledge base (EKB) or loads transactional data directly into analytics applications such as Tableau Server and Pentaho BI Server without loading it first in a separate staging area.
PowerCenter can also be used to create data integration solutions that integrate on-premises systems with cloud-based services by mapping both internal and external schemas, migrating data between on-premises systems and cloud databases from popular vendors such as Amazon Redshift, Google BigQuery, Snowflake Computing, Azure Data Factory Catalogs, Microsoft Dynamics 365 for Finance & Operations (formerly NAV), Salesforce Marketing Cloud Einstein Analytics Platform with Outbound Hubs (OMH), Facebook Graph API v2 and more
Designer Tool
The Informatica Designer Tool is used to create and edit jobs, mappings and transformations. It is used to design the transformations and mappings that are used to extract data from the source and load data into the target.
The informatica designer tool can be accessed through a web browser or by standalone client software.
Workflow Monitor
Workflow Monitor is the next generation tool for monitoring and managing workflows. It’s a web-based application that allows users to monitor and manage workflows using dashboards, reports, alerts, as well as additional functionality such as:
A dashboard view of all workflows in your organization
The ability to set up alerting for workflow issues
Access to an integrated repository of knowledge articles related to your organization’s business processes (more on this later)
Workflow Manager
Workflow Manager is a tool to manage the workflow of a process. It is used to create, edit and schedule workflows. Workflow Manager helps with the following tasks:
Create, edit and schedule workflows
Create new jobs for different business processes such as sending an email or completing data loads
Workflow Tasks
Workflow tasks are used to automate business processes. They help you create, maintain and execute automated workflows for your data.
Create - Use this task to create new records in the database or to create empty files in a directory on the file system
Modify - This task helps modify existing records in the database and add new values to fields/properties of objects
Delete - This task deletes records from the table based on their criteria and works with any object type (relational tables, file systems etc.)

Enrich your knowledge on the most popular ETL tool, Informatica. This course will help you in mastering the concepts of the sources and targets, mappings and extractions.
Informatica is a popular ETL tool used for extracting, transforming and loading data from one database to another. This course will help you in mastering the concepts of the sources and targets, mappings and extractions. You will also learn how to use external databases such as Oracle, MS SQL Server etc. along with Informatica PowerCenter 10.5
Conclusion
We hope that you enjoyed the contents of this course, and it would help you to gain knowledge on Informatica, which is very important in the field of Business Intelligence.
0 notes
Text
Pentaho for ETL & Data Integration Masterclass 2022 - PDI 9
Pentaho for ETL & Data Integration Masterclass 2022 – PDI 9
Pentaho for ETL & Data Integration Masterclass 2022 – PDI 9 What is ETL? The ETL (extract, transform, load) process is the most popular method of collecting data from multiple sources and loading it into a centralized data warehouse. ETL is an essential component of data warehousing and analytics. Why Pentaho for ETL? Pentaho has phenomenal ETL, data analysis, metadata management and reporting…
View On WordPress
0 notes
Text
Business Intelligence Tool Attributes to Effectively Drill into Big Data
An ardent business person is the one who is far sighted, observes and understands the business structure, predicts future trends and takes decision based on that. This was the common scenario a few years back, this was achieved simply by keeping one’s eyes and ears open.
However, the scenario has drastically changed lately. With the information
explosion, big-data took a different shape and it became almost impossible to understand the real-life business scenario by only keeping one’s eyes and ears open. Thus, the inception of BI and big-data tools took place.
Today, BI tools have taken the center stage and are that crucial to businesses what brain is to body, that is why, selecting the right tool is way too important than we usually think of.
On a practical prospect, integrating advanced analytics for big data with BI systems is crucial for gaining full return on investment. Also, advanced analytics amalgamated with BI have already proven its mettle at different organizational level by providing deeper, exploratory perspective on the data, and at the same time BI systems providing a more structured user experience.
Today, BI systems’ richness in dashboard visualization, reporting, performance management metrics have proven itself to be a vital factor for building actionable advanced analytics.
As we know, Business Intelligence is to help business users to gather insights from the available data. So, a good BI tool doesn’t dump data, it guides the user through subsequent steps.
So, lets have a look at some of the BI attributes, based on which a business user can decide if any given BI tool is worth relying or not.
Visual Conceptualization
This is the most crucial attribute any BI tool must have. Visual data representation is one such way which can create wonders by increasing efficiency and reducing IT dependency.
Today’s BI tools are mostly infographics-based. This helps the business users to avoid data chaos in a visually appealing way. This also provides relief from confusing excel sheets and charts, making it easier to take swift decisions.
Relevant Tool: Qlik
Drill – down Data
Drilling down data refers to diving deep into the pool of data to recover relevant information which would be segregated according to desired location, origin source and other factors.
With the increasing pressure of real-time decision making, it has emerged out to be an important feature. It not only saves precious time which is often poured over spreadsheets, but also allows to get down to the nitty-gritty by drilling down and narrowing the search in just a click.
Relevant Tools: Datameer, Pentaho
Suggestive Aptitude
A good BI tool is that which applies its data knowledge to suggest the way forward. Also, a smarter suggestive intelligence is used to explore patterns and suggest solutions based on existing data.
For instance, if ‘x’ company is wondering why their sales figure looked dismal in the any of the month, then suggestive aptitude of an effective BI tool can help. It is because it can find relevant people amongst thousands of employees who can solve this dilemma.
Relevant Tool: IBM Cognos Intelligence
Righteous Collaboration
In almost every organization there’s a goose chase for the right person when some vital problem arises and that needs to be solved at the earliest. In this scenario, BI tools with righteous collaboration can help in finding the right people who can come up with the desired solution in no time, without holding endless meetings.
BI tools enable you to find the right people who can give you answers quickly without sending you on a goose chase or holding endless conferences and meetings with your teams. For instance, you share the infographic which shows the dismal sales in Tokyo to suggested marketing and sales people. These are the people who hold the answers to your question and solve your query instantly.
Furthermore, if a team member wants to analyze data, view progress dashboard, or share and discuss data, a good BI tool should provide seamless collaboration features to facilitate decision-making.
At the end, this would ensure that all the team members are on the same page and are able to fruitfully reap maximum qualitative or quantitative insights.
Relevant Tools: IBM Cognos Intelligence, Tableau
Predictive Intelligence
Business processes are always dynamic – ever-changing and unpredictable. So, always resorting to inner voice is not enough. It needs precession, even a small mistake can create blunders, therefore predictive intelligence is an important feature for any BI tool.
So, one must ponder which tool is right?
Almost all BI tools possess one or more attributes that have been discussed above. But there are some tools which have proven their mettle since long. So, let’s have a look at the best five!
Relevant Tool: Tableau
Tableau
Tableau is voraciously used all over the world due to its user-friendly features and integrations. It is also one of the leading BI tools which is used for Big Data and Hadoop. Adding another point to its feature list, it provides connectivity to various Hadoop tools for various data sources like Hive, Cloudera and HortonWorks.
Not only with Hadoop, but also Tableau has an option to connect its data source from over 50 different sources including SAP and AWS.
As a visualization tool, Tableau provides top notch user experience with its highly advanced features like bar graphs, pie charts, heat maps many other features.
Datameer
Another BI tool which is popular for its Big Data and Hadoop integration is ‘Datameer.’Also, it not only supports Hadoop, but also many other data sources like Excel, SQL, MySQL and other tools and frameworks.
Datameer’s self-service analytics helps users perform all the required steps by themselves. Carrying out vital process like: Integration, preparation, analysis, visualization and operationalization can be done with ease.
Pentaho
Pentaho is another out-of-the-box tool which is highly dependable, as it is the brain child of Hitachi group companies. It is an analysis platform for Big Data and Hadoop which provides big data tools to extract, formulate and blend user’s data.
Pentaho’s specialty is its top-class visualizations and analytics. From Hadoop and Spark to NoSQL, Pentaho allows its users to turn their big data into big insights, and in turn change the way they run their businesses.
So, if any user uses data source like Hadoop, then Pentaho provides an option to perform data integration, visualization, and reporting all at the same time.
Qlik
Qlik is not just another BI tool that works on Hadoop and Big Data domain. It is different from the rest because of its ability to integrate with social media platforms like Facebook, which we won’t find with most of the BI tools.
Also, Qlik allows its users to connect with various data sources like SAS, SAP, SOL, Hadoop, SQL etc. for analysis and reporting.
IBM Cognos Intelligence
In any form of business; information silos, excessive dependence on spreadsheets, managing multiple platforms, handling data overflow are some of the common hinderances that business owners face.
But, with business analysis software from IBM, the process of analyzing business data to understand the performance and recommending improvements have been taken to a new level.
IBM Cognos Intelligence allows its users to explore their business data from different angles and perspectives and compare it with emerging trends for a more extensive view of their businesses. So, the facts needed for better results are always right at the fingertips of its users.
However, there might be one tool which is good for drilling down data, but it may not be that good at visual representation. Another tool might solve most of the business pain points, but its predictive intelligence may need improvement.
So, one needs to select the right BI tool based on the aspects that are most important to satisfy their business needs. If it solves one’s business needs and provides the right features, it is the right BI tool for that organization.
#security testing services#android application automation#test automation services#cyber security testing services#software test automation services#devops service providers#performance testing services#ui ux development services#automation testing company#devops services#front end development services#devops engineering services
0 notes