#RealWorldGIS
Explore tagged Tumblr posts
Visit Tumblr Blog
Explore Tumblr blogs with no restrictions, modern design and the best experience.
Last Seen Tumblr Blogs


Fun Fact
In 2020, 27% of US Tumblr users had an annual household income of over $100,000.
Text
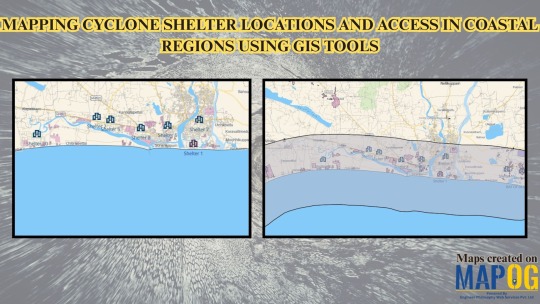
Mapping Cyclone Shelter Locations and Access in Coastal Regions Using GIS Tools
In seismically active regions, the safety of school infrastructure and evacuation zones is crucial. With GIS tools, students and researchers can develop interactive maps to assess school location safety, evacuation access, and hazard exposure. By layering schools, roads, fault lines, and land use, raw spatial data becomes a powerful visual tool for planning and preparedness.
Why Use GIS to Map School Safety in Earthquake Zones?
In earthquake scenarios, rapid evacuation and structural integrity determine outcomes. GIS helps us explore vital questions:
Are schools located near active fault lines?
Do they have accessible evacuation routes?
How many students fall within high-risk zones?
By overlaying spatial layers such as roads, topography, and school locations, users can assess exposure and propose mitigation strategies. Intuitive tools make it accessible for educational and planning use with no coding required.
Key Benefits of GIS Mapping in Education and Risk Assessment
Through hands-on spatial planning, this activity teaches essential GIS techniques like buffering and shelter mapping, applies real data to emergency scenarios, and brings together students, organizations, and agencies to build geospatial insight and improve disaster response efforts.
How to Use GIS tools for a Cyclone Shelter Mapping Project
Start your project by opening a new story, giving it a relevant name and description that highlights cyclone shelter mapping. Load critical layers including administrative borders, road networks, and land use to reflect populated zones. Draw the coastline using Add Story, and apply a 5 km buffer to mark the cyclone-prone region. Manually place cyclone shelters, adding key attributes such as capacity and emergency contacts. Use custom symbols and clear labels for better understanding. Share the finished map through the publish feature for emergency planning and public awareness.

Sample Data Fields for School Safety Mapping
Location, Student Capacity, Elevation (m), Evacuation Area, Nearby Roads, First Aid Kits, Seismic Retrofitting, Managed By, Safety Radius, Building Type, Year of Construction, Past Earthquake Impact, Safety Officer Name & Number
Educational Impact and Use Case
This GIS-based project turns seismic risk analysis into a student-friendly learning experience. It builds technical and spatial thinking skills while encouraging proactive planning. Ideal for subjects like geography, earth science, disaster risk reduction, and urban planning, this project prepares students for real-world problem solving and public safety applications.
Whether you're mapping logistics hubs or earthquake safety zones, GIS tools help reveal risks and prepare smarter responses. In vulnerable regions, it becomes a critical planning resource.
Conclusion
Mapping school safety in earthquake-prone areas using GIS platforms like MAPOG is a simple, effective way to connect learning with life-saving action. With basic layers and thoughtful analysis, students and researchers can evaluate risks and improve evacuation readiness.
🌐 Ready to create your school safety zone map? Start mapping smarter today.
Map school safety in earthquake-prone regions using free GIS platforms like MAPOG. Learn how students and researchers can assess hazards, add key infrastructure points, and improve community preparedness through interactive mapping.
#GISMapping#EarthquakePreparedness#SchoolSafety#MAPOG#SpatialPlanning#EmergencyResponse#GeographyEducation#FreeGIS#UrbanPlanning#RealWorldGIS
1 note
·
View note