#RvsPython
Explore tagged Tumblr posts
Visit Tumblr Blog
Explore Tumblr blogs with no restrictions, modern design and the best experience.
Last Seen Tumblr Blogs


Fun Fact
The Tumblr office adopted Tommy, an 11-year-old Pomeranian.
Text
Why R Still Matters in the Data-Driven World of 2025
A Brief History of R
R, a language and environment for statistical computing and graphics, was conceived in the early 1990s by Ross Ihaka and Robert Gentleman at the University of Auckland, New Zealand. It was designed as a free and open-source alternative to expensive statistical software, democratizing data analysis and visualization. Over the years, R has evolved into a powerful tool embraced by data scientists, statisticians, and analysts worldwide. Its community-driven development model has resulted in a vast ecosystem of packages that enhance its core capabilities.

Why learn R
How R Differs from Python or Excel
While Python, Excel, and R are all popular tools for data manipulation and analysis, they serve different niches:
Python is a general-purpose programming language with extensive libraries for machine learning and data manipulation, such as NumPy, pandas, and TensorFlow. It is known for its versatility and readability.
Excel is a spreadsheet software that provides a user-friendly interface for organizing and analyzing data. It is ideal for small to medium-sized datasets and is widely used in business settings.
R, however, is specifically designed for statistical computing. Its syntax and functions are tailored for data analysis tasks. R excels in advanced statistical modeling, making it a go-to choice for statisticians and researchers.
Key Features of R for Statistical Computing
R offers a range of features that make it indispensable for statistical analysis:
Comprehensive Statistical Techniques: R provides a wide array of statistical tests, models, and data mining techniques directly out of the box.
Data Visualization: With packages like ggplot2, R allows users to create sophisticated and interactive graphics that help in data exploration and presentation.
Extensibility: R's package ecosystem is vast, with over 18,000 packages available on CRAN (Comprehensive R Archive Network), ensuring there is a tool for almost every statistical task.
Reproducibility: R Markdown and R scripts facilitate the documentation of analysis steps, ensuring that results can be reproduced and verified.
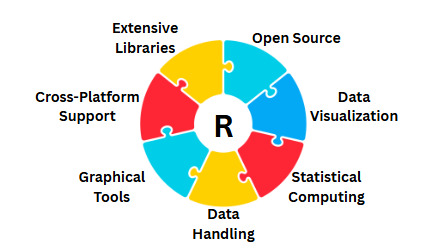
Feature of R
Where R Is Used Today
R's application spans a variety of fields, highlighting its versatility and robustness:
Academia: R is a staple in academic research, used for teaching statistics and research methods across disciplines.
Government: Agencies such as the U.S. Census Bureau leverage R for data analysis and reporting.
Healthcare: R is employed for bioinformatics, epidemiological research, and clinical trial data analysis.
Finance: Financial analysts use R for risk assessment, portfolio management, and predictive modeling.
Research Labs: R is a trusted tool in scientific research for data exploration and hypothesis testing.
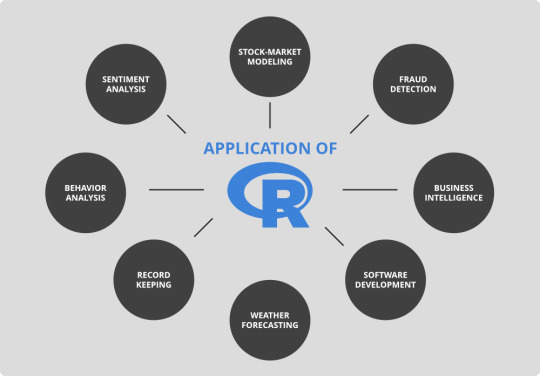
Application of R Language
Real-World Hook: WHO and Pharma Companies
The World Health Organization (WHO) and pharmaceutical companies rely heavily on R for public health insights. During the COVID-19 pandemic, R was utilized for modeling the spread of the virus, analyzing vaccine efficacy, and tracking public health interventions. Pharmaceutical companies use R for drug discovery, clinical trial analysis, and regulatory submissions, underscoring its critical role in advancing healthcare outcomes.

Real World Application
FAQs
1. Is R difficult to learn for beginners?
R can have a steeper learning curve compared to Excel, but numerous online resources and communities can help beginners get started. Its powerful features make the initial effort worthwhile.
2. Can R handle large datasets efficiently?
While R is not inherently optimized for big data, packages like data.table and connections to databases or big data platforms like Hadoop can enhance its capability to handle large datasets.
3. How does R ensure the reproducibility of results?
R Markdown and version-controlled scripts promote reproducibility by documenting each step of the analysis, allowing others to replicate the results seamlessly.
4. Are there any industries where R should not be used?
R is less suited for real-time analytics or applications requiring high-speed computation, such as gaming or streaming services. However, for statistical analysis, it's highly effective.
5. What resources are available for learning R?
There are numerous free resources, including the R documentation, online courses on platforms like Coursera and edX, and community forums like RStudio Community and Stack Overflow.
Home
instagram
youtube
#RProgramming#DataDrivenWorld#StatsWithR#DataScience2025#AnalyticsTools#OpenSourceStats#RvsPython#TechForGood#ResearchWithR#SunshineDigitalServices#Instagram#Youtube
0 notes
Photo
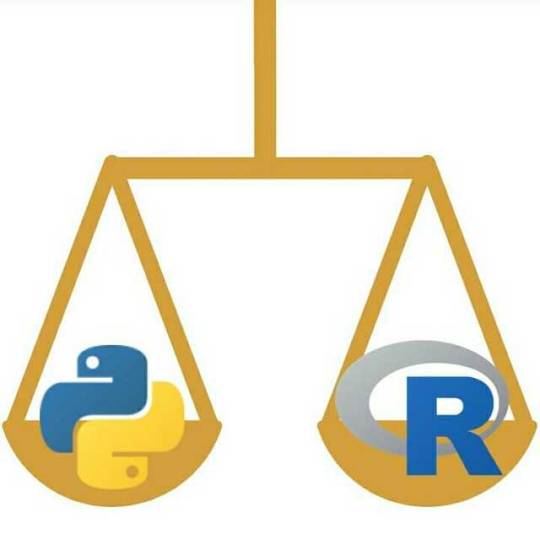
R Vs Python ⏩Swipe Left⏩ R and Python are both open-source programming languages with a large community. New libraries or tools are added continuously to their respective catalog. R is mainly used for statistical analysis while Python provides a more general approach to data science. Choice between R or Python depends on: 1. Statistical analysis or deployment 2. The amount of time you can invest 3. Your company/industry most-used tool #data#science#datascience#datascientist#engineer#datascienceengineer#python#dataanalyst#computerscience#business#hotdatascience#R#Rvspython https://www.instagram.com/p/Bt3uyfQAhUX/?utm_source=ig_tumblr_share&igshid=uec7isl87155
#data#science#datascience#datascientist#engineer#datascienceengineer#python#dataanalyst#computerscience#business#hotdatascience#r#rvspython
0 notes
Photo

Top 4 Data Analytics Tools http://ehelpdesk.tk/wp-content/uploads/2020/02/logo-header.png [ad_1] TOP 4 DATA ANALYTICS TOOLS //Dat... #analysistools #analyticstools #bigdata #bigdataanalyticstools #businessintelligence #charts #code #coding #dashboard #data #dataanalysis #dataanalyst #dataanalysttools #dataanalytics #dataanalyticstools #datacharts #datadashboard #dataengineer #datamodeling #datascience #datascientist #datascientisttools #datatools #datavisualization #excel #exceldashboard #excelformulas #excelfunctions #excelmacros #excelvba #graphics #machinelearning #microsoftaccess #microsoftoffice #microsoftoffice365 #microsoftpowerbi #microsoftproject #microsoftword #officeproductivity #pivottables #powerpivot #powerpoint #programming #python #pythonprogramming #pythonvsr #rvspython #sap #sas #sasprogramming #statistics
0 notes
Photo
Data Visualization 📊📊 #datavisualization #graphs #histogram #ggplot2 #matplotlib #rvspython #python #machinelearning #data #datascience #tech #technology #geekgirl #geek #Analytics #outliers_x (at Bangalore, India) https://www.instagram.com/p/BypnSQWgfO5/?igshid=18zv9xzl7du1o
#datavisualization#graphs#histogram#ggplot2#matplotlib#rvspython#python#machinelearning#data#datascience#tech#technology#geekgirl#geek#analytics#outliers_x
0 notes
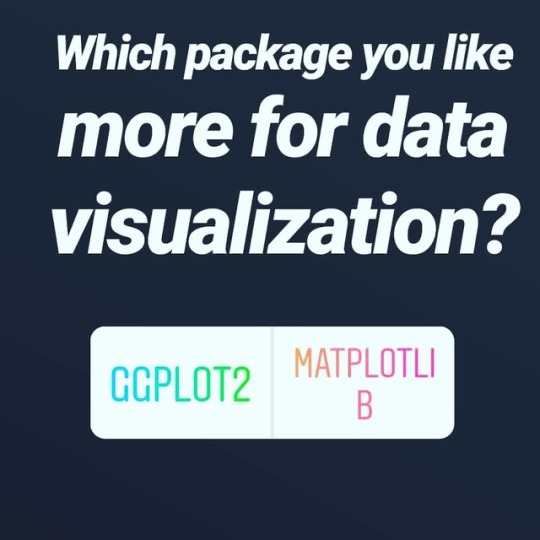
Photo
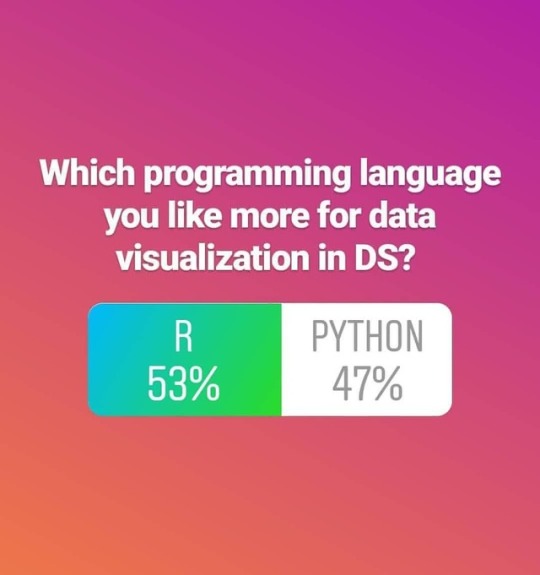
R Vs Python for Data Visualization 📊 #rvspython #datavisualization #data #analytics #datascience #dataanalytics #ai #deeplearning #machinelearning #analyze #tech #technology #knowledge #information https://www.instagram.com/p/BxePvhqgAbn/?utm_source=ig_tumblr_share&igshid=k9mlzty08ld5
#rvspython#datavisualization#data#analytics#datascience#dataanalytics#ai#deeplearning#machinelearning#analyze#tech#technology#knowledge#information
0 notes