#WSJ 15 to WSJ 24 (1992)
Explore tagged Tumblr posts
Visit Tumblr Blog
Explore Tumblr blogs with no restrictions, modern design and the best experience.
Last Seen Tumblr Blogs


Fun Fact
There were a total of 171.5 billion posts on Tumblr in 2019.
Text
Togashi's Comments from the Table of Contents (1990-1994)
WSJ #15 to WSJ #24 (1992)
Volume 8: Chapters 64 to 72
ᐊ Volume 7: Chapters 56 to 63 Volume 9: Chapters 73 to 81 ᐅ
1992
➤ Weekly Shounen Jump N°15 (March 30, 1992)
★ Chapter 64. "Open Your Eyes!!" (目を覚ませ!!, Me o Samase!!)
*This issue also comes with a Yusuke telephone card*

Table of Contents:
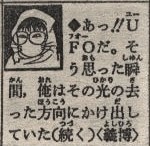
"Aah!! It's an UFO. The moment I thought so, I was already running in the direction of that light. (to be continued)" - Yoshihiro
🇯🇵 あっ!!UFOだ。そう思った瞬間、俺はその光の去った方向にかけ出していた(続く)〈義博〉
➤ Weekly Shounen Jump N°16 (April 6, 1992)
★ Chapter 65. "One vs. Three!!" (1対3!!, Ichi Tai San!!)
Table of Contents:
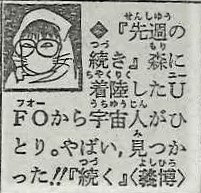
"(Continued from last week) There's one alien from the UFO that landed in the forest. Yeek, I was found!! (to be continued)" - Yoshihiro
🇯🇵 『先週の続き』森に着陸したUFOから宇宙人がひとり。やばい、見つかった!!『続く』〈義博〉
➤ Weekly Shounen Jump N°17 (April 13, 1992)
★ Chapter 66. "The Shadow Channelers Take Center Stage!!" (魔性使いT登場!!, Mashō-zukai Chīmu Tōjō!!)

Table of Contents:
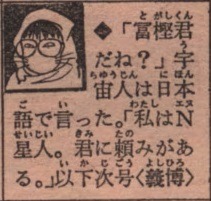
"'Togashi-kun, right?' - The alien said in Japanese. 'I'm Alien N. I have a request for you.' (continues in the next issue)" - Yoshihiro
🇯🇵 「冨樫君だね?」宇宙人は日本語で言った。「私はN星人。君に頼みがある。」以下次号〈義博〉
➤ Weekly Shounen Jump N°18 (April 20, 1992)
★ Chapter 67. "Gama: Ritual Body Art Master!!" (化粧使い・画魔!!, Keshō-zukai - Gama!!)
Table of Contents:
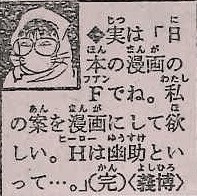
"Actually, I'm a fan of japanese manga. I want you to turn my idea into a manga. The hero is called Yusuke..." (End) - Yoshihiro
🇯🇵 実は日本の漫画のFでね。私の案を漫画にして欲しい。ヒーローは幽助といって…。<完>〈義博〉
➤ Weekly Shounen Jump N°19 (April 27, 1992)
★ Chapter 68. "Toya: Ice Master!!" (呪氷使い・凍矢!!, Juhyō-zukai - Tōya!!)
Table of Contents:
"After staying up for 40 hours, I slept for 18 hours. Ignoring the alarm clock, I slept like a log. I'm getting old." - Yoshihiro
🇯🇵 40時間起きっぱなしの後。18時間も寝てしまった。目覚し無視の爆睡ぶり。年ですな。〈義博〉
➤ Weekly Shounen Jump N°20 (May 4, 1992)
★ Chapter 69 (Colored). "A Battle All Alone" (ひとりきりの戦い, Hitori kiri no Tatakai)
*Part-color chapter with the lead pages in full color. Opening page says:
"Get out, get out of the way. Yusuke is coming through!"
They were also announcing: "volumes 1-5 now on sale".*


Table of Contents:

"Ms. Okamoto's dynamic answer from HEY! SAY! A BOARD OF EDUCATION was amazing. I'm more impressed than the correct answer." - Yoshihiro
🇯🇵 平成教育委員会の岡本さんのダイナミックな回答がすごい。正解以上に感心します。〈義博〉
T/N: "HEY! SAY! A BOARD OF EDUCATION" was an educational quiz variety program broadcast several times a year on Fuji TV from 1991 to 1997. Entertainer, race queen and gravure idol - Natsuki Okamoto - was a regular guest of the show who caught the viewers’ attention due to her unusual answers.
➤ Weekly Shounen Jump N°21・22 (May 18, 1992)
★ Chapter 70. "Fist of Rage!!" (一閃!怒りの拳!!, Issen! Ikari no Kobushi!!)
Table of Contents:
"We have savings for the first time in 700 days!! We're alone in 2nd place!! By the time this issue goes on sale, the magic will be lit up to win the championship! Long live the Hanshin." - Yoshihiro
🇯🇵 700日ぶりの貯金だ!!単独2位だ!!この号が発売される頃には優勝マジック点灯だ!!阪神万歳〈義博〉
T/N: Japanese Baseball terms:
- "Savings" (chokin): Accumulated surplus of wins; the number of wins exceeds the number of losses. Refers to the number of games a team is above the .500 mark.
- "Alone in 2nd place": the only 2nd place team that is not tied with other teams.
- "Magic (number) lights up": the magic number is a metric used to determine how close a team is to making the playoffs or winning the division. A team's magic number represents the combination of wins needed by that team and losses by its closest competitor to clinch a given goal. When your Magic Number hits zero, you've clinched the division. Called just "magic" in Japan, this value is used only when all other teams have lost the possibility of winning the championship on their own. The magic number is said to be "lit up" by the Japanese when this condition is met, and it is used as a way for the team to win. It’s fairly complicated calculation method, I'm not the best person to explain it, so please, if you’re interested, google for more info and real examples.
Hanshin failed to win the championship in 1992, it was won by the Yakult Swallows.
➤ Weekly Shounen Jump N°23 (May 25, 1992)
★ Chapter 71. "A Dangerous Gamble!!" (やばいカケ!!, Yabai Kake!!)
Table of Contents:
"The sixth volume of Yu Yu Hakusho will be released on June 10th! Let's all run to the bookstore!" - Yoshihiro
🇯🇵 『幽遊白書』の最新単行本第6巻は6月10日に発売!みんな本屋さんに走ろう!〈義博〉
➤ Weekly Shounen Jump N°24 (June 1, 1992)
★ Chapter 72. "Surpass the Reigun!!" (霊丸を越えろ!!, Reigan o Koero!!)
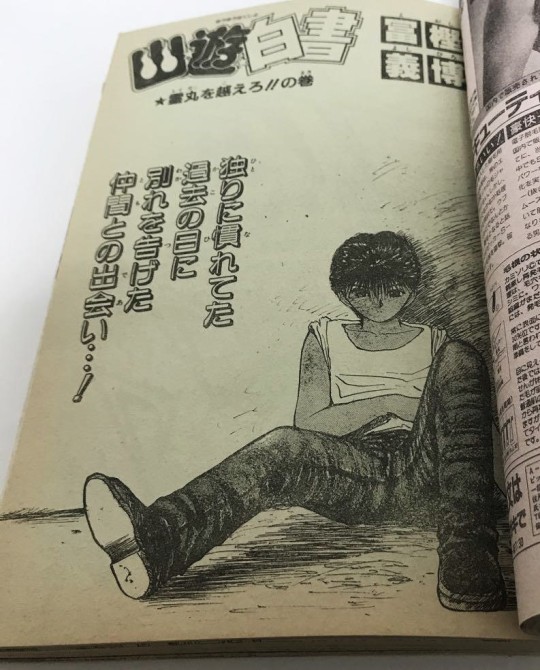
Table of Contents:

"Once I started bowling with my left hand by an accidental mischief, I had mixed feelings. I have more potential on this side." - Yoshihiro
🇯🇵 ふとしたいたずらで左手 がウリングを始めたら、こっちの方が筋がいい複雑な気分。〈義博〉
*On October 2, 1992, Volume 8 (Chapters 64 to 72) was published!*

▼ Togashi's comment from the dust jacket of volume 8. Translation by VIZ Media.

ᐊ Volume 7: Chapters 56 to 63 Volume 9: Chapters 73 to 81 ᐅ
#weekly shounen jump#table of contents#yoshihiro togashi#yu yu hakusho#volume 8#chapters 64-72#WSJ 15 to WSJ 24 (1992)
21 notes
·
View notes
Text
Case Study: Can Gold Rally Along With Inflation?
So I woke up a few days ago and saw this WSJ piece. Yes, world; letting real rates stay negative for so long was probably going to do that. I thought it would be a good excuse to compose another thought piece. Like the kids say: here goes nothing. Now we've detailed potential drivers for inflation in the past - with oil ripping towards new highs (Saudi-corruption-purge-driven or not), nominal rates ripping higher, and stocks falling, I was curious to also see gold also down. I am a strong believer that gold trades like a currency rather than a commodity. Commodities for the most part trade based on supply and demand. The demand function is usually the result of end-use products that during special situations may be propelled further by speculative fervor. Oil gets turned into gasoline and put into vehicles, grains, softs, meats get eaten, metals get thrown together to make cool stuff, etc. etc.
The supply function, in many aspects, behaves in accordance with price. Price goes higher, people invest in getting more of that high price "stuff" whatever it may be and vice versa. Gold is a bit different. Why? Like all commodities, it can store some value. But the key difference here is the fact that global central banks, those crazy economic professor types, deem it as a viable form of storer of value and medium of exchange so much that they accumulate it as reserves.
As a result, gold more than any other precious metal trades like a currency based on the rates of the country that it's denominated in.
So here we are at the focal investigation of the post. Hypothetically, if inflation rises (let's not argue this right now and just assume such is the case), will gold be a good hedge?
Let's go to the charts first, since I'm lazy.
Yes, yes I know - I didn't get the chance to run the regression on returns vs returns - I have a very finite window to use BBG and the files I build I cannot keep. On top of that, without a BBG API, it takes a horrific amount of time to manually extrapolate the real yield (before the existence of TIPS) by interpolating the CPI.
With my whining in mind, even with an "incorrect" price vs price regression - you can observe the directional relationship between gold and those rates. Also, the relative relationship between the different rate products vs gold should be valid as well (the base effect from the regression of price vs price as a result of the level differences should be somewhat negated as all the rate products are roughly on the same base level).
Spot gold px vs real yield shows the tightest connection here. So we'll focus in on that one for a sec.
From the above, it is evident that gold goes down when real yields go up in a semi-lockstep fashion. (I assume the economic driver here is: holding gold which yields vs holding a currency which in some situations can yield a lot in real terms and in other situations can yield very little or even negative in real terms)
Conclusion 1 - Gold trades rather closely with real yields. Although there are sure to be other factors influencing the gold price, it is roughly over the long term a function of real yields.
Moving along. Assuming the answered found in Conclusion 1. Can gold always be a good hedge for inflation? Or better yet, can real vs nominal yields diverge (widening of breakevens and thus the emergence of "inflation") without real yields actually going up significantly (real yields going up would theoretically put significant downward pressure on gold)
Let's look at some different yield regimes.
The two main interests that occupy my focus for this experiment. They are the high inflation periods of the 70's and 80's as well as the periods of shock post the dot-com bubble and the GFC.
Now I'm going to add some events to shed some qualitative light on the various worldly happens which caused individual reactions to rates.
FYI, for those with a short attention span - this will be a very long table. I will highlight in red those times when real rates were likely zero or negative (higher inflation vs fed funds rate) and I will also provide a summary at the bottom.
Disclaimers:
The inflation prints were averaged out for entire years while the Fed Funds rate is printed on the table only when a change occurs. Basically, this analysis is far from perfect.
However, assuming that those highlighted periods were times when real rates were either negative or close to zero is probably semi-safe. Besides what's life without the right amount of danger, eh?
Those with the curiosity of a cat and armed with a Bloomberg terminal can hopefully use this as a launch pad for additional analysis.
DateFed Funds Rate EventFed Chair Arthur Burns (January 1970 - March 1978)1971: GDP = 3.3%, Unemployment = 6.0%, Inflation = 3.3% Jan4.5% - 4.0%Expansion.Feb3.5%Jul5.5%Fed raised rate to fight inflation.Aug5.75%Wage-price controls.Nov5.0%Lowered rate to stimulate growth. 1972: GDP = 5.2%, Unemployment = 5.2%, Inflation = 3.4% Mar5.5%Raised rate to combat inflation. Confused markets.Dec5.75%1973: GDP = 5.6%, Unemployment = 4.9%, Inflation = 8.7% Jan6.0%Raised four times that month.Feb6.75%Lowered to 6.5%, then raised to 6.75%.Apr7.25%Raised for next five months.Aug11.0%OPEC embargo created inflation in October.1974: GDP = -0.5%, Unemployment = 7.2%, Inflation = 12.3% Feb9%Jul13%Raised from March to mid-July.Dec8.0%Lowered gradually from July to December.1975: GDP = -0.2%, Unemployment = 8.2%, Inflation = 6.9%Jan6.5%Lowered four times in January.May5.0%Lowered five times in five months.Sep6.5%Raised from June through September.1976: GDP = 5.4%, Unemployment = 7.8%%, Inflation = 4.9%Jan4.75%Lowered from October through January.Apr5.5%Raised in April and May.Nov4.75%Lowered from July - November.1977: GDP = 4.6%, Unemployment = 6.4%, Inflation = 6.7%Aug6.0%Raised from December through AugustOct6.5%Raised again in September and October.Fed Chair William Miller (March 1978 - August 1979)1978: GDP = 5.6%, Unemployment = 6.0%, Inflation = 9.0%Jan6.75%Dec10.0%Raised each month from April through December.Fed Chair Paul Volcker (August 1979 - August, 1987)1979: GDP = 3.2%, Unemployment = 6.0%, Inflation = 13.3% Apr10.25%Oct15.5%Raised rates 4 points.Dec12.0%Gradual decline through the month.1980: GDP = -0.2%, Unemployment = 7.2%, Inflation = 12.5%Jan14.0%Increased rapidly that month.Mar20.0%Raised rates in February and March.Jun8.5%Lowered to 9.5% in May and 8.5% in June. Sep12.0%Rates increased to 10.0% in August and 12.0% in SeptemberDec20.0%Raised steadily until mid-December.Dec 2918.0%Lowered two points.1981: GDP = 2.6%, Unemployment = 8.5%, Inflation = 8.9%Jan20.0%Reagan took office. Volcker raised rates again.Apr16.0%Lowered 4 points.May20.0%Raised 4 points.Dec12%Lowered 8 points.1982: GDP = -1.9%, Unemployment = 10.8%, Inflation = 3.8%Apr15.0%Raised 3 points.Dec8.5%Lowered nine times over nine months.1983: GDP = 4.6%, Unemployment = 8.3%, Inflation = 3.8%Aug9.66%Raised from May to August.Oct9.25%Lowered from August to October1984: GDP = 7.3%, Unemployment = 7.3%, Inflation = 3.9%Aug11.75%Raised from March to August.Dec8.25%Lowered from September to December.1985: GDP = 4.2%, Unemployment = 7.0%, Inflation = 3.8%Mar9.0%Raised from February to mid-March.Dec7.75%Lowered from April to December.1986: GDP = 3.5%, Unemployment = 6.6%, Inflation = 1.1%Aug5.66%Lowered from March to August.Dec6.0%Fed Chair Alan Greenspan (August 1987 - January 2006)1987: GDP = 3.5%, Unemployment = 5.7%, Inflation = 4.4% Sep7.25%Raised rates from April to September.Nov6.75%Lowered after October 19 stock market crash.1988: GDP = 4.2%, Unemployment = 5.3%, Inflation = 4.4%Feb6.5%Lowered in January and February.Dec9.75%Raised rates to fight inflation.1989: GDP = 3.7%, Unemployment = 5.4%, Inflation = 4.6%Dec8.25%S&L crisis. Fed lowered rates.1990: GDP = 1.9%, Unemployment = 6.3%, Inflation = 6.1%Dec7.0%Recession began in July.1991: GDP = -0.1%, Unemployment = 7.3%, Inflation = 3.1%Dec4.0%Recession ended in March.1992: GDP = 3.6%, Unemployment = 7.4%, Inflation = 2.9%Apr 93.75%Expansion.Jul 23.25%Sep 43.0%Clinton took office in 1993. Fed made no changes.1994: GDP = 4.0%, Unemployment = 5.5%, Inflation = 2.7%Feb 43.25%Mar 223.5%Apr 183.75%May 174.25%Aug 164.75%Nov 155.5%Raised rates.1995: GDP = 2.7%, Unemployment = 5.6%, Inflation = 2.5%Feb 16.0%Raised rates.Jul 65.75%Lowered rates.Dec5.5%1996: GDP = 3.8%, Unemployment = 5.4%, Inflation = 3.3% Jan 315.25%Kept rates low despite inflation.1997: GDP = 4.5%, Unemployment = 4.7%, Inflation = 1.7% Mar 255.5%1998: GDP = 4.5%, Unemployment = 6%, Inflation = 1.6%Sep 295.25%LTCM crisis.Oct 155.0%Nov4.75%1999: GDP = 4.7%, Unemployment = 6%, Inflation = 2.7%Jun 305.0%Raised ratesAug 245.25%Nov 165.5%2000: GDP = 4.1%, Unemployment = 6%, Inflation = 3.4%Feb 25.75%Raised rates despite stock market decline in March.Mar 216.0%May6.5%2001: GDP = 1.0%, Unemployment = 6%, Inflation = 1.6% Jan 36.0%Bush took office. Jan 315.5%Mar 205.0%Recession began. Fed lowered rates to fight it.Apr 184.5%May 154.0%Jun 273.75%EGTTRA tax rebate enacted.Aug 213.5%Sep 173.0%9/11 attacks.Oct 22.5%Afghanistan War.Nov 62.0%Dec 111.75%2002: GDP = 1.8%, Unemployment = 6%, Inflation = 2.4%Nov 61.25%2003: GDP = 2.8%, Unemployment = 6%, Inflation = 1.9%Jun 251.00%JGTRRA tax cuts enacted.2004: GDP = 3.8%, Unemployment = 6%, Inflation = 3.3%Jun 301.25%Low rates pushed interest-only loans. Helped cause Subprime Mortgage Crisis.Aug 101.5%Sep 211.75%Nov 102.0%Dec 142.25%2005: GDP = 3.3%, Unemployment = 6%, Inflation = 3.4%Feb 22.5%Borrowers could not afford mortgages when rates reset in 3rd year. Mar 222.75%May 33.0%Jun 303.25%Aug 93.5%Sep 203.75%Nov 14.0%Dec 134.25%Fed Chair Ben Bernanke (February 2006 - January 2014)2006: GDP = 2.7%, Unemployment = 6%, Inflation = 2.5% Jan 314.5%Raised to cool housing market bubble. More homeowners default.Mar 284.75%May 105.0%Jun 295.25%2007: GDP = 1.8%, Unemployment = 6%, Inflation = 4.1%Sep 184.75%Home sales fell.Oct 314.5%Dec 114.25%LIBOR rose.2008: GDP = -0.3%, Unemployment = 6%, Inflation = 0.1%Jan 223.5%Jan 30 3.0%Tax rebate.Mar 182.25%Bear Stearns bailout.Apr 302.0%Lehman fails. Bank bailoutapproved. AIG bailout.Oct 81.5%Oct 291.0%Dec 160.25%Effectively zero. The lowest fed funds rate possible.Fed Chair Janet Yellen (February 2014 - January 2018)2015: GDP = 2.6%, Unemployment = 6%, Inflation = 0.7% Dec 170.5%Growth stabilized.2016: GDP = 3.2%, Unemployment = 4.6%, Inflation = 0.4% (as of December, 19 2016)Dec 140.75%2017: GDP, Unemployment and Inflation TBDMar 151.0%Fed projects steady growth.Jun 141.25%
Whoa, that was a lot of blog space. If you want a descriptive version of what happened - here's an NY Times article.
So to summarize some of the events in the table, we have a few periods of interest. You have 1973 - 1979 where there were often times when real rates were either negative or close to being negative. Same can be said about 2004 - 2005 and then 2008 where real rates were negative at the end of the year. - 2016.
I believe monetary stimulus is much more effective (perhaps, only effective) when there is fiscal stimulus implemented in a concurrent fashion.
Here is a chart of long-term government spending.
If you carefully look, I saw spikes in government spending relative to government receipts in 1975-1977, what looks to be around 1987, 1992, 2001, and then 2009. Therefore, I expect those times, if combined with low/negative rates to create a sizable amount of inflation.
The opposite trend could be said from the mid 1990's to 2000. I would expect low inflation during this period especially if real rates were positive.
Now tying it all together with the gold price. I have three screenshots.
Rates: Nominal vs Real in different "regimes"
Corresponding gold in corresponding regimes
My weekly data for gold doesn't go back that far - so here is the chart for the first "regime (1975 to 1985) in monthly spot gold prices.
1975 - 1985
As you can see from the above: our data starts with gold falling close to ~50% (from 180 to below 100) from 1975 to late 1976 as real yields rose against steady nominals (a closing of the breakeven inflation).
Then, we experienced something extraordinarily scary - a rise in nominal yields with a falling real yield from 1978 to 1980. This development of inflation along with real yields actually trading lower led to an explosion in gold prices (trough to peak move of ~400% in one year) - proving that gold was indeed a good inflation hedge in this scenario. Finally, real yields marched higher along with nominals and gold went into a huge bear market.
So yes, there could be a bond bear market (nominal rates rising) while there is a breakout in inflation - during which gold would be a great hedge. However, interestingly, even with low rates and inflation during the early and mid-1970's, gold actually fell ~50%. Remember, 1975 we had the increase in government spending as noted above. In addition, we had close to negative real rates.
It seems that the direction of the real yield and the general direction of inflation actually caused gold prices to fall despite the absolute level of inflation was still high.
1985 - 1996
Moving on to the next time bucket. 1985-1996 saw a rally in gold from 1985 to 1988 coming out of the bear market. 1986 - 1987 saw a small pocket of breakeven inflation going higher, potentially triggering gold higher as well.
Interestingly as nominal rates continue to fall in the beginning of the 1990's - real rates roughly stay the same. Gold did not trade closely with real rates in this scenario and instead tracked breakeven inflation as both kept getting squeezed lower.
Lastly, you had meaningful moves in nominals and real yield first higher, then lower in 1994 to 1996. Gold ultimately did not care as it stayed tightly range bound.
1996 - 2009
A quick side note: of the 4 rates charts in the real vs nominal screenshot above, this regime's chart actually has the red line as the real yield and blue as the nominal - sorry for any confusion.
Continuing with the decrease in government spending and generally low inflation of the mid-1990's - gold continues to slide, goes nowhere.
Then, when we hit the 2000's, we started to see both nominals and real yield go lower. This move was roughly in tandem so I don't think breakevens were moving much. With a slight expansion of breakevens and inflation itself not really trading directionally despite lower rates and increased government spending, gold's reaction was to steadily build into a bull market.
In my opinion, this move in gold in the 2000's could be explained by persistently lower real yield. Inflation had risen slightly but it was nothing significant and definitely dwarfed by the move in gold.
Lastly, we have 2008 - 2009. Real yields spiked higher while inflation collapsed - gold subsequently sold off, tracking both inflation and real yields pretty well.
2009 - Present
Post GFC, the most interesting period of time was late 2011 to 2013. Nominals started to bottom out while real yield continued to march lower. We began building higher lows in breakevens as inflation looked poised to go higher.
This actually proved to be the peak in gold. As real yields spiked higher in what was later deemed the taper tantrum with gold going into bear market ever since.
Conclusion 2: After all that rambling, here's to summarize: I think gold is probably less of an inflation hedge than some might think. Although it does follow inflation to an extent - gold also seems to be very sensitive to real yield moves. If you believe real yields are set to rise along with inflation - then gold might not necessarily do very well - for example, 1981-1982, gold kind of topped out despite the fact that there was still pretty high inflation simply because real yields were rising.
But then, you have scenarios such as the early/mid-2000's with low and steady inflation, with a consistently lower real yield, where we also witnessed the foundation of a huge gold bull market.
And ultimately, there are scenarios of higher nominal yield and lower real yield - usually, they are ephemeral, lasting only a few months. However, we saw a meaningful one that lasted from 1978 to 1980.
Keep in mind as with many things in the market, it seemed that direction mattered more often than level. For example, when the widening of real and nominal rates in 1980 hit its zenith, gold was already peaking.
Other miscellaneous charts for your musings:
Here's FED and ECB assets vs. spot gold price
Here's gold vs the VIX
I think our own Macro Man did a little bit of analysis on that one as well. I'm sure all the readers have seen that one, but in case you haven't, here it is - linked here.
And that's all I got this go-round, guys.
Hope everyone has a wonderful day and weekend. Stay warm out there!
0 notes
Text
Togashi's Comments from the Table of Contents (1990-1994)
WSJ #17 to WSJ #26 (1991) Volume 3: Chapters 18 to 26
ᐊ Volume 2: Chapters 9 to 17 Volume 4: Chapters 27 to 35 ᐅ
1991
➤ Weekly Shounen Jump N°17 (April 15, 1991)
★ Chapter 18 (Colored Chapter). "The New Mission!!" (新たなる使命!!の巻, "Aratanaru Shimei!!")

Table of Contents:

“My first “part-color” after a long time, what did you think? I'll keep it in mind for future reference, so please send me fan letters!” - Yoshihiro
🇯🇵 久びさのパートカラーいかがでしたか?今後の参考にしますので、F・L (ファンレター) よろしくね 〜 !! 〈義博〉
T/N: In the old days, in addition to pages in full color, there used to be the "part-color” chapters. It is a technique that leaves out certain colors. It's like a cross between monochrome and color, except that certain colors are emphasized and the rest is rendered as monochrome. You can get a better idea by looking at Botan’s picture above, shades of red were added to highlight some parts. It’s also worth reading Togashi commentary on the Yu Yu Hakusho Artbook. He made some remarks about the coloring process and even revealed his brother, Hideaki Togashi, helped him with the backgrounds from this chapter.
➤ Weekly Shounen Jump N°18 (April 22, 1991)
★ Chapter 19. "Action!" (出動!!の巻, "Shutsudō!!")

Table of Contents:
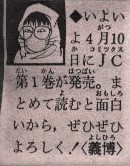
“The first volume of the Jump Comics will finally be released on April 10th. It's interesting to read the chapters all together. By all means, please take a look!” - Yoshihiro
🇯🇵 いよいよ4月10日にJC第1巻が発売。まとめて読むと面白いから 、 ぜひぜひよろしく! 〈義博〉
➤ Weekly Shounen Jump N°19 (April 29, 1991)
★ Chapter 20. "The Deadly Trio!!" (三匹の妖怪!!の巻, "Sambiki no yōkai!!")


Table of Contents:

“With the arrival of spring, my low back pain seems to have completely healed. However, I'm so busy at this time that I don't have time to go out.” - Yoshihiro
🇯🇵 春の訪れとともに腰痛はどうやら完治。だけど、今度は忙しくて外出する暇がないよ 〜 っ 〈義博〉
➤ Weekly Shounen Jump N°20 (May 6, 1991)
★ Chapter 21. "The Muncher of Souls!!" (魂を喰う男!!の巻, "Tamashii o Kū Otoko!!")


Table of Contents:

“I’ve just played two games of bowling for the first time in a long time, and my score dropped by 70. Shameful...!” - Yoshihiro
🇯🇵 ひさびさに2ゲームだけボーリングをやったら、スコアが70も落ちてた。なさけない…!〈義博〉
➤ Weekly Shounen Jump N°21・22 (May 13・20, 1991)
★ Chapter 22. "What Binds a Mother and Son!!" (母と子の絆!!の巻, "Haha to Ko no Kizuna!!")
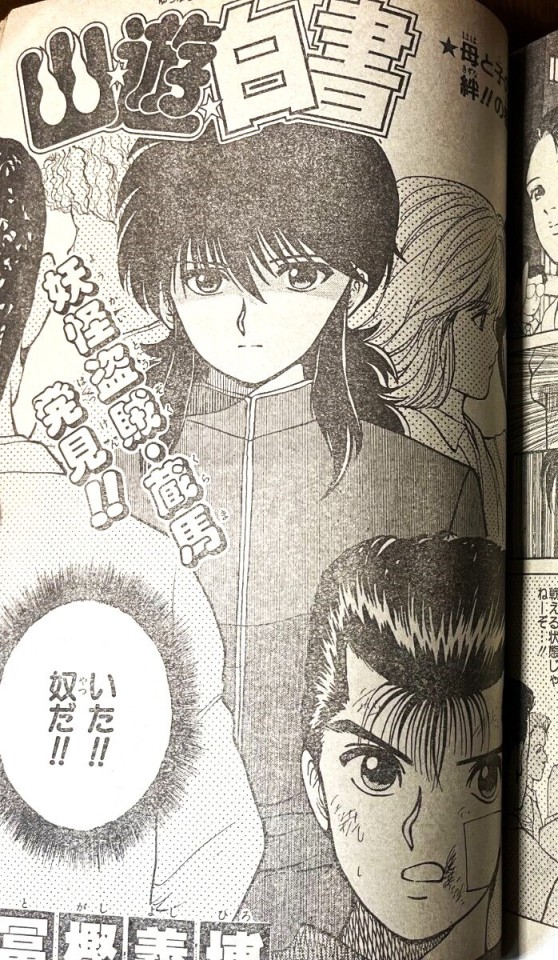

Table of Contents:

“At the time of writing the manuscript for this issue, our Hanshin Tigers still had only one win. Today, as well, is another day of perseverance...” - Yoshihiro
🇯🇵 この号の原稿をかいている時点で、我が阪神はまだ1勝。今日もやっぱり忍耐の日々か…〈義博〉
T/N: Togashi is a fan of bowling and baseball. In an article published in the V JUMP November 1992, he told about scoring 240 points in bowling and naming his tropical fishes after Hanshin’s players.
➤ Weekly Shounen Jump N°23 (May 27, 1991)
★ Chapter 23. "Hiei of the Evil Eye!!" (邪眼師·飛影!!の巻, "Jaganshi - Hiei!!")


Table of Contents:
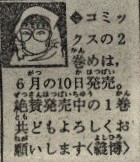
“The second volume of the comic will be published on the 10th of June. Along with the first volume which is now on sale with great reviews, I hope you will continue to support us.” - Yoshihiro
🇯🇵 コミックスの2巻めは、6月の10日刊売。絶賛発売中の1巻共どもよろしくお願いします〈義博〉
➤ Weekly Shounen Jump N°24 (June 3, 1991)
★ Chapter 24. "The Fearsome, Gruesome Binding Curse!!" (恐怖の呪縛獄!!の巻, Kyōfu no Jubakugoku!!")
*Yu Yu Hakusho is on the cover of this issue*
To learn about Botan’s hands on this cover, please check “The story behind Botan’s two left hands”.


▼ The illustration below, later used as cover of volume 3, was designed by Togashi in this issue to the Weekly Shounen Jump “7th Catch Phrase Grand Prix”. The winner was a 17-year old from Aichi Prefecture. The phrase written by Togashi on Yusuke’s long-hemmed tokkoufuku combat uniform is “Gokuraku- Oujou” (極楽往生). It means something like “peaceful dead” or “rebirth in paradise”. It’s a Buddhism/Hinduism concept in which Gokuraku is said to be a place where body and feeling are away from pain and only the basis of happiness exists.


Table of Contents:

“I watched the Giants-Hanshin game at the Tokyo Dome over the consecutive holidays. It's been a while since I've been to a baseball game, I was tired from all the excitement...” - Yoshihiro
🇯🇵 連休に東京ドームで巨人阪神戦をみてきました。久びさの野球観戦 、 興奮した分疲れた…〈義博〉
T/N: The consecutive holidays is the “Golden Week” (from end of April to early May). The June issue of the magazine is published in May.
➤ Weekly Shounen Jump N°25 (June 10, 1991)
★ Chapter 25. "Operation: Infiltrate!!" (潜入捜査開始!!の巻, "Sen'nyū Sōsa Kaishi!!" )
Table of Contents:

“The second volume of the comic will be released on June 10th. It's even more interesting to read them all together. I appreciate your support!!” - Yoshihiro
🇯🇵 コミックスの2巻めは、6月10日に発売。まとめて読むと一段とおもしろい。ヨロシク!!〈義博〉
➤ Weekly Shounen Jump N°26 (June 17, 1991)
★ Chapter 26. "The Cursed Forest!!" (魔性の森!!の巻, "Mashō no Mori!!")

Table of Contents:
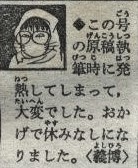
“I had a fever when I was writing the manuscript for this issue, it was very difficult. Thanks to it, I couldn’t take a rest.” - Yoshihiro
🇯🇵 この号の原稿執筆時に発熱してしまって、大変でした。おかげで休みなしになりました。〈義博〉
*On September 10, 1991, Volume 3 (Chapters 18 to 26) was published!*

▼ Togashi’s comment from the dust jacket of volume 3. Translation by VIZ Media.

ᐊ Volume 2: Chapters 9 to 17 Volume 4: Chapters 27 to 35 ᐅ
#weekly shounen jump#table of contents#yoshihiro togashi#chapters 18-26#yu yu hakusho volume 3#weekly shounen jump17-26 1991
21 notes
·
View notes