#accurate four integer height difference
Explore tagged Tumblr posts
Visit Tumblr Blog
Explore Tumblr blogs with no restrictions, modern design and the best experience.
Last Seen Tumblr Blogs


Fun Fact
Tumblr.com is the 103rd most visited website in the world.
Text

Remember when Cary Huang made that video on their old animation? (Total Kid Island) Yeah I drew Vanessa a full design and tried and failed styling it to TDIs style. Also Vanessa has one of those vape recovery things around her neck due to those Juuls that were popular with teenagers back in the 2020s.
#cary huang fan character#total drama island fan oc#total drama#ibs paint x#fan character#four bfb#art#digital art#ibspaint#reference sheet#accurate four integer height difference
1 note
·
View note
Text
Continuation of the earlier post.
In the earlier post, I was talking about the great mathematicians of the world. In this post, I am gonna talk about - Archimedes and Pythagoras.
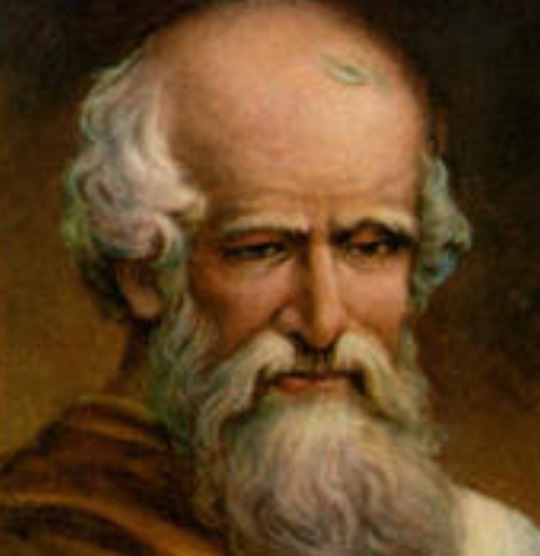
ARCHIMEDES
Archimedes was the most-famous mathematician and inventor in ancient Greece. Archimedes is especially important for his discovery of the relation between the surface and volume of a sphere and its circumscribing cylinder.He is known for his formulation of a hydrostatic principle (known as Archimedes’ principle) and a device for raising water, still used in developing countries, known as the Archimedes screw. Archimedes probably spent some time in Egypt early in his career, but he resided for most of his life in Syracuse, the principal Greek city-state in Sicily, where he was on intimate terms with its king, Hieron II. Archimedes published his works in the form of correspondence with the principal mathematicians of his time, including the Alexandrian scholars Conon of Samos and Eratosthenes of Cyrene. He played an important role in the defense of Syracuse against the siege laid by the Romans in 213 BCE by constructing war machines so effective that they long delayed the capture of the city. When Syracuse eventually fell to the Roman general Marcus Claudius Marcellus in the autumn of 212 or spring of 211 BCE, Archimedes was killed in the sack of the city.
TOP QUESTIONS
What was Archimedes’ profession? When and how did it begin?
What accomplishments was Archimedes known for?
What specific works did Archimedes create?
What is known about Archimedes’ family, personal life, and early life?
Where was Archimedes born? How and where did he die?
Study how turning a helix enclosed in a circular pipe raises water in an Archimedes screw
Study how turning a helix enclosed in a circular pipe raises water in an Archimedes screw
An animation of Archimedes screw.
Encyclopædia Britannica, Inc.
See all videos for this article
Far more details survive about the life of Archimedes than about any other ancient scientist, but they are largely anecdotal, reflecting the impression that his mechanical genius made on the popular imagination. Thus, he is credited with inventing the Archimedes screw, and he is supposed to have made two “spheres” that Marcellus took back to Rome—one a star globe and the other a device (the details of which are uncertain) for mechanically representing the motions of the Sun, the Moon, and the planets. The story that he determined the proportion of gold and silver in a wreath made for Hieron by weighing it in water is probably true, but the version that has him leaping from the bath in which he supposedly got the idea and running naked through the streets shouting “Heurēka!” (“I have found it!”) is popular embellishment. Equally apocryphal are the stories that he used a huge array of mirrors to burn the Roman ships besieging Syracuse; that he said, “Give me a place to stand and I will move the Earth”; and that a Roman soldier killed him because he refused to leave his mathematical diagrams—although all are popular reflections of his real interest in catoptrics (the branch of optics dealing with the reflection of light from mirrors, plane or curved), mechanics, and pure mathematics.
According to Plutarch (c. 46–119 CE), Archimedes had so low an opinion of the kind of practical invention at which he excelled and to which he owed his contemporary fame that he left no written work on such subjects. While it is true that—apart from a dubious reference to a treatise, “On Sphere-Making”—all of his known works were of a theoretical character, his interest in mechanics nevertheless deeply influenced his mathematical thinking. Not only did he write works on theoretical mechanics and hydrostatics, but his treatise Method Concerning Mechanical Theorems shows that he used mechanical reasoning as a heuristic device for the discovery of new mathematical theorems.
Get exclusive access to content from our 1768 First Edition with your subscription.
Subscribe today
His Works
There are nine extant treatises by Archimedes in Greek. The principal results in On the Sphere and Cylinder (in two books) are that the surface area of any sphere of radius r is four times that of its greatest circle (in modern notation, S = 4πr2) and that the volume of a sphere is two-thirds that of the cylinder in which it is inscribed (leading immediately to the formula for the volume, V = 4/3πr3). Archimedes was proud enough of the latter discovery to leave instructions for his tomb to be marked with a sphere inscribed in a cylinder. Marcus Tullius Cicero (106–43 BCE) found the tomb, overgrown with vegetation, a century and a half after Archimedes’ death.
sphere with circumscribing cylinder
sphere with circumscribing cylinder
The volume of a sphere is 4πr3/3, and the volume of the circumscribing cylinder is 2πr3. The surface area of a sphere is 4πr2, and the surface area of the circumscribing cylinder is 6πr2. Hence, any sphere has both two-thirds the volume and two-thirds the surface area of its circumscribing cylinder.
Encyclopædia Britannica, Inc.
Measurement of the Circle is a fragment of a longer work in which π (pi), the ratio of the circumference to the diameter of a circle, is shown to lie between the limits of 3 10/71 and 3 1/7. Archimedes’ approach to determining π, which consists of inscribing and circumscribing regular polygons with a large number of sides, was followed by everyone until the development of infinite series expansions in India during the 15th century and in Europe during the 17th century. That work also contains accurate approximations (expressed as ratios of integers) to the square roots of 3 and several large numbers.
On Conoids and Spheroids deals with determining the volumes of the segments of solids formed by the revolution of a conic section (circle, ellipse, parabola, or hyperbola) about its axis. In modern terms, those are problems of integration. (See calculus.) On Spirals develops many properties of tangents to, and areas associated with, the spiral of Archimedes—i.e., the locus of a point moving with uniform speed along a straight line that itself is rotating with uniform speed about a fixed point. It was one of only a few curves beyond the straight line and the conic sections known in antiquity.
On the Equilibrium of Planes (or Centres of Gravity of Planes; in two books) is mainly concerned with establishing the centres of gravity of various rectilinear plane figures and segments of the parabola and the paraboloid. The first book purports to establish the “law of the lever” (magnitudes balance at distances from the fulcrum in inverse ratio to their weights), and it is mainly on the basis of that treatise that Archimedes has been called the founder of theoretical mechanics. Much of that book, however, is undoubtedly not authentic, consisting as it does of inept later additions or reworkings, and it seems likely that the basic principle of the law of the lever and—possibly—the concept of the centre of gravity were established on a mathematical basis by scholars earlier than Archimedes. His contribution was rather to extend those concepts to conic sections.
Quadrature of the Parabola demonstrates, first by “mechanical” means (as in Method, discussed below) and then by conventional geometric methods, that the area of any segment of a parabola is 4/3 of the area of the triangle having the same base and height as that segment. That is, again, a problem in integration.
The Sand-Reckoner is a small treatise that is a jeu d’esprit written for the layman—it is addressed to Gelon, son of Hieron—that nevertheless contains some profoundly original mathematics. Its object is to remedy the inadequacies of the Greek numerical notation system by showing how to express a huge number—the number of grains of sand that it would take to fill the whole of the universe. What Archimedes does, in effect, is to create a place-value system of notation, with a base of 100,000,000. (That was apparently a completely original idea, since he had no knowledge of the contemporary Babylonian place-value system with base 60.) The work is also of interest because it gives the most detailed surviving description of the heliocentric system of Aristarchus of Samos (c. 310–230 BCE) and because it contains an account of an ingenious procedure that Archimedes used to determine the Sun’s apparent diameter by observation with an instrument.
Method Concerning Mechanical Theorems describes a process of discovery in mathematics. It is the sole surviving work from antiquity, and one of the few from any period, that deals with this topic. In it Archimedes recounts how he used a “mechanical” method to arrive at some of his key discoveries, including the area of a parabolic segment and the surface area and volume of a sphere. The technique consists of dividing each of two figures into an infinite but equal number of infinitesimally thin strips, then “weighing” each corresponding pair of these strips against each other on a notional balance to obtain the ratio of the two original figures. Archimedes emphasizes that, though useful as a heuristic method, this procedure does not constitute a rigorous proof.
On Floating Bodies (in two books) survives only partly in Greek, the rest in medieval Latin translation from the Greek. It is the first known work on hydrostatics, of which Archimedes is recognized as the founder. Its purpose is to determine the positions that various solids will assume when floating in a fluid, according to their form and the variation in their specific gravities. In the first book various general principles are established, notably what has come to be known as Archimedes’ principle: a solid denser than a fluid will, when immersed in that fluid, be lighter by the weight of the fluid it displaces. The second book is a mathematical tour de force unmatched in antiquity and rarely equaled since. In it Archimedes determines the different positions of stability that a right paraboloid of revolution assumes when floating in a fluid of greater specific gravity, according to geometric and hydrostatic variations.
Archimedes is known, from references of later authors, to have written a number of other works that have not survived. Of particular interest are treatises on catoptrics, in which he discussed, among other things, the phenomenon of refraction; on the 13 semiregular (Archimedean) polyhedra (those bodies bounded by regular polygons, not necessarily all of the same type, that can be inscribed in a sphere); and the “Cattle Problem” (preserved in a Greek epigram), which poses a problem in indeterminate analysis, with eight unknowns. In addition to those, there survive several works in Arabic translation ascribed to Archimedes that cannot have been composed by him in their present form, although they may contain “Archimedean” elements. Those include a work on inscribing the regular heptagon in a circle; a collection of lemmas (propositions assumed to be true that are used to prove a theorem) and a book, On Touching Circles, both having to do with elementary plane geometry; and the Stomachion (parts of which also survive in Greek), dealing with a square divided into 14 pieces for a game or puzzle.
Archimedes’ mathematical proofs and presentation exhibit great boldness and originality of thought on the one hand and extreme rigour on the other, meeting the highest standards of contemporary geometry. While the Method shows that he arrived at the formulas for the surface area and volume of a sphere by “mechanical” reasoning involving infinitesimals, in his actual proofs of the results in Sphere and Cylinder he uses only the rigorous methods of successive finite approximation that had been invented by Eudoxus of Cnidus in the 4th century BCE. These methods, of which Archimedes was a master, are the standard procedure in all his works on higher geometry that deal with proving results about areas and volumes. Their mathematical rigour stands in strong contrast to the “proofs” of the first practitioners of integral calculus in the 17th century, when infinitesimals were reintroduced into mathematics. Yet Archimedes’ results are no less impressive than theirs. The same freedom from conventional ways of thinking is apparent in the arithmetical field in Sand-Reckoner, which shows a deep understanding of the nature of the numerical system.
In antiquity Archimedes was also known as an outstanding astronomer: his observations of solstices were used by Hipparchus (flourished c. 140 BCE), the foremost ancient astronomer. Very little is known of this side of Archimedes’ activity, although Sand-Reckoner reveals his keen astronomical interest and practical observational ability. There has, however, been handed down a set of numbers attributed to him giving the distances of the various heavenly bodies from Earth, which has been shown to be based not on observed astronomical data but on a “Pythagorean” theory associating the spatial intervals between the planets with musical intervals. Surprising though it is to find those metaphysical speculations in the work of a practicing astronomer, there is good reason to believe that their attribution to Archimedes is correct.
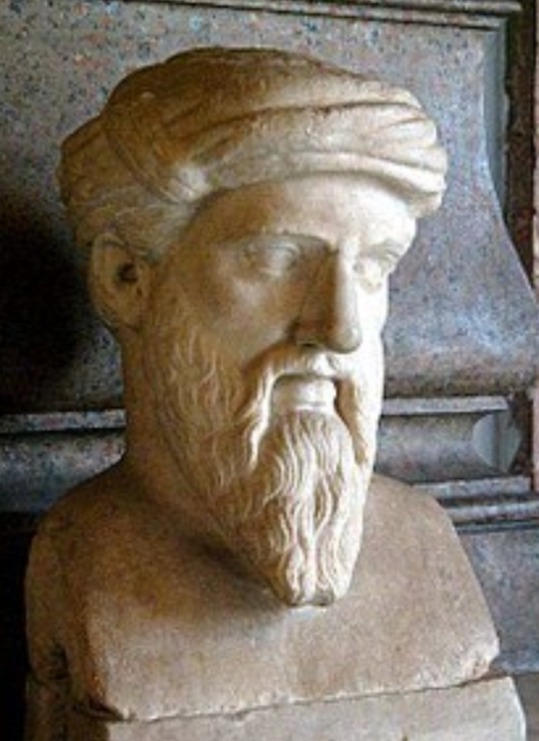
PYTHAGORAS
Pythagoras of Samos[a] (c. 570 – c. 495 BC)[b] was an ancient Ionian Greek philosopher and the eponymous founder of Pythagoreanism. His political and religious teachings were well known in Magna Graecia and influenced the philosophies of Plato, Aristotle, and, through them, Western philosophy. Knowledge of his life is clouded by legend, but he appears to have been the son of Mnesarchus, a gem-engraver on the island of Samos. Modern scholars disagree regarding Pythagoras's education and influences, but they do agree that, around 530 BC, he travelled to Croton in southern Italy, where he founded a school in which initiates were sworn to secrecy and lived a communal, ascetic lifestyle. This lifestyle entailed a number of dietary prohibitions, traditionally said to have included vegetarianism, although modern scholars doubt that he ever advocated for complete vegetarianism.
In the next post, I will be talking about ramanujan and shakuntala devi.
Follow me, stay tuned, next post will be uploaded soon.
1 note
·
View note
Text
Altitudes Effects in Calibration of Ground Doppler Radar for Rainfall Estimation - Juniper Publishers
Juniper Publishers - Open Access Journal of Engineering Technology

Abstract
Unipolar ground-based weather radar has been a widely-used instrument for rainfall measurement. These radar measurements however need to be calibrated for more accurate rainfall estimation. This article introduces a new calibration approach using time-stepwise processing of reflectivity-rainfall rate (Z-R) relationship. Based on previous work utilizing the radar-rainfall relationship; this article hypothesizes that the rainfall measurement from ground based radar are affected by distance from radar, altitudes and rainfall time duration. Two consecutive years unipolar ground-based radar data sets with 77 occurrences of rainfall from 39 stations in calibration window of three hours; and the corresponding rainfall measured from registered rain gauges were used in this study. The results indicated that radar-rainfall relationship Z=aRb is better improvise with altitudes effect (H) and empirical coefficient (c), such that (Z=aRbHc). The changes in ‘distance from the radar’ and ‘duration of precipitation’ were evidently significant. For radar-rainfall relationship individually (R2=min88, max97) with altitude effect (H) in relationship (R2=min70, max97). It is therefore concluded that the use of other effective parameters (distance from radar, altitudes and rainfall time duration) leads to optimum accuracy of Z-R relationship.
Keywords: Radar-rainfall; Relationship; Calibration; Altitudes
Abbrevations: RHI: Range Height Indicator; PPI: Plan Position Indicator; CAPPI: Constant Altitude Plan Position Indicator; IMO: Iran Meteorological Organization; dB: Decibel
Introduction
RHI: Range Height Indicator; PPI: Plan Position Indicator; CAPPI: Constant Altitude Plan Position Indicator; IMO: Iran Meteorological Organization; dB: Decibel
In this paper, we investigate the effects and properties of the altitude and rainfall time duration in radar-rain gauges relationship in order to ground-based radar calibration. Since 1948, after Second World War, weather ground-based radars are predicting rainfalls based on Marshal-palmer proposed relationship [6]. According to this universal relationship, there is a strong correlation between the rate of the radar reflectivity (Z) (dB) and the rainfall amount (R) (mm/h) that is known the Z-R relationship. Return signal from atmosphere targets are dimensionless information and called dimensionless radar output (DRO). The DRO value is the 8bit alteration of audio-visual motion that ranges between 0-255 dimension integers [3]. However, there are a strong relationship between Z and R in Z=AR^(b ) equation this does not mean that reflectivity from radar is exactly equal to the amount of rainfall [7,8]. The A and b are empirical coefficients which refer to climatological characters, location of rainfall, rainfall seasons, geographic latitudes [9] and rainfall time duration [10]. The empirical coefficients depend on climate characteristic in each area exclusively [11]. A lot of researches have been done to determinate Z-R relationships and relevant regional coefficient [12]. More than 100 relationships are available for different rainfall form such as strait form, tropical, convective, thunderstorm, shower, monsoon and hurricanes [7]. The sensitivity variation of Z–R relationships are the main uncertainty sources [13], especially in rainfall calculation based on DSD. Because of radar measurements carry many uncertainty sources depending on dissimilarities of radar reflectivity in the atmosphere; Radar calibration is unavoidable to estimate the amount of rainfall precisely [14]. Consequently the values of A and b coefficient is fluctuating from place to place, season-to-season, and time to time.
As, most of the improbability occur more far from the radar, distance from the radar is a main factor in all of uncertainty sources [15]. Most errors are found away from the radar [16]. This means that majority uncertainty is related to dimension from the radar [17]. Distance (d) between overshooting reflectivity (radar station) and the location of drop raining (DSD) is very important parameters to ground-based radar calibration. Previous studies have shown that this calibration can further improved radar-rainfall estimation by use of multiple Z-R relationship [18], rainfall types [19], distance from the radar [20] and other parameters [21]. These parameters are discussable in different weather situation in all rain’s types at duration of different seasons.
In addition to the above calibration, this study also hypothesize a new improvement of the universal relationship taking in to account the effects of altitude (H) and distance from radar (D) and other new coefficient such as (c). Thus producing new improve algorithm for the relationship such that Z=AR^(b) H^(c). The radar zones are defined in circular shape from the center of radar station. The effects of distance in rainfall estimation are investigated in 0-50km (zone 1), 50-100km (zone 2), 100-150km (zone 3) and 150-200km (zone 4) far from the radar. Also this paper uses the hourly rainfall products from registered rain gauges.
Radar Rainfall-Relationship
It is assumed that raindrop shapes are spherical and sizes are smaller than the radar wavelength. There are special equations between reflectivity and the characteristics of rain drops. It is important to qualify radar reflectivity (Z) because the reflectivity depends on the number and diameter of raindrops on the radar sample volume [22]. The reflectivity (Z) is dependent of number, diameter and velocity of rain drops;
And
Where Z(mm6 / m3 ) is reflectivity, R(mm / h) is the rainfall rate, N (D)dD is the mean sum of raindrops, D(dD)(mm) / m3 of air (Ni is the number of drops with Di the diameter of the ith element), and Vt (cm/second) is the droplet terminal velocity. If the above equation (1,2) with respect to the similarity parameters equivalent to each other, the equation (3) will be;
This means there are strong relationships between reflectivity and the amount of rainfall. According to this strong relationship, the A and b coefficient has been found consequence of improve the equation (3);
It is assumed that height differences (altitude) are more effective parameter in radar-rainfall estimation.
Here this paper tries to improve equation (4) and corroborate equation (5).
Unipolar Ground Based Radar
Unipolar ground based radar in Ahvaz, Iran (latitude: 31˚20’, longitude: 48˚40’ and 152m height) is use in this study. Figure 1 shows the location and configuration of Ahvaz’s radar station with the zones of data acquisition. The area of coverage by this radar footprint is between 29˚55’ until 32˚30’ in semi-arid zone at northern hemisphere. Ahvaz is a S-band radar which is located close the Ahvaz city in 31˚20’N with 7.5cm wavelength and 2GHZ that is serviced by 750 kilowatt transmitter power. The radar transmitter is of TXS 1500 model that includes a modulator with an active klystron tube-produce and amplifies microwave pulse. The antenna diameter and Radom diameters are 8.5m and 11.65m, respectively. The Doppler range is 200km and non- Doppler range is 400km; spatial resolution is 1x1km. Details about technical specifications are shown in Table 1. The station has the capability of producing the range height indicator (RHI), plan position indicator (PPI), constant altitude plan position indicator (CAPPI) and SRI.
This study, however, only used plan position indicator (PPI). The entire Ahvaz radar station is managed by Iran Meteorological Organization (IMO) and is under the jurisdiction of national weather radar network. The main radar data acquire reflectivity numerical amount per decibel (dB) unit. These data are processed using the RAINBOW software to convert radar reflectivity into dB unit. The rainfalls are typically in reflectivity range between 5-75dB; light rain begins at 5dB and hails at 80. To investigate changes due to different distances between reflectivity and rainfall location data were recorded from four zones surrounding the radar station (Figure 1).
Algorithm Process
The basic background of this theory for this study is that, for each altitude can estimate one Z-R relationship. Also Z-R relationship changes are considerable in each step time of rainfall time duration. Accordingly, it is designed two algorithms based on multiple regressions. In first step, the algorithm starts whit simple mode; relationship between one independent variable and one dependent variable. Rainfall (mm/h) in all equation is independent variable and radar reflectivity (dB) is dependent variable. Variable is arranged based time hourly. According to the general relationship (marshal- palmer), the equation is;
This relationship is extended for all station that is collection in 3 three hours of rainfall and four zones surrounding radar.
Where, Z is radar reflectivity, R is rainfall amount, ti is rainfall time duration, 1th-2th-3th hours of rainfall; here is investigated 3 time of rainfall from rainfall start until 3th time of rainfall based hourly. The j Z introduce four zones; zone1 (0-50km), zone2 (50-100km), zone3 (100-150km), zone4 (150-200km). The coefficient i a and i b are the empirical coefficients and tiZj e are partial errors in each zone and each time. Taking into account, all of the data in a coordinate system, we can to reach equation (8);
The (t) is mean; using all data in the entire region of rainfall in one coordinates.
Second algorithm tries to find new matrix mode of data with effects of altitude differences. This parameter for first time is used in this paper. When the factor H is considered in the second algorithm, the coefficient (c) is generated. (c) Coefficient is a novel empirical coefficient that is dependent of geomorphology rainfall location. Here after, (c) coefficient is called “altitude coefficient”. The new algorithm is introduced in equation (9); such that;
This algorithm is experimented in 3 hours of rainfall occurrences in 4 defined zones center about Ahvaz radar station.
Equation (10) parameters are exactly same equation (7), the only difference is n H . The n H show altitude changes at each point where the rainfall is measured. Taking into account, all of the data in a coordinate system, t; is the total of data. As a result, we can to reach equation (11);
As a result, equation (11) presents the relationship between reflectivity and all parameters and coefficients in all data in all places and all times of precipitation. However, previous studies have determined the relationship between reflectivity and rainfall amount based on power regression [3,4,10,13,18,23- 28]. But, it is possible that the relationship be manifested in other matrix form such as; linear, logarithmic or exponential regression. Here, according to Marshall-palmer first used power regression in all parameters of research. In this paper, in order to measure distances and geographic location control is used ArcGIS 9.3 software. It is used 2011b version of MATLAB software to mathematics and technical computing.
Results
There are strong relationship between radar reflectivity and rainfall amount in semi-arid zone in the middle latitudes and relevant coefficient. Z-R relationship is investigated in all zones and 3 time of rainfall time duration (Table 2).
Table 3 shows the amount of empirical coefficient (a, b) and relationship between variables in 4 zones and 3 times of rainfall. There are no significant differences between value obtained and other research in middle geographic latitudes. We found the range of coefficients of variation; (38.98
Exploration the relationship among altitudes (H), radar reflectivity (Z) and rainfall amount (R); Z-R-H
According to equation (11), Z = aRbHc + e has been proven, there are strong relationship between Z-R-H. In the new hypothesized relationship, upon entering H parameter, the c coefficient is generated. The c coefficient changes show the condition and characteristic of altitude parameter. Figure 3 schematically shows the general shape of the Z-R-H genesis, as discussed in this article. The value of this new empirical coefficient is a negative numeric, which infers that reflectivity (Z) with altitude (H) have inversely proportional relationship. Also, at higher elevations, much less radar reflectivity is noted. This can be interpreted based on the convective precipitation at height. The Z-R-H relationship is investigated in all zones and 3 time of rainfall time duration.
Table 3 shows the value of coefficient c with respect to other related parameters in all locations (zones) far from the radar station. We found that coefficient c varies within range of (0.0005) to (- 0.0952), with significant changes in distant zones. It is clearly evident that the amount of reflectivity is less in distant zones. But in terms of the third zone is different due to the mountainous conditions. It can be explained and justified. This result is not unexpected. Figures 4 & 5 are shown the amount of new empirical coefficient and relationship between 3 variables in 4 zones and 3th times of rainfall.
In summary it can be said; Z-R relationship at different heights, various distances from the radar station, even when rainfall begins moment to end rainfall is very changeable. Based on this theory that others parameters are effective and can be entered in the Z-R equation.
Therefore, the altitude parameter (H) was entered and confirmed through this study. Changes of RMSE, in simple mode (Z-R) and when use altitude parameter (Z-R-H) show that new improved algorithm has better fitting. Figure 5 demonstrate changes of RMSE from 4 introduced radar zones and 3 time of rainfall duration before and after use of altitude parameter (H). Amount of RMSE in new mode (Z-R-H) at 4 zones of radar and 3 times of rainfall is lower than before use of altitude parameter in equation. Figure 6 is fitting the previous equations (Marshall- Palmer, Rosenfeld and WSR 88) and our research with and without altitude parameter. Amount of RMSE confirm that the new Z-R-H equation is able to replace with universal Z-R equation (Table 3).
Discussion
Using the Z-R-H methodology for unipolar ground-based radar calibration and vagueness estimation provides beneficial and valuable outcomes. This equation is applied on the radar calibration, which suit precisely for unipolar ground-based radar type. The results of this study clearly illustrate that the agreement between radar reflectivity and rainfall amount is highly dependent on altitudes effects. Table 3 summarizes the comparison of Z-R relationship obtained with similar previous studies. The value of empirical coefficients from different areas is presented. This study noted Z-R relationship in semi-arid region, where the coefficients are unique. Also, considering that the other parameters have been ignored in radar rainfall estimation, this study has focused on three effective parameters in radar rainfall equation: altitudes effects, distance from radar and rainfall duration.
Accordingly, to investigate the effectiveness of distance from radar, areal coverage was divided into 4 zones. To determine impact of altitudes, altitude for all rain gauges was interfered in the equation. The first three hours of rainfall was considered in order to enable detection of changes in rainfall in initial precipitation and subsequent periods. Such results are commonly used for meteorology and hydrological applications; hence, this is beneficial and particularly important to similar regions of study.
This paper noted strong relationship (R2min=83) between radar reflectivity and the amount of rainfall (Z-R), in the semiarid zone in geographic middle latitude of northern hemisphere. Empirical coefficient (a,b) changes presented relevant correlation in different situation and location far from the radar source. They are strongly dependent. The new a/b coefficient expressed the changes empirical coefficient far from the radar. As it is distant away from the radar station, a/b coefficient decreases, indicating that radar echoes are less returning to receiver from far radar stations. This result is not unexpected, because the uncertainty resources have a large impact on the amount reflectivity. It is evident that all the empirical coefficients do not change with different time of rainfall. Nonetheless, there is no considerable a/b coefficient changes in first to third time of rainfall occurrence. Evidently, there are minor changes, but cannot be fully interpreted at this point time as they do not follow a logical sequence (Figure 4 & 7). The benefit of the a/b is obvious, since the changes of amount of rainfall changes with corresponding radar reflectivity in far from the radar (distance) and duration of rainfall time. Hereafter, in order to allow for very fine radar adjustment it is therefore better to use a/b coefficient instead of (a) and (b) coefficients separately. This fine adjustment is very sensitive in case like calibrating of Z-R relationship for urban areas for flood control that needs more caution. New coefficient a/b has the ability to show characteristic of region better than last empirical coefficients. It can be a strong default for ground based radar in different geographic latitude prior to anticipated operations.
The altitudes parameters entry in radar equation is the first attempt in this study and this is very crucial in this field of study. Given that the others parameters in the Z-R relationship can be effective, altitude (H) parameter is entered and for first time Z-R-H is defined. In the new hypothesized relationship, upon entering H parameter, the coefficient c is generated. The coefficients changes show the condition and characteristic of altitude parameter. Figure 6 shows an overall trend of the Z-R-H, as discussed in this article. Although the case study (Khuzestan province) is a relative flat area and parameter H with coefficient c changes are explainable in different location and times. Figure 6 is fitting the previous equations (Marshall-Palmer, Rosenfeld and WSR 88) and our research with and without altitude parameter. A change in c shows the effect of rainfall types (mountainous and conventional) in radar equation. Maximum value of R-square 98 in different time and different location shows there are strong relationships between 3 parameters, namely, the Z-R-H. The coefficient c changes ranges 0.0005 to-0.0952. We noted c coefficients are negative values, except highest value in the first zone at 3rd times of rainfall. These negative values in power of altitude parameter (H) display that at higher altitudes the return echo (Z) is lower than flat areas, and this is agreeable to amount of precipitation at higher altitudes is more than plain. These results can interpret amount of mountainous precipitation in radar-rainfall equation. An inevitable consequence of the relationship is that the H parameter and c coefficient would be the main part of radar-rainfall equation (Z-R) for future users in hydrometeorology. The ultimate amount of Z-R-H relationship for semi-arid zone is obtained and is given in Table 3.
The results of this study also well indicated that coefficient c alternate from first time of rainfall to other next times. So we can say that, when more time of precipitation passes the value of (c) coefficient is greater. We interpreted this is due to the “increase influence of convective phenomena”. Obviously, the level of this claim is a discussable theory. Notable issue is that, there is no a/b coefficient changes in duration of rainfall times but coefficient c varies considerably. The new relationship is very useful in watershed hydrology management because the duration of precipitation and distance from the location of the precipitation from basin outlet is very important especially in flood routing and flash flood control. Although, the authors have considered the new relationship in order to allow radar calibration, it is not doubtful that any improvement by using other effective parameters will be highly rational.
For more Open Access Journals in Juniper Publishers please click on: https://juniperpublishers.com
For more articles in Open Access Journal of Engineering Technology please click on: https://juniperpublishers.com/etoaj/index.php
For more Open Access Journals please click on: https://juniperpublishers.com
#Engineering Technology open access journals#Juniper Journals Reviews#Juniper publisher journals#Juniper publishers#Open Access Journals#Peer Review Journals
0 notes
Text
Ancient Tablet May Show Earliest Use of This Advanced Math
A new study claims the tablet could be one of the oldest contributions to the the study of trigonometry, but some remain skeptical.
Mercury (reason, speaking, writing) trine Amycus (monuments, commandments (as in carved in stone), pictographs and petroglyphs).

For nearly 100 years, the mysterious tablet has been referred to as Plimpton 322. It was first discovered in Iraq in the early 1900s by Edgar Banks, the American archaeologist on which the character Indiana Jones is thought to have been largely based. It was later bought by George Arthur Plimpton in 1922 and has been called the Plimpton 322 tablet ever since.
Now researchers from the University of New South Wales are calling it one of the oldest and possibly most accurate trigonometric tables of the ancient world.
Findings published in the journal Historia Mathematica, the official journal for the International Commission on the History of Math, reveal how researchers dated the ancient clay tablet and came to conclusions about its use.
The tablet is arranged in a series of 15 rows intersected by four columns. According to the UNSW researchers the tablet uses a base number of 60, which may have been used to allow ancient Babylonians to derive integers instead of fractions.
Norman Wildberger, explained that the research team reached their conclusions that the tablet was used for the study of triangles by findings based on ratios, not angles. In the top row of the tablet, said Wildberger, relatively equal ratios create a near equilateral triangle. Descending down the tablet, the ratios decrease the triangle's inclination, creating narrower triangles.
"It is a fascinating mathematical work that demonstrates undoubted genius," said University of New South Wales researcher Daniel Mansfield in a press release.
The researchers speculate the tablet could have been used to survey fields or construct buildings. For example, knowing the height and width of a building, ancient builders would have been able to calculate the exact measurements need to build pyramid slopes.
A Disputed History
The Greek astronomer Hipparchus has widely been considered the father of trigonometry. During his life, roughly dating to 120 B.C., he famously created a table of chords drawn from the center of a circle that resulted in angles from which he derived trigonometric formulas.
Does this study dethrone him? Not quite, say two experts on ancient mathematics.
Despite being in top condition for a tablet likely created around 1762 B.C., the left-hand edge of the artifact is broken. (Glue residue found on the side suggest the break was recent.) The team used previous research on Plimpton 322 to speculate that it was originally built with six columns and 38 rows.
Duncan Melville is a professor of mathematics at St. Lawrence University who specializes in Mesopotamian mathematics.
"Apart from the column headings, the tablet just consists of columns of numbers, and this invites a great deal of purely mathematical speculation," said Melville in an emailed statement to National Geographic. "Some of the different interpretations for construction of the tablet are mathematically equivalent and so just having the output on the tablet does not tell you much about the process used to generate that output."
Melville stated that to accept the study's results would in a sense redefine trigonometry, but Wildberger, who has previously argued for new theories of trigonometry, argued adopting a new mindset to understand how ancient Babylonians may have worked is essential.
Donald Allen, a mathematics professor at Texas A&M University, is also skeptical that the researchers have proven Plimpton 322 was used for trigonometry.
"It is old and accurate, but the interpretation of it as a trig table is conjecture, as it is broken, and the telling part would be contained with the part broken off, and never found," he said in an emailed statement.
Allen noted the most important finding from the tablet is the evidence of Pythagorean triples, indicating that Babylonians were seemingly aware of the Pythagorean theorem—years before Pythagorus. If the UNSW study does show how the tablet was used to find approximate solutions to equations involving triangles, only speculative historical context can determine exactly how the tablet was applied in day-to-day life said Wildberger.
If the Babylonians were the originators of trigonometry, say Allen and Melville, it was drastically improved in efficiency and accuracy by the Greeks nearly a thousand years later.
"Bottom line is this," says Allen, "if interpreted as a trig table, it would be the oldest known. Some of their computations were very accurate. Babylonian arithmetic was rather clumsy, but then so were Egyptian and Greek variations."
He noted that mathematicians in the ancient world heavily borrowed from one another, making it difficult to track their origins.
1 note
·
View note
Text
Processing Code: Project 4
//Katherine E. Hatton //New Media 3680A: Interaction Design //April 6th, 2017
//Special Thanks/Inspiration: //"Interaction Wiki"- Serial Communication, Arduino- Processing (The Code) //http://www.interactiondesign.se/wiki/courses:intro.prototyping.fall.2011.nov24
//Phillip Rockerbie- Multiple Communcartions with Sensors, seperating data, mapping
//Dana Cooley- Mapping, Troubleshooting
//Autumn Read- Sound
//Jared Gyorffy- Sound
//Andrew Faubert- 3D Printing
//How to Use: //Step 1: Upload code in Arduino CC and then run Sketch window in Processing. // Step 2: Either wrap sensor around finger via Velcro, or hold it between your fingers, or pressing down on sensor in order to get pulse data. //Step 3: As data is being read, sounds will begin to play and the visuals will change on Processing window. //Step 4: Try to decrease or incorease your heart rate in order to change the visuals and sounds //Step 5: Should an error occur such as a COM port being deleted, stop the program, unplug Arduino, re-plug in Arduino and re-upload both codes.
import processing.serial.*; //Talking between Arduino and Porcessing
int lf = 10; // Linefeed in ASCII (see: http://stackoverflow.com/questions/3091524/what-are-carriage-return-linefeed-and-form-feed) //int lf = 11; float value1; //integer declaration called "value." Top left heart. float value2; //These variables are related to the Pulse Sensors. Bottom left heart. float value3; // This is the variable for the data being read from the Pulse Sensors. Top right heart. float value4; //Without these variables, Processing cannot organize the data from the Sensors. Bottom right hert.
int bit = 128; //Variable called bit that equals 128. This is for the sound files, makes them sound better.
String myString = null; //String being created called "myString." Null is used here because processing is trying to access data that is not there yet. Serial myPort; // The serial port for the Arduino
String data =""; //The raw data in String form from the Serial
int index1 = 0; //These 3 index value are what holds the length of the String int index2 = 0; //These 3 index value are what holds the length of the String int index3 = 0; //These 3 index value are what holds the length of the String
//NOT WORKING //float HeartA; ////float a; //Heart 1 ////float b; //float c; //Heart 2 ////float d; ////float e; //Heart 3 ////float f; ////float g; //Heart 4 ////float h;
String Heart1,Heart2,Heart3,Heart4 = ""; //These contain the values in String form that are recieved from Arduino
//float conv_Heart1 = 0; //These are the converted Heart values from String to float
//SOUND import ddf.minim.*; //Importing Minim which is what lets Processing use music import ddf.minim.signals.*; //This is a second bit of code that is needed by Processing in order to use the generate function in minim; Minim minim; //This gives the library a variable function to be used in the program's semantics;
AudioSample a5; //Variable function (AudioSample) and variable name (a5) AudioSample a7; //Minim uses AudioSample to play multiple mp3's at once
AudioSample f1; //The letters are the notes (CDEFGABC). AudioSample f3; //The number is the octave. 1 is the lowest octave whereas 8 is the highest (in my sketch).
AudioSample c4; //Each sensor uses two of these AudioSamples AudioSample c7; //These notes are set within a numerical range, and when they are within that range, they will play. When they are not in the range, they will not play.
AudioSample g4; //Each grouping of notes (A, F, C or G) all correspond to a different instrument as well. AudioSample g8; //Eight notes all together, four instruments and four heart sensors.
void settings() { size(1500, 1000); //Size of window as seen by x and y. //For whatever reason, processing would not run the sketch window if my size was in setup. //Putting size in settings is what allows processing to run. }
void setup() { //size(1500, 1000); //size of window as seen by x and y parameters with x being 1500 pixels and y being 1000 pixels. background(255); //Background colour as seen in hexadecimal values //size(800, 600); //size(353, 400); //size(1525, 1700);
//SOUND minim = new Minim(this); //This tells the program to create a new isntacne of 'minim' out of the plug-in "Minim" s that it can play sounds //Heart1 a5 = minim.loadSample("a5_echo.mp3"); //AudioSample called a5 is loading up sample music called "a5_echo.mp3" a7 = minim.loadSample("a7_echo.mp3"); //I used FL Studios (music software) to create the sounds. Echo is an instrument on the program.
//Heart2 f1 = minim.loadSample("f1_bass.mp3"); //Bass instrument. f3 = minim.loadSample("f3_bass.mp3");
//Heart3 c4 = minim.loadSample("c4_synth.mp3"); //Synth piano instrument. c7 = minim.loadSample("c7_synth.mp3");
//Heart4 g4 = minim.loadSample("g4_drum.mp3"); //Drum-like instrument. g8 = minim.loadSample("g8_drum.mp3");
// List all the available serial ports println(Serial.list()); myPort = new Serial(this, Serial.list()[1], 9600); //The current port that Arduino is using. //myPort = new Serial(this, Serial.list()[7], 115200); myPort.bufferUntil('!'); //Reads the Serial myPort.clear(); // Throw out the first reading, in case we started reading // in the middle of a string from the sender. myString = myPort.readStringUntil(lf); //Reading the String line of data until a certain point, then stops. myString = null; // Special value used to signify the target is not a valid data element }
void draw() { background(0); //Black Background (0 amount of White) //rect(width/2, height, 100, -value/2); //background(#FC0589); noStroke(); //There is no stroke on Ellipses fill(#F50000); //Fill colour as seen in hexadecimal values //ellipse(width/2, height/2, -value/8, -value/8);
//4 circles one each corner different fill & different values:
//TOP LEFT CIRCLE fill(#ef4f91); //Hexadecimal colour ellipse(width/2 - width/4, height/2 - height / 4, -value1/2, -value1/2); //Ellipse as seen by x, y, radius, radius. Top Left fill(#00FFFF); //Hexadecimal float m = map(value1,0,1024,400,0); //Map function. Basically taking coordinates and setting new targets/ranges. As seen by map(value, start 1, stop 1, start 2, stop 2). ellipse(width/2-width/4, height/2 - height /4, m,m); //Mini ellipse using map function. Lies on top of above circle.
//BOTTOM LEFT CIRCLE fill(#c79dd7); //Hexadecimal colour ellipse(width/2 - width/4, height/2 + height / 4, -value2/4, -value2/4); //Ellipses are mathatically placed in sketch window using formula. This allows for change of size without resizing or re-positioning ellipses. Bottom Left fill(#b3ecff); //Hexidecimal float n = map(value2,0,1024,200,0); //Re-mapping circle to new cooradinates. All of this data is represented in 'n' ellipse(width/2-width/4, height/2 + height /4, n,n); //Mini ellipse using map function. Lies on top of above circle.
//TOP RIGHT CIRCLE fill(#FF3366); //Hexadecimal colour ellipse(width/2 + width/4, height/2 - height / 4, -value3/6, -value3/6); //Top Right fill(#33ccff); //Hexadecimal float o = map(value3,0,1024,100,0); //mapping ellipse(width/2+width/4, height/2 - height /4, o,o); //Mini ellipse using map function. Lies on top of above circle.
//BOTTOM RIGHT CIRCLE fill(#673888); //Hexadecimal colour ellipse(width/2 + width/4, height/2 + height / 4, -value4/8, -value4/8); //Bottom Right fill(#e6f9ff); //Hexadecimal float p = map(value4,0,1024,75,0); //mapping ellipse(width/2+width/4, height/2 + height /4, p,p); //Mini ellipse using map function. Lies on top of above circle.
//SOUND if (value1 > 100 && value1 < 200 ) //Setting a numerical range for sound { a5 . trigger ( ) ; } //When within set range, play song file. if (value1 > 200 && value1 < 300) //In this case, one of the ranges for value1 (recall that value1 is the pulse sensor data) is inbetween 200 and 300. { a7 . trigger ( ) ; } //When within 200-300 range, play a7 note.
if (value2 > 300 && value2 < 400) //Note that I am using AND (&&) boolean logic. { f1 . trigger ( ) ; } //This means that the values have to be greater than 300 AND less than 400. if (value2 > 400 && value2 < 500) //Were this to use OR logic, so long as value2 was greater than 400 OR less than 500, then play song file. { f3 . trigger ( ) ; } //If this were the case, it would constantly play a file because the parameters are constatly being met. (It could be greater than 400- anything above 400 is a go. OR so long as it is under 500, it is a go.)
if (value3 > 500 && value3 < 600) //AND makes the most sense and sends the data accurately. { c4 . trigger ( ) ; } //trigger is another form of .play, but trigger can be played multiple times and play with other trigger samples at the same time. if (value3 > 600 && value3 < 700) { c7 . trigger ( ) ; } //Trigger is more accurate in my case than if I were to use .play.
if (value4 > 700 && value4 < 800) { g4 . trigger ( ) ; } if (value4 > 800 && value4 < 900) { g8 . trigger ( ) ; } }
////////////////////////////////////////////////////////////////////// ///////////////////// ARDUINO CODE STARTS /////////////////////// ////////////////////////////////////////////////////////////////////// /* int analogPin = 0; int analogValue = 0; void setup(){ // start serial port at 9600 bps: Serial.begin(9600); } void loop(){ // read analog input, divide by 4 to make the range 0-255: analogValue = analogRead(analogPin); Serial.println(analogValue); // pause for 10 milliseconds: delay(50); } */
void serialEvent(Serial myPort) //Port Communcations between Arduino and Processing { data = myPort.readStringUntil('!'); //Read data sentence until you see a ! data = data.substring(0,data.length() - 1); //look for length of incoming String from Serial index1 = data.indexOf(","); //Seperating data (string) with a comma
index2 = data.indexOf("-"); //Seperating data (string) with a dash
index3 = data.indexOf("?"); //Seperating data (string) with a question mark //These indexs now hold the length of each parsed string
Heart1 = data.substring(0,index1); // //These heart String's (hahaha) hold the actual String values. //Heart1 (string) is reading data and holding values
Heart2 = data.substring(index1+1, index2); //Reading and storing data
Heart3 = data.substring(index2+1, index3); //Reading and storing data
Heart4 = data.substring(index3+1, data.length()); //Reading and storing data
value1 = float(Heart1); //Converting data to be visualized/transferred value2 = float(Heart2); //Converting data value3 = float(Heart3); //Converting data value4 = float(Heart4); //Converting data println("value : " + value1); //Printing in Value1 data below }
void convert() { //value1 = int(Heart1); //Just making sure the data was being read. // println("value : " + value1); //Converting data. Not needed anymore. }
////////////////////////////////////////////////////////////////////// ///////////////////// ARDUINO CODE ENDS /////////////////////// //////////////////////////////////////////////////////////////////////
0 notes