#and my art automation system is also based off of a spreadsheet :)
Explore tagged Tumblr posts
Visit Tumblr Blog
Explore Tumblr blogs with no restrictions, modern design and the best experience.
Last Seen Tumblr Blogs


Fun Fact
Mobile Tumblr US users spend an average of 4.04 minutes per session on the app.
Text
ppl complaining about the new legally blonde prequel coming out didn't seem to get the movie cause elle WAS interesting and smart from the get go????
"i have a 4.0...." "but in fashion merchandising"
girlie's got a business related degree from the beginning, even if it's a "frivolous" thing
i think u rlly missed the main idea?
#personal#omg no i want the FIT MPS in global fashion manageneny#management*** im rlly grumpy cuz like 3 yrs ago it was an MBA but now its an MPS ;^;#which i wanna try to shmooze my way into having my company pay for#(or hop to someone else who WILL pay cuz at work i built basically the same automation system VS has lmao#like my coworker who used to be at VS was like 'u made this....huh this is what VS contracted out')#BUUUUUUUUUUUUT like i was one of the top students in my class for my art school and ran a student org#and when i told ppl i wanted to do either animation or apparel with my graphic design degree ppl were sooo nasty#i mean like PROFESSORS and advisors /#:/#so i feel for the character lmao?????? cuz i know for a fact i earn more than my archi and a couple of my ui/ux friends who#like...arent at faangs so.........and im happier than them :)#like ive been on a product development design team as one of two artists for 2.5 years now#and like i have to be in the FASHION MERCHANDISING meetings#and....theyre business meetings about sourcing and costing and meeting minimums to make profits#its not cutesy clothing its....spreadsheets#and my art automation system is also based off of a spreadsheet :)
2 notes
·
View notes
Photo


NEW SET AND NEW TEMPLATE WOOOOO!
First, check the New set (Aux D) post if you havent.
Then, check the artfix page so you can see each type in the new card frame.
This template is crazy, people. Let me lay this down.
It’s huge. 2.5″ x 3.5″ but at 600 DPI for the art, 1200DPI for the UI elements. These images above? click them to see how huge they are. No more tiny garbage.
This is MADE for print! Not just big but my source files have bleed available up to 2.71″x3.71″ and all colors are tested thoroughly in CMYK before export. All the text is further inside an invisible margin called the safe area, meaning the text won’t be cut off by a horrifically bad cut at an offset printer.
IT IS FULLY AUTOMATED LUXURY CARD CREATION. I have a spreadsheet that is more or less drop-down menus and auto-population to assemble all the card pieces. Then I data merge that to InDesign.
The art is now great stuff. Our artfixes we’ve been posting to the tumblr? Yeah now that can actually be seen fully as the template is full art with no UI elements totally hiding the art.
Completely scalable based on the content. What this means is the longer a support effect, the more lines and EVERY element that would get in the way pushes itself upward to compensate. The evo-box at the top scales itself down with each line. No more cramming paragraphs of text into 2-3 lines!
Abnormal power is now displayed under the relevant stat! No more checking some awkward text-block in the corner that gets cut off if you print and squishes the effect text.
Supports and attack abilities now have Speed like in the original Playstation game. These were ommitted on launch partly because I didn’t know, and because when I learned about it, I already had a pretty good system of alternating support resolutions and keeping attack abilities in the Battle Phase. Now things are different and the game is a bit more dynamic. The increase of timing collisions gives players more choices of what to resolve first!
The card name font (except Masteries) is the actual font from the old Bandai 1990s english cards. Not the first release with the light-blue backs, the one with the dark blue cyber backs. The first release is just Serpentine. The Nulshock I was using on my old template was me trying to approximate this font which I finally found.
Icons now exist for every card category instead of only Digimon! Evolution, Data, Option, even Mastery cards have an upper-left icon so you can easily tell what this blasted thing is.
Important card elements moved to the left side. Now the game is much more compatible with these things we humans have called hands. You can print the cards, fan them left-to-right as most people do, and see your Level/Category, DP requirement, +P value, type color, stats, and whether you have a Support in your hand. Instead of like...half of those where the old template was right-aligned. Subtypes are also more intuitive since I just put the icon right next to the primary icon instead of a separate bar.
Evo-bonus, Firewall, ACE, Proxy all made to look like computer board modules that slot into pin holes with visible pinouts! This was just an extra touch we wanted to add so they would feel more like opening up your old v-pet and installing a crazy custom module.
TLDR; version:
Huge cards
Print colors and bleed
Automated card creation
Full art template layout
Template auto-moves/scales to content
Abnormals near their stats
Speed added to effects
Nostalgic name font
Icons for every card category
Left-aligned for in-hand fanning
Small thematic touches to elements
#Digimon card game#digimon game#digimon card#digimon#digital monsters#digica#digimon tcg#Card Design#Card game#card game design#digimon battle evolution
4 notes
·
View notes
Text
Student Guide: Budgeting
You now have a pretty clear picture of how much debt you owe. The next step is to tackle it and make a plan to pay it all off.
Savings
Write down all your savings + that 15% of your income. If you don’t have any savings, just put the 15%.

Budgeting is an art.
It’s the art of being in control. Of having an efficient money system. Of knowing where your money is and how it’s doing. Budgeting is your ground base, your concrete foundation to managing your money well. It’s the bread and butter of personal finance.
Too many times budgeting is regularly associated with deprivation and restrictions – but it’s not about that. Budgeting is about having a plan. It’s a plan that you need to keep reviewing and improving, modifying and analysing, constantly trying to make it better. It’s a reflection of yourself: it shows your money habits, your goals, your discipline. The more you work on your budget, the better you get, which in turn improves your spending habits and discipline. It’s a self-improvement tool
So what I’m trying to say: do a bloody budget. And being a college student, now is the best time to practice, make mistakes, and prepare for the future.
What we’ll be talking about today:
What is budgeting exactly?
Why budget?
How to get started
Moving online
What is le budget?
As I said before, a budget is a plan. A plan to see where your money is coming in, where it’s going out, where it should be going out and where you would like it to go out.
Think of a budget as a flow chart of improvement. At first you see you’re in a bad financial situation. Your budget plan says your income and expenses aren’t looking too good. You analyse and see what you need to improve on. Then you re adjust, you track how you’re doing and you set your goals. Your budget will never be perfect, but it will be a little better each time. And every time you do this, you get closer to your goals.
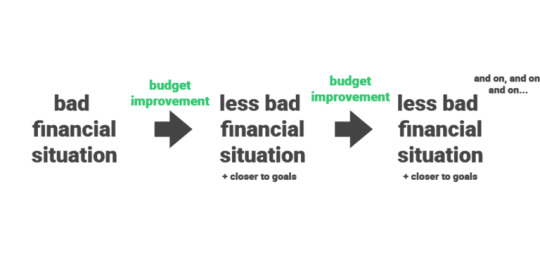
A budget is a constant readjustment of your finances in order to reach your goals. And who doesn’t want to reach their goals?
All you need is a pen, paper and calculator.
Why le budget?
You already know budgeting is essential, especially in college – but let’s put the advantages of budgeting into a nice little list:
Easy to track income and expenses (good for tax returns)
Helps figure out your short and long-term goals
Helps keep track of your progress
Ensures you don’t spend money you don’t have
Prepares you for emergencies
Recognises bad spending habits
Puts you in control
Prepares you for the future: larger expenses, important debt, etc.
Gets you started on your financial education
And guess what? Money is everywhere. No matter whether you want to become a scientist, a plumber or an astronaut, money will always be involved in your life. You may hate it, you may curse it and you may have a fit every time you see cash. But you’ll still have to use those damn pounds and pennies. So why not make sure you’re using them right?
A budget lets you put your money on autopilot: no more worrying if I’m saving enough, no more ‘did I spend too much?’, no more ‘will I get to the end of this month?’. Nope, because your budget will tell you where to put your money and how much you can spend. And trust me, this makes sleeping at night so much easier.
How to get started
I’ve been blabbing on about how amazing budgets are for quite some time now, so it’s time to get started with the nitty gritty. Apologies if you’ve already taken the 6 day email course – I will be using the exact same examples and structure.
So it’s very simple – get a nice big piece of A4 paper, a pen and a calculator (maybe even a ruler if you’re a perfectionist).
Start by drawing 5 columns:

Then fill these out with the following: Income, Budget, Expenses, Savings and Debt.

Then, very simple: slot in your income every month and then your expenses. Have no idea where your money goes each month? Do a rough estimate – check your bank account or try tracking for a week, see what happens. Below we have Jimmy’s expenses (he loves takeaway).
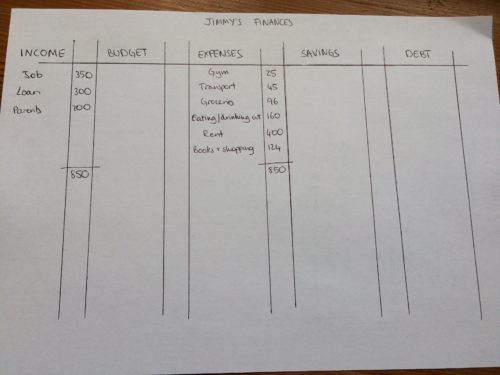
Everyone’s budget will look differently. Maybe you have irregular income, maybe you have a credit card and like overspending every month (not good!) or maybe you have some expenses that don’t happen exactly every month. For this reason I always like to start with a piece of paper – write down whatever you feel is necessary. Add extra columns, strange signs, whatever helps you understand what’s going on with the ££.
The Spending
Now we get to the magical part:
Calculate 15% of your total income and add it to the budget column as ‘Savings’.
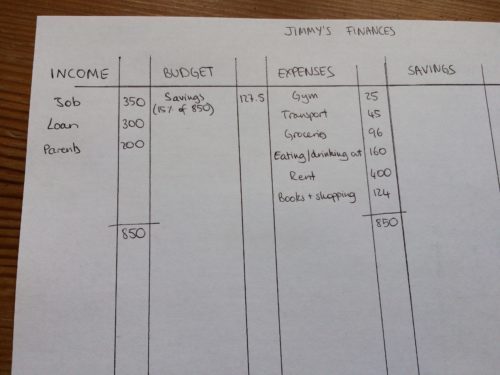
And now figure out where all the rest of the money goes. The magic is that you’ve already allocated a percentage to your savings – and so you don’t have to worry about making the rest lower than your income! Let’s see how Jimmy’s done it:

Improvements
You may think ‘wow, that’s a large cut on my ‘fun time’’ (Jimmy went from £160 to £100)
I agree, which is why you can improve that amount in two ways:
Lower expenses: Look for ways of decreasing your ‘mandatory expenses’: find ways to lower your rent, cut on transport and find some gym discounts. Cutting down the bills and essential expenses means more fun money – so do some research.
Increase income: Now it’s important to note that as a college student, your priority is studying and making the most of university. If you feel you have time and are eager to earn some more, by all means go ahead and get a job, earn some passive income or start a side-hustle. But don’t feel pressured to do so.
And feel free to increase that 15% savings rate. As a budgeting beginner in college, 15% is a good place to start, but the more you can do the better!
Debt
The next column to tackle is debt. As a college student, you hopefully won’t have too many debts: student loans and maybe credit card debt. Student loans are a tricky subject, because you have to decide whether you want to pay them off or not. Credit card debt has to disappear for sure, the sooner the better.
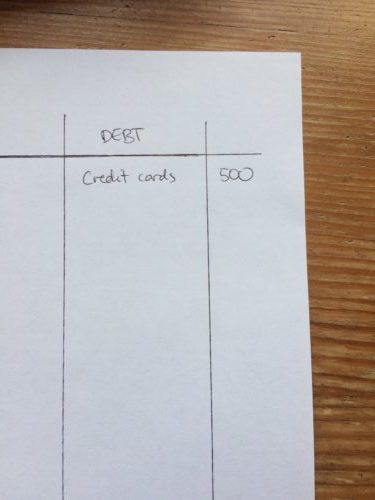
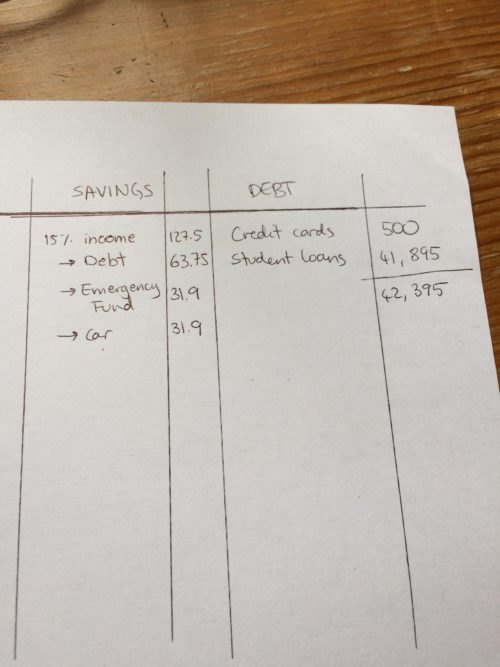
First, if you have credit card debt or any high interest debt, slot the numbers into the Debt column. Jimmy wasn’t really sure what a credit card was last year and went a little crazy:
Second, read ‘Should I pay off my student loans?’. Then decide on whether you want to pay them off or not. If you don’t, no need to add anything else to the column. If you do, simply add on how much student loan debt you’ll have at graduation. Here are some websites to help you calculate the number: Complete University Guide calculator and Money Saving Expert calculator.
Here’s Jimmy’s Debt column:

You now have a pretty clear picture of how much debt you owe. The next step is to tackle it and make a plan to pay it all off.
Savings
Write down all your savings + that 15% of your income. If you don’t have any savings, just put the 15%.

As you can see, Jimmy has £127.5 every month just for himself (from the 15% of his income). He has goals, he has debt and he also has responsibilities. He decides to allocate this amount to three things every month: Debt, emergencies and personal goals. He know he really has to pay off this high interest credit card debt.
Half of the 15% goes to clearing off debt
A quarter goes to building an emergency fund
A quarter to buying his dream car.
His columns looks like this:
His 15% is truly working for him: getting him out of debt, preparing for emergencies and helping him get to his goals.
And yes, at £30 a month it will take him a while to get that car. But once you get started remember that you can always increase that 15%, change around the numbers and find other ways to work towards your goal. Keep trying until you find what works best for you.
Why an Emergency Fund? I’m going to cover this in a future article, but it’s pretty obvious: emergencies happen, and you want to be prepared. As college students it’s recommended to have around 1- 2 months saved up into a separate bank account especially for emergencies. Jimmy knows this, and so wants to start building his Emergency Fund bit by bit. Every month those £31.88 are allocated to a separate bank account.
I recommend setting those 15% apart the minute you get your loan/paycheck/allowance. At the end of the month, or whenever you get paid, take apart your 15% and make each part do its work for you. Save up for that car/trip/laptop, build up your emergency fund and starting paying off your debt.
You’ll suddenly start to feel like everything is in order, everything fits. You know where your money is going and you know that it’s going in the right places. Everything is calm. You are becoming an efficient and responsible adult. Congratulations.
Moving it online
You’ve done the planning and the forecasting, now it’s time to automate the process so that every month you can quickly and easily set your budget, keep track of expenses and keep working towards your goals.
Now really, everyone does this differently. There are tons of resources out there to help you budget, track, invest, build an EF, tickle your nose, etc. So it’s up to you to test and decide for yourself. To give you a bit of an idea, here are how some people do it:
Araminta (yes that’s me):
I keep track of day to day expenses with an app like Coinkeeper (check out Top Money Apps Every College Student Needs). The app also has my budget so I make sure I don’t overspend. Then, at the end of each month I add everything onto an Excel spreadsheet and calculate where my 15% should go. I also have a separate spreadsheet with all my bank accounts and investments, which I update regularly.
Daniel from Reddit
I work out how much money I have to spend for the entire term and divide that by the number of days (as I’m living on campus it includes weekends) and it will give me how much I can spend per day. I will document how much I spend per day. At the end of every week I will see how much I am over/under and document that. At the end of term I’ll have a full summary. I work week by week. If one week I overspend then the next week I’ll be more cautious.
Megan from Inside Megan’s Mind
My number one way to budget is using an app on my phone. The app I use is called Dollarbird and I like it because it’s laid out as a calendar and I’m able to add income/expenses by day. I can also see a monthly overview and this allows me to look at how much I spent during the month and what I spend it on. Using a budgeting app like this keeps me from overspending; plus, I always know where I spent that random $20 that I’m missing.
Frankie from Tumblr
I seperate my income into halves, making sure there’s at least 10 percent put into savings where the savings is halfed by investment and retirement. The 90 percent is then fitted and divided into food, house bills (electricity, water, internet), transportation (commute, having a car isn’t an investment), entertainment (movie tickets for me), medication, and miscellaneous (emergency money and clothing)
Also, when it comes to food, meal plans are your friend. It’s difficult, but to make things a bit easier, I suggest collecting recipes, seperating them into categories like chicken, beef, and pork. Vegetables must be either incorporated or side dishes, and must make up 60 percent of the dish (aside from being cheaper than meat, vegetables are an investment for your body). Once, that’s done, rotate the three meat for a month and estimate the costs of all ingredients – – better if you’re using an online grocery delivery because you can see the actual prices of the store while coming up with your dishes and it’s time saving, perfect for single parents and overworked peeps. Also, List. Lists are importants.
Look Me in the Stars from Tumblr
I auto deposit into a “bills/house” checking account my monthly expenses + another for savings; the rest is gravy for add savings and day to day expenses. rent is always set aside first, then savings, recurring bills, minimum payments on cc debt and then I can assess what room I have to add to paying down debt. leaving extra for weekly pocket money/gas/groceries.
So there you have it! Now it’s your turn to plan out your life. Trust me, it gets exciting.
Read more like this over at Financially Mint’
25 notes
·
View notes
Text
Clarifying the Data Stream | Water & Wastes Digest
When the Brazos Regional Public Utility Agency in Texas wanted to improve and expand its systems for supervisory control and data acquisition (SCADA) and human-machine interface (HMI), it could have stuck with its familiar vendor. But switching to a different software package is paying off for the agency, which is based in Granbury, Texas, about 70 miles west of Dallas.
In 2016, the agency wanted to upgrade its SCADA system, but the cost of adding more tags would have been prohibitive. So the agency chose to replace the old system with Ignition by Inductive Automation. Ignition is an industrial application platform with tools for building solutions in SCADA, HMI, and the Industrial Internet of Things (IIoT). Agency managers said the new software, the agency gets better control of its systems, improved reporting capabilities, greater data integrity, simplified training and lower costs.
“It’s probably the best move we’ve made so far,” said Alain Richard, operations manager for the agency. “It’s going to give us more flexibility, as far as our operations are concerned. It’s going to make it a lot easier for monitoring, and for our training.”
Ignition uses an unlimited licensing model, enabling industrial organizations to expand their systems with no additional costs for adding tags, devices, clients or projects. With the new software, the agency went from 30,000 tags to 55,000, and has the ability to add many more without additional cost.
“The main thing was the unlimited number of tags,” Richard said. “As we move forward, we’re looking at automating a lot of our systems, so we need a lot of room for more tags. The price from [the previous provider] was way out there; it was a lot of money.”
The change to Ignition is part of a larger effort by the agency to automate more processes and leverage technology to improve efficiency.
Expansion Mode
The Brazos Regional Public Utility Agency was created in 2012 to achieve economies of scale in providing water systems to the public through ownership and operation of a water treatment plant and related facilities. It is a joint venture between Acton Municipal Utility District and Johnson County Special Utility District. The two districts serve 22,000 customers and provide wholesale water to other municipalities.
The agency has one water treatment facility with a production capacity of 13.5 million gal per day. The plant consists of a traditional filtered water operation and an ultrafiltration (UF) and reverse osmosis (RO) operation. It was built in the late 1980s, and receives raw water through one intake located on Lake Granbury, which is fed by the Brazos River.
In choosing and implementing the new software, the agency was assisted by H2O Innovation, a system integrator with headquarters in Quebec City. H2O Innovation designs and provides state-of-the-art, custom-built water treatment solutions based on membrane filtration technology.
H2O was awarded the project in August 2016, with a planned timeline of 12 to 16 months. But the project was expanded along the way to include the agency’s RO and UF systems.
“The agency liked what they saw in our preliminary screens,” said Paul Bartlett, manager of automation and controls engineering for H2O Innovation. “They saw value in what we were doing, and they knew there weren’t any limitations or costs beyond the initial cost of the software.”
That made it easy to expand the scope of the project. The agency began using parts of the system in the summer of 2017, and all facets were installed by the end of May 2018.
With unlimited tags, the Brazos Regional Public Utility Agency in Texas increased from 30,000 tags to 55,000 to better track its systems.
Faster Reporting
The agency had clear objectives for the upgrade. “I wanted to centralize everything,” Richard said. “I wanted the operators to only have to deal with one system. And when H2O told us we could have that and also have all our reports, including our state agency reports, done in that system, that was a big deal to us.”
The new system also gave a greater level of control. “I wanted to have access to all the controls,” Richard said. “For everything at the plant, I wanted us to be able to log into the system and be able to control it. That’s something we didn’t have before. The other system was mostly a view screen, and you couldn’t control everything. None of my ultrafiltration could be controlled. But now with Ignition, I can control everything.”
A much smoother, faster process for reporting has been a key benefit with the new software. This includes critical reports that the Agency must submit to the Texas Commission on Environmental Quality (TCEQ).
“The reporting in the new system will probably save us close to eight man-hours per week,” Richard said. “With the old way, the operator would enter the data on a paper spreadsheet. Then we’d have to go in and enter the information on a computer. Then a program from another computer would grab the data off of it and create the report. Now, we just click on the report page and the data is entered right there. No more paper. We’re eliminating all the paper and the double-checks and the triple-checks on the information.”
The new process is much easier for the operators. “They don’t have to look for a form on any computer and wonder which drive it’s on, and which folder,” Richard said. “All the reports are right there in front of them, and they don’t have to chase anything.”
The automated process for reporting to the state, which H2O developed, could have impacts beyond the agency. “This is something we’re pretty excited about,” Bartlett said. “Now that we’ve developed the code, other Texas utilities can benefit from this method of reporting to TCEQ.”
The agency also uses the system to generate several other reports for its own use. Some are for billing purposes, some are for the board of directors, and there are also daily and monthly reports for other uses.
Better Visuals from Anywhere
The time savings will allow operators to focus on big-picture projects for the future. For example, the plant will be expanded, and there will be more membrane sites. Currently, the agency has operators on the conventional side and on the membrane side. Richard said the plan is to combine things so operators can work on both sides. With reporting going faster, conventional operators now have more time to learn the membrane technology.
Data integrity is another area of improvement with the new system. The previous system would show different values for the same thing, depending on how an operator was looking at it. There were several different versions of the software running within the facility, which led to discrepancies in the data. These issues had to be manually analyzed and fixed. With the new system, everything is on one platform, and it is all on the same version of software because it is web-enabled. There is now one source of data.
Also, remote capabilities have been improved. Operators now have tablets and can monitor the plant from anywhere. They can log in from home and even fix problems from there. And in the near future, alerts will show up on operators’ cell phones. The new software has provided a major step forward for the agency’s remote capabilities.
The SCADA and HMI screens are more integrated now, too. The screens in the old system “didn’t flow very well,” Richard said. The screens had been developed in a piecemeal fashion over the years, and they lacked a cohesive, consistent look. That meant extra time had to be spent training new employees, because the screens were confusing. Richard said that has all been remedied with the new software.
The Brazos Public Utility Agency customized its screens to best meet the needs of those using the SCADA system every day.
Collaborative Process
The agency knew what it wanted, and got it from H2O and Ignition. “The agency had a lot of say in the graphical design, and how they wanted it to look and feel,” Bartlett said. “We had a lot of sessions with them where we would get into the details. They provided a lot of feedback, and we were flexible in the design of the screens.”
Richard said the new software also will allow him to give different levels of access to different operators, making it easier to set up the proper security. With this, the phone alerts and a bit more automation, the agency no longer will need to have the facility manned 24 hours per day.
Overall, the new system provides numerous advantages over the previous one. And it will continue to be an improvement for years to come.
“The big benefit is that the data really is limitless,” Bartlett said. “In the future, if they want to grab more values and monitor them, they have that flexibility for expansion.”
Description of Filtration Products Website: Filtration-Products.com website amasses the just released announcements, communications and purification innovations from the purification trade. Filtration-Products.com keeps you in the know on purification and all the related professional events including string wound depth filtration, pleated filter cartridges, melt blown elements, bag filters, Pre-RO filters, Pre-Reverse Osmosis filters, from brands such as Lakos needed for particulate separation, and anything else the purification business has to mention.
from Filtration Products https://ift.tt/2JWDkff
0 notes
Text
More Than 30 Years After Its Debut, Many Controllers Still Head Over Heels for Excel
When Microsoft Corp. released its spreadsheet program, Excel for Windows (Excel 2.0), in late 1987, Lotus 1-2-3 was all the rage. “Among numbers-crunching accountants, corporate planners and business school students, the program has developed the kind of loyal following usually reserved for Madonna and the Boston Red Sox,” the New York Times wrote on Oct. 2, 1987.
In that article, Jeff Raikes, then director of marketing applications programs at Microsoft, said about Excel, “We don’t expect [it] to make a huge impact right away. But we are heading into a technology transition, and over the long term we have a major opportunity.”
Controllers, get your team better prepared to tackle your month-end close by downloading these best practice Excel reconciliation templates from FloQast.
But it didn’t take Microsoft long to knock Lotus off the top of the spreadsheet mountain. Within a year after Excel 2.0 debuted, its sales began outstripping Lotus 1-2-3, according to Excel guru David Ringstrom, CPA. IBM eventually pulled the plug on Lotus 1-2-3 in 2013; meanwhile, Excel continues to have a rabid fan base, with more than 750 million users worldwide, according to some estimates. There’s even an international Microsoft Excel championship (although the competition is limited to ages 13 to 22).
It’s no secret that accounting and finance professionals are among the most loyal to the iconic spreadsheet program, mostly because it’s fast, powerful, straightforward, and easy to use. According to the 2017 Benchmarking the Accounting & Finance Function report from the Financial Executives Research Foundation and Robert Half, 69% of U.S. companies still use Excel as their primary budgeting and planning tool.
“It’s a fantastic tool for tracking, analyzing, troubleshooting, modeling, and summarizing data,” said Jason Page, corporate controller of Provo, Utah-based Chatbooks, a subscription-based service that automatically turns digital photos into photo books. “I can quickly see and understand the summarized data, trace through formulas, understand what’s happening without much explanation, and ultimately see/touch/feel the underlying data. And it’s beyond easy to sort, filter, pivot, and chart information.”
Accountants’ loyalty even stretches outside the walls of their cubicles and offices.
“I wrote a children’s book and brought it to a publisher for review, and I was the only person who ever brought them a draft of a book in Excel, not a Word document,” said Eva Wells, CPA, corporate controller at Turck Inc., a Minneapolis-based company that specializes in connectivity and sensor products.
Why Excel is still relevant
But as more cloud-based financial software programs (and even database software solutions) hit the market, I asked Wells, Page, and a handful of other controllers what makes a manual-intensive tool like Excel still popular and relevant among accounting and finance teams in this age of automation.
“It’s the same reason why CAD [computer-aided design] software is popular for engineers who need to design and build things. We need to design and build things with numbers, and Excel is a very user-friendly tool to use for that purpose,” said Wells, an Excel user for nearly 25 years. “Even though you can theoretically create a report for most anything from your enterprise resource planning (ERP) system using business intelligence, it might not be able to be done fast enough, and it might not be flexible enough, to allow you to analyze thoroughly. You can build anything in Excel fast.”
Another reason is Excel provides a standard language that most people can understand, said Fred Butterweck, CPA, corporate controller of New York-based Clickspring Design, a multidisciplinary design firm. Because Excel is relatively intuitive, a person doesn’t need several years of training to become proficient with it, he added.
“Because of its linear format, Excel forces you to organize data in a logical and straightforward manner,” said Butterweck, who’s been using Excel professionally since 2000. “An important feature of Excel is that it allows the user to retrace his or her steps by looking at the formulas. Most importantly, it allows users to retrace someone else’s steps if they didn’t create the spreadsheet.”
And Butterweck added that Excel is relatively cheap and doesn’t have implementation or setup costs like some business intelligence platforms. Microsoft Office 365 Business and Business Premium plans cost between $8.25 and $12.50 a month, and customers on either plan get access to applications like Excel, Word, and PowerPoint, among others.
“The Cheesecake Factory of financial tools”
The versatile range of Excel’s capabilities—“from simply logging data and preparing reports, to running complex scenario analyses, to troubleshooting and normalizing data”—is one of the things Page loves about the tool.
“If I can imagine it, I can probably do it in Excel. I’ve even used Excel as a CAD program to map out my home sprinkler system,” said Page, who’s used Excel professionally since 2003. “While it may not be best-in-class in any specific isolated area, it performs a large array of functions. It’s the Cheesecake Factory of financial tools.”
Here are some other things controllers told me they love about Excel:
Pivot tables: “Excel has made the pivot table functionality incredibly simple,” Butterweck said. “When distributing reports and analyses, having the underlying data available by one click really helps the users of the reports understand what’s behind the numbers they’re analyzing.”
Goal Seek function: “This is a ‘what if’ function in the Data menu that allows you to quickly find out what input you need to arrive at a certain result,” Wells said. “The possibilities are endless in accounting for situations where this is useful. For example, if you input two amounts in two different cells for revenue and expense, and then make a formula to calculate income, you could then run Goal Seek to determine what your expense target needs to be in order to achieve the income you want given a fixed revenue number.”
Formula Auditing tool: Formula Auditing can be found by clicking on the Formulas ribbon tab. “You can trace dependents or precedents to see which other cells are connected to the cell you’re looking at,” Wells said. “It’s very useful when you’re making sure a spreadsheet was set up properly from a reviewer point of view. You can review faster.”
Integrates well with other programs: “A good example is how Excel data can greatly increase the efficiency of data input into accounting systems, such as QuickBooks, SAP, or Workday, just to name a few,” Butterweck said. “Rather than spending hours booking journal entries, creating vendor records, and entering invoices, you can just create an Excel sheet and import everything with a few clicks.”
FloQast designed and built a cloud-based close management software platform that closes the gaps between Excel spreadsheets and ERP systems, said co-founder Michael Whitmire.
“With FloQast, your reconciliation workpapers are still in Excel format stored in cloud document storage that you own (Box, Dropbox, Google Drive, OneDrive, Egnyte, etc.). FloQast sits in the middle, tying together your spreadsheets, checklists, and ERP trial balance,” he wrote in a blog.
With this approach, accountants get the familiarity of working within a tool like Excel but integrated with the actual results that are coming from the business’ operations.
Creative spreadsheet design: “I like being creative in design in the non-creative world of accounting,” said David Rosso, controller, Massachusetts/Midwest Accounting Division of City Electric Supply, an electrical wholesale distributor, who’s been using Excel for 24 years and considers himself a power user. “Designing a spreadsheet for non-financial people to see and to understand is a creative outlet.”
Defending against the Excel backlash
But there’ve been recent defections from Excel Nation, as the Wall Street Journal reported last November. Some CFOs are ditching Excel for their financial planning, analysis, and reporting, opting instead for cloud-based financial software programs that have capitalized on Excel’s weaknesses, touting better data management, analytics, and transparency; collaboration across departments within a single document; and process automation that reduces administrative tasks and errors.
Kolleen Gibson, controller at Boston-based Invaluable, an online marketplace of fine and decorative arts, antiques, and collectibles, said it’s unfair to compare Excel with the specialized technologies mentioned in the Wall Street Journal article.
“Excel is an all-purpose tool, and spreadsheets are built by the users,” said Gibson, who’s been an Excel user since 1990. “Of course, a customized, professionally built and tested tool would be better than something built in Excel. But the article does mention that all these tools have an ‘export to Excel’ feature, so they don’t really make Excel obsolete.”
While cloud-based technologies are “great” and allow users to analyze and crunch data faster, what they don’t have is direct access to granular data, said Marc Baumann, CPA, controller at Sweetwater, a Fort Wayne, Ind.-based music technology and instrument retailer.
“I enjoy having the base data in front of me and being able to alter as I see fit,” said Baumann, who has used Excel professionally for nine years. “I also think ad hoc report generation is more efficient in Excel than these cloud-based databases.”
CFOs said in the Wall Street Journal article that Excel hasn’t kept up with the demands of today’s accounting and finance teams, but that hasn’t been the case at Zipwhip, a Seattle-based business texting provider, according to Controller Ryan Letson.
“From my perspective, Excel has kept up with the demands of my team and I,” said Letson, who’s used Excel professionally for 12 years. “There aren’t many projects or tasks that I take on or assign to my team that cannot be done in Excel.”
Excel skills no longer a priority?
A recent survey by Adaptive Insights, a provider of cloud-based financial software, revealed that CFOs no longer rate Excel proficiency as the most important skill for finance professionals.
According to the survey, only 7% of finance chiefs list Excel skills as important for new hires, and just 5% considered proficiency in Excel as the top skill for their financial planning and analysis teams, down significantly from 78% two years ago.
But Rosso said he tells his team members that there will always be a job for them in accounting or finance because of their knowledge of Excel.
“I tell my employees all the time that no matter what, and wherever you go from here, your Excel education can’t be taken away from you,” he said. “It’s not always easy to find an employee who has experience in Peachtree [Sage 50 Accounting], QuickBooks, SAP, or name any other accounting software as there are hundreds. But there’s only one Excel.”
In a future article, we’ll look at some of the cloud-based financial software platforms that are competing with Excel for accounting and finance teams’ financial planning, analysis, and reporting needs.
Discover how your team can make the most of Excel for your month-end close in this white paper from FloQast. You can read more about Going Concern’s partnership with FloQast here.
Image: iStock/Gearstd
The post More Than 30 Years After Its Debut, Many Controllers Still Head Over Heels for Excel appeared first on Going Concern.
from Accounting News http://goingconcern.com/controllers-love-excel-inchan-sponcon/
0 notes
Text
Artificial Intelligence: Out of the futurists’ lab!
Artificial Intelligence: Out of the futurists’ lab!
Kathryn Hume, President, Fast Forward Labs, talked about the future of artificial intelligence, the ways in which it’s impacting enterprise operations like security.
Let’s talk about the future of artificial intelligence, the ways in which it’s impacting enterprise operations like security say we’ve seen IBM Jeopardy – IBM put out the Watson – the Watson tool that beat Jeopardy in 2013. Shift to 2016.
We’ve seen Google DeepMind build AlphaGo which is a tool using a technique called reinforcement learning, a set of artificial intelligence algorithms that put in position a system of rewards to train systems to excel at a particular task – beat Lee Sedol who is the leading Go champion at this game.
Executives say, interesting that DeepMind can do this but what does this mean for my Churn analysis? What does this mean for my ability to optimise marketing programs? What does this mean for my ability to protect my networks? The answer is, it’s a really hard question to solve. It’s not trivial. It’s very hard to go from that particular original fable use case of the gold to find the actual yield in the crops that will come from these applications. So the question that I’d like to pose is, where is this land? How do we find it?
Since we’re in Silicon Valley one of my mentors is a man names Geoffrey Moore who in the 1990s wrote a book called Crossing the Chasm – bible of marketing theory and how technologies move across their adoption life cycle. Right now in the AI space we’re in that very early part of the distribution curve.
We’re working with the early adopters. We’re building out vertically specifically applications that are the early instances of what this might become but don’t yet foretell large wide scale adoptions in the pragmatic larger marketplace that’s actually going to have the larger impact of these technologies across the industry.
So early apps aren’t always the killer apps. DeepMind winning Go isn’t necessarily the application of reinforcement learning that’s going to really transform inventory and supply management. But it’s possible for us not to predict exactly what those killer apps are but to hone our skills to recognise and pivot our strategy when they occur.
So for the rest of the talk I’d like to just give two examples of where we’re already seeing this occur in the artificial intelligence space, to give some insight into where we think the space might evolve in the future. Fast Forward Labs, at my company we study technologies that are on the threshold of shifting from the academic sphere into wide commercial adoption and applicability.
We educate our customers as to how they can apply them in their own business processes and business environments by building out prototypes with reports that explain what these tools are and what one can practically do with them and then advising them on where they can be applied in their individual environments. Our first work was on a technique called natural language generation.
I’m sure everybody has heard of natural language processing which is starting with lots of unstructured text that humans write. It’s messy. It’s not amenable to the numbers and digits that computers work with. So these techniques are focused on putting structure into unstructured text. Natural language generation is the opposite.
We start with structured text – not text, excuse me – structured fields like an Excel spreadsheet that has rows and columns with data entries inside of it, and then automatically write articles that use qualitative language to communicate those quantitative insights. When this application – when this set of technologies was first released to the market we thought that the killer app was going to be in automated journalism.
I’m sure you’ve seen in Forbes and the Associated Press articles that are written by computers that describe sports performance, weather reports, company earnings reports, lots of descriptive, non-interpretive, relatively repetitive type reporting. That was the focus of this technology when it first came to the market.
Since that time Automated Insights and Narrative Science who are two of the key players in this space have realised that the real value of this tool is not in journalism per se but rather in narrative applications of business intelligence. Taking the mess of numbers that exist in data warehouses there was a first generation of tools like Click and Tableau that would provide nice visual interfaces to provide charts and graphs to executives.
They said that’s not clean enough. We want it even simpler. We want it in human language where we can very quickly have insights into how our business is performing. We started off with gold – automated journalism – and shifted into something relatively more prosaic, right, narrative business intelligence but that has really had a yield for business. The second technique we’ve seen evolve is in the space of deep learning.
It’s very hot right now. Most of the time when we talk about artificial intelligence we are referring to these artificial neural networks that are powering a lot of new applications and capabilities. We did a report focused on using these techniques to automatically discern the objects that are in images. So the application you see there, hook up to your Instagram feed and it will classify and reorder your pictures according to the objects that are in them.
Just as a funny side note these systems – we’re going to talk a little bit later about supervised versus unsupervised learning. So they’re supervised. They have to start with a training data set in order to get a vision – what their vision of the world might look like so that they can perform. My colleague, Hilary Mason, likes to take pictures of the New York City subway system on her way to work.
The training data set that we used for this tool had no images of subways in it. So it used to classify all of these gates as correctional institutions, as prisons, which both tells us about the limitations of the tools and also give some insight into why New Yorkers have their temperament when they go to work in the morning.
We start off with fun applications to classify images. Who cares? Where is the crop? A couple of cool things I’ve seen on the market come out since we worked on this project, one is applying – this is coming out of the artistic world – there’s a technique called style transfers where artists start with famous paintings like the Starry Night from Van Gogh, abstract out the style and then enable people to go through their Facebook page and turn their selfies into works of art imitating the grand masters. This is actually using the same set of techniques that enable us to see objects and images also enable us to abstract out the style and graft it onto other images. So this is an app called [Picasso] from a start-up out of St Louis.
With a little bit more gravitas and enterprise importance a set of start-ups, one based in Silicon Valley called Orbital Insight that’s taking satellite data available from a whole host of new small satellite providers and enabling us to use these convolutional neural net deep learning techniques to gain insights into macroeconomic activity where the data was not formerly available.
The image on the right is a picture of shadows from buildings in Shanghai that hedge funds are using as a proxy to try to get an estimate of macro-economic activity going on in areas where there is not traditional market and pricing data. The third application, my personal favourite, comes from a San Francisco start-up called Enlitic that’s using deep learning image technology to automate radiology to examine chest x-rays.
Stunningly they are getting the speed of their system able to complete the work that a typical radiologist would complete in one month, in 104 seconds. So it really could have massive impact on work flows, the way in which hospitals are managing their work force in the future. Final example – and its transition into the presentation from Cylance – comes from the world of text. We did a report using deep learning techniques, a slightly different style than those used to process images, to automatically summarise text.
The application here we start with an input data set, say a relatively long article in the New Yorker or the Atlantic magazines here in the US. We build a model of the meaning of the article and then use that to select out the sentences we think best represent the meaning of the article as a whole. So to shift around the goal here is not to absolutely revolutionise journalism but to shift around the reading experience so that users can start with the skimmed main points of the article and then read the entire article at will if it suits their purposes.
What’s interesting here is we shift – once again gold to yield and crop – is that we were focusing our models on aspects of text that are relevant to summarise, relevant to the human reader. Stuart and his team at Cylance are adding in additional features from text to discern whether or not incoming data is malicious or not.
So same sort of technique, just shifted to a slightly different use case. The moral of the story I think going back to The Tortoise and the Hare one of my favourite Aesop fables I’m sure everybody knows of, is that we’re at the beginning. We really are at the beginning of this.
We are not really sure where things are going to pan out and how they’re going to pan out. But there is massive opportunity if we stop paying attention to the hype and really focus on the discrete applications and use cases that are going to be available on the early market. (Courtesy: NetEvents)
Source:: http://indiatelecomnews.com/artificial-intelligence-out-of-the-futurists-lab/?utm_source=rss&utm_medium=rss&utm_campaign=artificial-intelligence-out-of-the-futurists-lab
var VUUKLE_EMOTE_SIZE = "90px"; VUUKLE_EMOTE_IFRAME = "180px" var EMOTE_TEXT = ["HAPPY","INDIFFERENT","AMUSED","EXCITED","ANGRY"]
%URL
0 notes