#brainmasstraders
Explore tagged Tumblr posts
Visit Tumblr Blog
Explore Tumblr blogs with no restrictions, modern design and the best experience.
Last Seen Tumblr Blogs


Fun Fact
If you dial 1-866-584-6757, you can leave an audio post for your followers.
Text
18% returns in a month! This household appliance maker gave a breakout above falling trendline
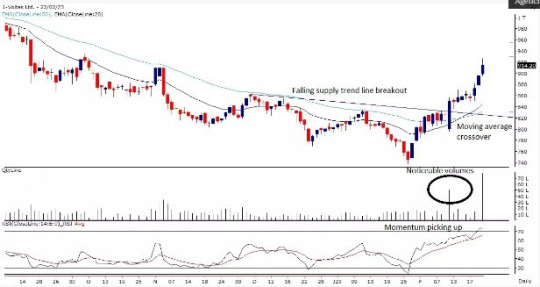
Voltas, part of the consumer durable industry, has risen by about 18% in 1 month which helped the stock to break out from a falling trendline resistance that has opened room for the stock to head towards Rs 1,000. The stock price of Voltas, which makes household appliances, has rallied from Rs 776 recorded on January 23 to Rs 914 as on 22 February 2023 which translates into an upside of about 18%. However, from its 52-week high, the stock is still down more than 30% which effectively places the stock in a downtrend. But, the recent momentum seen in the stock suggests that bulls are trying to take control. The stock gave a breakout above the falling trendline which connects the highs of December as well as January 2023 on the daily charts. The up move has come with strong volumes. On the weekly charts, the stock has been forming higher highs and higher lows with strong volumes which suggests strength in the up move. In terms of price action, the stock is trading well above short and long-term moving averages placed at 5,10,20,30,50,100, and 200-DMA which is a positive sign for the bulls.
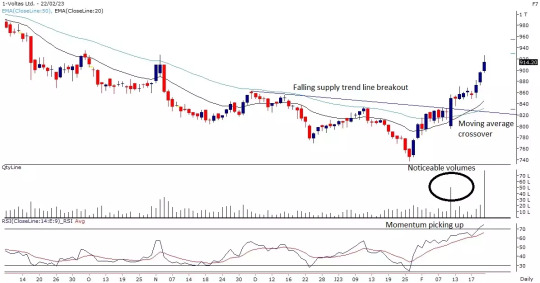
“Stock price of Voltas has taken support at its previous resistance zone on a monthly scale and formed a reversal candle with follow-up buying seen in the counter. It is also forming higher highs – higher lows on a weekly scale from the past four weeks with noticeable volumes,” Arpit Beriwal, Analyst, Equity Derivatives & Technicals, MOFSL, said. “It has given a falling supply trend line breakout on daily scale and started to form higher highs – higher lows as supports are gradually shifting higher,” he said.“The stock has also seen a moving average crossover on a daily scale which has bullish implications and stock is likely to outperform the broader market,” added Beriwal. Relative Strength Index (RSI) is also moving northwards which suggests momentum is likely to continue in coming sessions and thus looking at the overall chart structure on the weekly scale. We expect the stock to move higher towards Rs 1,000 level. We recommend buying the stock at current levels with a stop loss below Rs 875 level on a closing basis for an upside move towards Rs 1,000 zone,” recommends Beriwal.
#voltas#tradewithraj#technicalanalysis#elliottwave#ichimoku#brainmasscloud#brainmasswave#brainmasstraders#brainmassfinance#brainmassacademy#brainmassclub#brainmasscommunity#brainmassfinancialservices#rsi#macd#dma#stocks#nifty#banknifty#nse#sensex#india
0 notes
Text
The Dow Jones Industrial Average fell 0.30% or 91 points, the Nasdaq was down 0.61%, and the the S&P 500 fell 0.85%.
The Dow closed lower Thursday, as rising Treasury yields weighed on investor sentiment even as the bulk of quarterly results continued to suggest corporate America is in better shape than feared.
The Dow Jones Industrial Average fell 0.30% or 91 points, the Nasdaq was down 0.61%, and the the S&P 500 fell 0.85%.
The 10-year Treasury yield jumped to fresh 14-year highs as investors weighed up fresh remarks from Federal Reserve officials calling for the central bank to remain the course on rate hikes.
Citing a "disappointing lack of progress on curtailing inflation," Philadelphia Federal Reserve President Patrick Harker said he expects interest rates will be “well above 4% by the end of the year.”
The remarks come as fewer-than-expected weekly jobless claims pointed to strength in the labor market, heightening concerns about ongoing wage growth.
“Demand for labor remains quite strong […] it remains the case that workers who are let go are still having a relatively easy time finding a new job,” Jefferies said in a note.
Tech stocks managed to cut losses but remained under pressure as rising Treasury yields make growth corners of the market including tech less attractive.
International Business Machines (NYSE:IBM), however, bucked the trend to rise more than 4% after the tech giant reported quarterly results that beat estimates on both the top and bottom lines.
Tesla (NASDAQ:TSLA), meanwhile, fell more than 7% after a mixed third-quarter results, though some on Wall Street touted optimism ahead for the EV maker after management said they are considering initiating a stock buyback.
“We are encouraged that management is considering a $5- $10B buyback and believe it is a constructive use of cash,” Oppenheimer said after lifting its price target on the stock to $436 from $432. “[We] believe depth of demand is outstripping most investor expectations, even when considering a looming recession,” it added.
The broader market was also pressured by a fall in travel stocks as investors weighed up quarterly results from airlines and railroad companies.
American Airlines (NASDAQ:AAL) reported quarterly earnings that beat estimates as travel demand continued to recover, but its shares fell more than 3%.
Railroad stocks were hurt by Union Pacific 's (NYSE:UNP) weaker outlook on carload growth and stock repurchases, which offset the quarterly results beat on the top line.
Elsewhere, AT&T Inc (NYSE:T) rallied more than 7% after the telecom reported better-than-expected earnings and revenue and lifted its outlook on full-year earnings to $2.50 from $2.46 a share previously.
The stumble in the broader market has coincided with wild swings in either direction, a pattern that isn't likely to let up anytime soon.
"Most of these volatile moves have inflation uncertainty, and what the Fed is going to do about it, at their core," Wells Fargo said. "We feel this pattern of market behavior is unlikely to change in the near term and is not uncommon during periods of economic uncertainty," it added.
#brainmassfinance#Brainmass#brainmassgroup#brainmasscommunity#brainmasstraders#tradewithraj#nasdaq#s&p 500 index#dowjones#new york stock exchange#treasury#ibm#at&t#brainmassclub
1 note
·
View note
Text
Breakout from descending triangle pattern could take this garment stock towards April 2022 highs
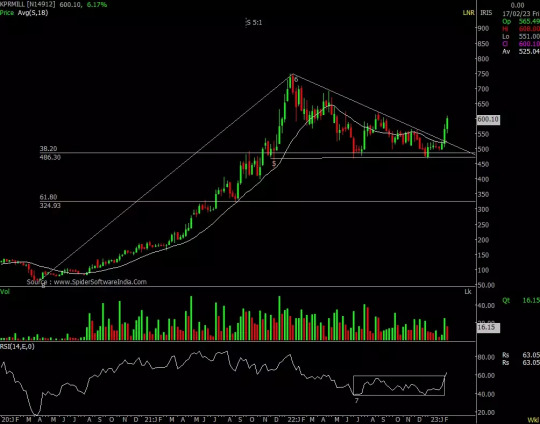
KPR Mill, part of the garment and apparel maker, picked up momentum in the last one month which helped the stock to break out from a descending triangle pattern on the weekly charts. The breakout has opened room for the stock to retest its 52-week highs in the next 2-3 months, suggests experts.
KPR Mill stock hit a 52-week high of Rs 704 on 18 April 2022 but it failed to hold on to the momentum. The stock reversed losses after hitting a low of Rs 479 on 26 December 2022. The stock rose more than 16% in the last one month which helped the stock to breakout from a descending triangle pattern which is a bearish pattern. A breakout suggests that bulls have taken control.
Descending triangle is a continuation of a bearish pattern where the next move will be in the primary trend. The stock has a strong base near the 38.20% Fibonacci retracement level of the previous upward movement from 63 (March 2020) to 769 (January 2022).
In terms of price action, the stock is trading well above short and long-term moving averages such as 5,10,30,50,100, and 200-DMA on daily charts which is a positive sign for the bulls.
“KPR Mill stock has exhibited a bullish trend since March 2020, and despite a recent correction, it has not dropped below the 38.20% Fibonacci retracement level of the previous upward movement from 63 (March 2020) to 769 (January 2022),” Omkar Patil, Technical Research Associate at GEPL Capital, said. “This indicates that the prices have a favorable sentiment, and suggests a potential for further upward movement,” he said. “The stock KPR Mill has demonstrated a significant technical development on its weekly timeframe, as it has successfully broken out of a descending triangle pattern, Indicating continuation of the prior uptrend,” highlighted Patil. On the daily timeframe, the stock KPR Mill has been persistently trading near the upper Bollinger Band, indicating an increase in volatility for a potential upward movement. The RSI on the weekly timeframe has given a breakout too which shows strong bullish momentum. “Based on these technical indicators, it is expected that the stock's prices will continue to rise towards the level of Rs 700, with a recommended stop loss at Rs 550 on a closing basis,” recommends Patil.
#kprmills#tradewithraj#technicalanalysis#dma#fibonacciretracement#brainmasstraders#stocks#nse#nifty#banknifty#sensex#sloploss#bolingerband
0 notes
Text
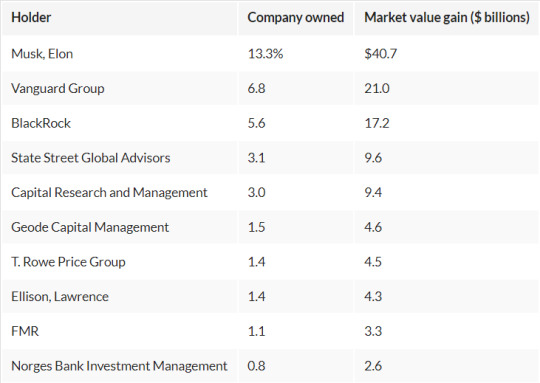
10 Investors Score $117 Billion On Tesla Stock's Double 'Bubble'
What's it like to make more than $110 billion in five weeks on just one S&P 500 stock? Ask the largest owners of Tesla (TSLA) stock.
The top 10 largest holders of Tesla stock, including top ETF and mutual fund providers like Vanguard and BlackRock (BLK) plus the Technoking Elon Musk himself, are collectively up $117 billion since the stock doubled from its 52-week (intraday) low on Jan. 6, says an Investor's Business Daily analysis of data from S&P Global Market Intelligence and MarketSmith.
That means just 10 investors made more on one stock — Tesla — in roughly five weeks than all investors made on 496 individual S&P 500 stocks during the same time. That's crazy money.
The run on Tesla stock is prompting some to toss out the "bubble" word. "Tesla's recent price cuts are a display of pricing power, cost superiority and could increase demand — but it could also negatively impact Tesla's future profitability," said Oktay Kavrak, product strategist at Leverage Shares.
Tesla's Run-Up Is One For S&P 500 History Books
It's not often to see so much value get created by a single stock so fast. But that's the story of the S&P's bounce this year following last year's beatdown.
Shares of Tesla are up more than 105% from their 52-week intraday low on Jan. 6. And they're up more than 85% from their closing price that day. That means all Tesla investors are up $305 billion from that low day's closing price. That's more of a market value gain than all but two other individual stocks in the S&P 500.
Yes, Apple is up more than $361.9 billion since then. And Microsoft is too, up $348.8 billion. But on a percentage basis, they're only up 18% and 21% respectively, or nowhere near Tesla's percentage gain.
And that's why some bubble talk is starting to perk up (although shares are still 46% below their 52-week closing high). Tesla closed Tuesday at 209.25. At that price, Tesla stock is already nearly 9% past the 192.63 a share analysts think it should be worth in 12 months.
Big Wins On Tesla
No investors are making as much money in this year's Tesla rally as Musk himself. Musk still owns 13% of the electric-car maker, more than anyone else, a lucrative move in 2023.
Musk has gained $40.7 billion in paper wealth on just his stock this year alone. No one comes even close. But Vanguard, the top holder of two-thirds of S&P 500 stocks, is bringing its ETF and index mutual fund investors along for the ride, too. The fund company's 6.9% stake in Tesla has gained nearly $21 billion in wealth on its position.
And rounding out the top three winners in No. 3 spot is BlackRock. The fund company's 5.6% stake in Tesla added more than $17 billion in market value just this year.
But while bears think Tesla is running too far, too fast, some mega-bulls exist. The most optimistic forecast for where Tesla stock will be in 12 months is 320 a share. If that's right, Tesla still has more than 53% upside from Tuesday's close.
That's not as impressive as the stock's run in the past five weeks, but none of these top Tesla stock investors will likely complain.
Big Tesla Investors Make A Fortune This Year
Brainmass Finance Team
#brainmassfinance#brainmasscommunity#brainmasstraders#brainmasswealth#brainmasscapital#brainmassfinancialservices#tradewithraj#brainmasscommodity#brainmassclub#crudewithraj#nse#bse#sensex#nifty#banknifty#tesla#elonmusk#billionaire#investors#traders#brainmassglobal#brainmasstimes
0 notes
Text
TMO with TTM Squeeze
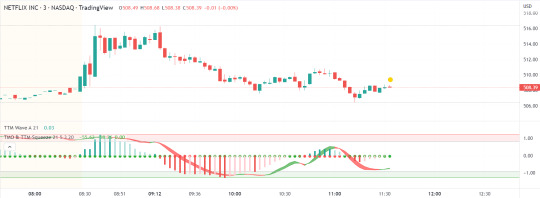
Application of the TTM squeeze and the short-term momentum TTM Wave A in action. This is an example where the short-term wave will react faster than the TTM to give you a signal to start building your positions. This indicator needs to be combined with "TTM Wave A" (add to existing pane). The TTM Squeeze works like a better MACD . There is a zeroline and histogram bars above / below represent positive and negative momo. As the height of the bar decreases when above the zeroline, that is called decreasingly positive momo and as the height of the bar decreases when below the zeroline, that is called decreasingly negative momo. The dots on the TTM Squeeze: Red dots represent consolidation where Bollingers are inside the Keltner Channels and green dots represent a move out of consolidation or "squeeze fire". As price action comes out of consolidation there is a bigger move up/down depending on where momo is heading and where prices are (key support/resistance levels, fib areas). You want to use the TTM Squeeze and A wave TOGETHER - TTM Squeeze is your main momo and your A wave is a short-term momo wave that reacts faster and works as a leading gauge. You need to use them TOGETHER to gauge where price action may be heading. When the TTM Squeeze and A wave move lockstep together, let's say both are decreasingly positive, there is a good probability it continues to move in that direction to the next support levels. TWO bars on the TTM Squeeze of different heights is confirmation that in most cases means it will move in the direction of those bars. So if decreasingly positive, you'll see two darker bars. By the time you get your 2nd bar on the TTM Squeeze, it is often too late or you're losing profit. Way to counter that is after you get one darker bar in the opposite direction of current trend, use A wave to "predict" the next wave, the more A wave histogram bars going towards the other direction, the higher the certainty it will hit. Lastly, using these waves together works best when you look at it on MULTIPLE TIME FRAMES. (Credit for this details goes to Brady from Atlas ).
#momentum#ttm#ttmsqeeze#macd#tradewithraj#brainmasstraders#brainmassfinance#brainmass#brainmasscommunity#brainmassclub
0 notes
Text
How To Read Structure (Charts) Tutorial. Charts 1-5

By the time you are done with this tutorial, You will understand Structure, Trends, Reversals & much more! This tutorial will teach you how to dig deep into the charts & analyze where price is likely to go next!
Reading Structure can be difficult when you first start trading, however most professional traders (if not all) understand structure very well and it is definitely a skill that will dramatically help you on your journey to becoming a professional trader. I tried to make this as clear & simple as possible for anyone to understand but do not worry if this is complicated or a little confusing at first. If you are new to trading, you will benefit by studying and looking over these charts multiple times. I have found that it is also helpful if you grab a piece of paper and a pencil so you can draw the chart that you are looking at. Draw a very simple line chart and mark the highs & lows as shown in the tutorial with support & resistance lines.. You will learn much faster by doing this while training your eyes to identify trends & reversals. After you do this enough, it will start to become 2nd nature & you will spot these crucial moments in structure with a quick glance at the charts. This is the first section of the Reading Structure Tutorial. This section will consist of 6 Charts total: Chart 1- An Easy and effective way to determine trend. Chart 2- Following The Trend with Support & Resistance (Highs & Lows) Chart 3- Continuation of Chart 2 Chart 4- Identifying Possible Trend Reversals Chart 5 - When Structure Doesn't Make Sense, Do Not Trade! Chart 6- Another Reversal I have put a lot of time & effort into this tutorial so feel free to ask any questions you may have.. I will be publishing section 2 of the "How To Read Structure" tutorial next week. Please leave a comment below or message me with your thoughts regarding this lesson. I am happy to continue publishing them if they are helpful to you. We are going to scroll through this chart & follow structure. This is a 60 Minute Chart of GBP-USD .
Chart 1

Chart 2, In this Chart we are going to look at the highs & lows shown on Chart 1.

Chart 2 Continued, (Continuation of Chart 2.)

Chart 3, Identifying Possible Trend Reversals.

Chart 4, In depth Analysis of Chart 3.

Chart 5, Another Example of a trend reversal

Section 2 of "How To Read Structure" will be published next week & I will be sure to update this tutorial with the new charts as well as publish a separate idea. Take your time & really study these charts. There is a ton of valuable information in this tutorial & by the time you get through all the sections, you will have a much easier time reading structure. Please be sure to give this tutorial a thumbs up if it was helpful & you would like me to continue posting them. Thanks Traders & I hope you enjoyed the 1st section of this tutorial! Jul 12, 2017Comment:Hey Traders, Here is Section 2 of the "How to read structure (Charts) Tutorial". In this Section, you will learn some of the methods that professional trend traders use to bring home a profit week after week, month after month, & year after year! In this Section, I will be explaining- - The Characteristics of a healthy trend (Chart 6) - A simple method that makes identifying trend reversals easy (Chart 7) - Why you should not rush your trades plus when & why you should have a neutral biased as a trend trader (Chart 8) - Mastering Reversals & how to trade them properly (Chart 9) - Continuation of GBPUSD -0.29%Structure Analysis ~ How To Identify & Avoid Trading Ranges To Improve Your Trend Trading Strategies ~ The Importance Of A Candles Closing Price. (Chart 10) - One of my trend trading rules to avoid trading ranges & Intro to the 1st part of Section 3. (Chart 11) Section 1 of this tutorial is linked below. Please start with section 1 as it will lay some of the ground work for this section & will also show these methods on actual charts. This section of the tutorial is a breakdown of the methods taught in section 1 and when studied together, can really give you a good understanding of how trends, reversals, ranges etc work. Please feel free to leave feedback below regarding if these tutorials have been helpful. I will be releasing many more of these tutorials in future ideas and your feedback really helps me to improve them! It may take you a couple minutes to get use to the format of these tutorials so take your time & read over the charts multiple times as there is a lot of good information provided within these tutorials. Chart 6- Characteristics of a healthy trend

Chart 7- A simple method that makes identifying trend reversals easy

Chart 8- Why you should not rush your trades plus when & why you should have a neutral biased as a trend trader

Chart 9- Mastering Reversals & how to trade them properly

Chart 10- Continuation of GBPUSD -0.28%Structure Analysis ~ How To Identify & Avoid Trading Ranges To Improve Your Trend Trading Strategies ~ The Importance Of A Candles Closing Price.

Chart 11- One of my trend trading rules to avoid trading ranges & Intro to the 1st part of Section 3.

You Have Completed Section 2 Of The "How To Read Structure (Charts) Tutorial. Charts 6-11"! Thank you for taking the time to finish this section of the tutorial! I hope Section 1 and 2 have been helpful to you! In section 3, we will start looking at how you can use price action/structure & the methods taught in this tutorial to design your own trading strategy! After all of the sections are complete, you will have the tools needed to read structure, create your own rules based trading strategy and much more so please stick around as this is only the beginning of a very educational tutorial. Thanks Traders!
New Simple Patterns Tutorial Available Now! Strategy Insight!

How To Read Structure (Charts) Tutorial- Section: 3 Charts 12-18 Release!

#structure#tutorial#reversals#trend#trendcontinuation#trendtrading#tradewithraj#brainmassfinance#brainmassclub#brainmasstraders#support#resistance#chart#tradingview
1 note
·
View note
Text
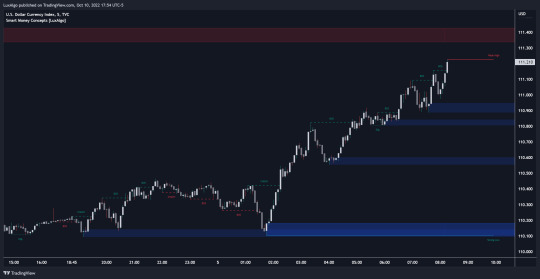
Smart Money Concepts [LUX]
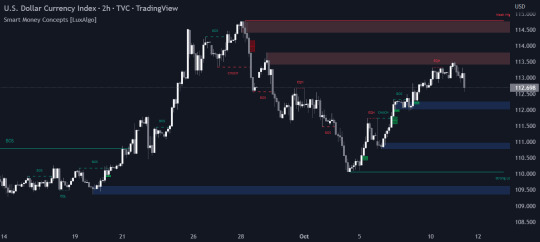
This all-in-one indicator displays real-time market structure (internal & swing BOS / CHoCH), order blocks, premium & discount zones, equal highs & lows, and much more...allowing traders to automatically mark up their charts with widely used price action methodologies. Following the release of our Fair Value Gap script, we received numerous requests from our community to release more features in the same category. "Smart Money Concepts" ( SMC ) is a fairly new yet widely used term amongst price action traders looking to more accurately navigate liquidity & find more optimal points of interest in the market. Trying to determine where institutional market participants have orders placed (buy or sell side liquidity) can be a very reasonable approach to finding more practical entries & exits based on price action. The indicator includes alerts for the presence of swing structures and many other relevant conditions.
Features
This indicator includes many features relevant to SMC, these are highlighted below:
Full internal & swing market structure labeling in real-time
Break of Structure (BOS)
Change of Character (CHoCH)
Order Blocks ( bullish & bearish )
Equal Highs & Lows
Fair Value Gap Detection
Previous Highs & Lows
Premium & Discount Zones as a range
Options to style the indicator to more easily display these concepts
Settings
Mode: Allows the user to select Historical (default) or Present, which displays only recent data on the chart.
Style: Allows the user to select different styling for the entire indicator between Colored (default) and Monochrome.
Color Candles: Plots candles based on the internal & swing structures from within the indicator on the chart.
Internal Structure: Displays the internal structure labels & dashed lines to represent them. (BOS & CHoCH).
Confluence Filter: Filter non-significant internal structure breakouts.
Swing Structure: Displays the swing structure labels & solid lines on the chart (larger BOS & CHoCH labels).
Swing Points: Displays swing points labels on chart such as HH, HL, LH, LL.
Internal Order Blocks: Enables Internal Order Blocks & allows the user to select how many most recent Internal Order Blocks appear on the chart.
Swing Order Blocks: Enables Swing Order Blocks & allows the user to select how many most recent Swing Order Blocks appear on the chart.
Equal Highs & Lows: Displays EQH / EQL labels on chart for detecting equal highs & lows.
Bars Confirmation: Allows the user to select how many bars are needed to confirm an EQH / EQL symbol on chart.
Fair Value Gaps: Displays boxes to highlight imbalance areas on the chart.
Auto Threshold: Filter out non-significant fair value gaps.
Timeframe: Allows the user to select the timeframe for the Fair Value Gap detection.
Extend FVG: Allows the user to choose how many bars to extend the Fair Value Gap boxes on the chart.
Highs & Lows MTF: Allows the user to display previous highs & lows from daily, weekly, & monthly timeframes as significant levels.
Premium/ Discount Zones: Allows the user to display Premium, Discount , and Equilibrium zones on the chart
Usage

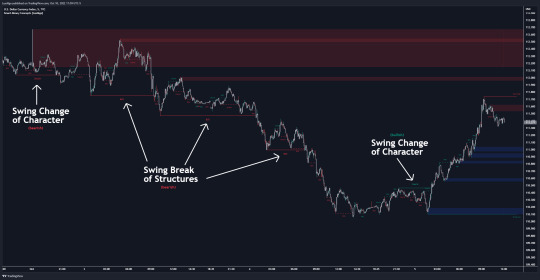
Users can see automatic CHoCH and BOS labels to highlight breakouts of market structure, which allows to determine the market trend. In the chart below we can see the internal structure which displays more frequent labels within larger structures. We can also see equal highs & lows ( EQH / EQL ) labels plotted alongside the internal structure to frequently give indications of potential reversals.
In the chart below we can see the swing market structure labels. These are also labeled as BOS and CHoCH but with a solid line & larger text to show larger market structure breakouts & trend reversals. Users can be mindful of these larger structure labels while trading internal structures as displayed in the previous chart.
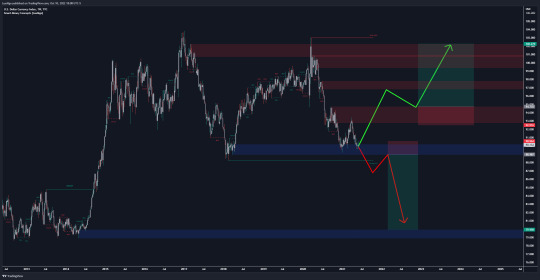
Order blocks highlight areas where institutional market participants open positions, one can use order blocks to determine confirmation entries or potential targets as we can expect there is a large amount of liquidity at these order blocks. In the chart below we can see 2 potential trade setups with confirmation entries. The path outlined in red would be a potential short entry targeting the blue order block below, and the path outlined in green would be a potential long entry, targeting the red order blocks above.
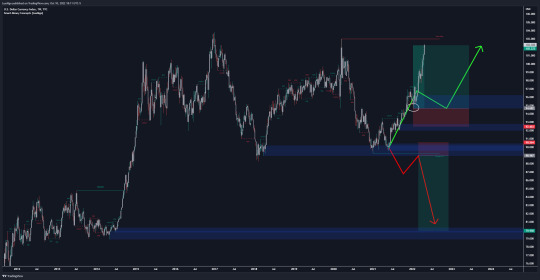
As we can see in the chart below, the bullish confirmation entry played out in this scenario with the green path outlined in hindsight. As price breaks though the order blocks above, the indicator will consider them mitigated causing them to disappear, and as per the logic of these order blocks they will always display 5 (by default) on the chart so we can now see more actionable levels.
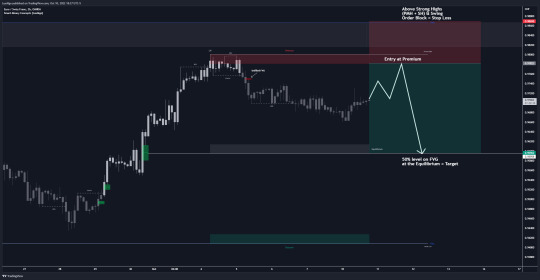
The Smart Money Concepts indicator has many other features and here we can see how they can also help a user find potential levels for price action trading. In the screenshot below we can see a trade setup using the Previous Monthly High, Strong High, and a Swing Order Block as a stop loss. Accompanied by the Premium from the Discount /Premium zones feature being used as a potential entry. A potential take profit level for this trade setup that a user could easily identify would be the 50% mark labeled with the Fair Value Gap & the Equilibrium all displayed automatically by the indicator.
Conclusion This indicator highlights all relevant components of Smart Money Concepts which can be a very useful interpretation of market structure, liquidity, & more simply put, price action. The term was coined & popularized primarily within the forex community & by ICT while making its way to become a part of many traders' analysis. These concepts, with or without this indicator do not guarantee a trader to be trading within the presence of institutional or "bank-level" liquidity, there is no supporting data regarding the validity of these teachings.
#trendanalysis#support and resistance#smartmoney#smartmoneyconcepts#priceaction#price action#marketstructure#orderblock#luxalgo#lux#tradewithraj#brainmasstraders#brainmassfinance
1 note
·
View note
Text
Crypto Total Market Cap Intraday: Elliott Wave Analysis

#crypto#crypto trading#cryptowithraj#elliotwave#waveanalysis#brainmassfinance#brainmasstraders#tradewithraj#brainmasscommunity#chartbyraj
0 notes
Text
Is Nifty heading towards 17600?
"Nifty50 has clearly surpassed our expectations after extending the relief move beyond 17,350. We may see Nifty50 heading towards 17,500-17600. But we reiterate, the market is not completely out of the woods yet. Hence, it’s advisable to stay light after nearing this zone," said Sameet Chavan of Angel One. NEW DELHI: Nifty50 on Thursday climbed for the second straight day, breaching the recent swing high of 17,324 and also the resistance of 17,350. The index reclaimed the 17,400 mark on a closing basis and formed a bullish candle on the daily chart. Analysts believe the ongoing recovery can extend to the level of 17,600. Support for the index is seen at 17,250 level.

https://stocktwits.com/brainmassfinance
"Nifty50 has clearly surpassed our expectations after extending the relief move beyond 17,350. We may see Nifty50 heading towards 17,500-17600. But we reiterate the market is not completely out of the woods yet. Hence, it’s advisable to stay light after nearing this zone," said Sameet Chavan of Angel One.
https://www.tradingview.com/u/BrainmassFinance/
The 50-pack index might have embarked on a sustainable pull back rally as it has decisively closed above its 100-day exponential moving average, whose value is placed around 17,145 level, said Mazhar Mohammad of Chartviewindia.in.
https://www.instagram.com/brainmassfinance/ "A sustenance of 17,149 level may lead to a higher target of 17,570-660. Critical moving averages like 50- and 20-day are present in this range. Unless the supplies coming out of this critical resistance point are completely absorbed, the trend may not turn in favour of the bulls. Meanwhile, if the current recovery is owing to the weekly expiry related factors, weakness shall reemerge which may initially lead to the test of recent corrective swing low of 16,782," Mohammad said. https://t.me/tradewithraaj
For the day, the index closed at 17,401.65, up 234.75 points or 1.37 per cent. Gaurav Ratnaparkhi of Sharekhan said the index has also broken out from an Inside Bar pattern on the daily chart and is now headed towards its key daily moving averages, which are near 17,620-17,650.
"If the index manages to surpass these crucial short term moving averages, it will unlock significant upside potential for itself. On the other hand, the near term support zone now shifts higher to 17,200-17,250," he said.
facebook.com/brainmassfinance Independent Analyst Manish Shah said if the last four days of trading is taken into account, the index has formed a Bullish Tower Bottom pattern, which is a bullish configuration.
twitter.com/tradewithraj "Nifty50 has closed above the minor resistance at 17,350 and this paves way for a rally to 17,650-17,700. On the daily time frame, we are not out of the woods and there could be selling on a rally to the resistance at 17,650. We still need to see more confirmation of a bottom in Nifty50 and how markets pan out in the next couple of days remains to be seen. For the time being, a pop up towards 17,650-17,700 is what we should be looking out for," Shah said.
#trade#invest#tradewithraj#brainmasstraders#brainmassfinance#nifty50#nifty#banknifty#bse#nse#index#support#resistance#technicalanalysis
0 notes
Text
Is Nifty heading for more correction?
Nifty50 on Tuesday slipped below the psychological level and formed a bearish inverted hammer-like candle on the daily chart Analysts said the index may find some resistance for the index at 17,200 levels.
Chandan Taparia of Motilal Oswal Securities said that Bearish Inverted Hammer indicates that follow up activity is missing and every bunce is being sold into.
“As long as index holds below 17,200 any bounce could be sol dinto. A weakness may be seen towards 16,800 and 16,500 levels. Medium term hurdles can be seen at 17,350 and 17,500 levels,” Taparia said.
During the session, the intraday bounce fizzled out near the upper end of the dynamic falling channel and the 40-hour exponential moving average. The index had given closing below 21 & 9 DMA which points out bear are active. Moreover, daily momentum indicators - MACD & Stochastic were trading with negative cross overs which suggests bearish movement in the upcoming session.
“Going ahead, the low point of the recent Doji formation i.e. 16,782 will be the key support to watch out for. Till that holds, the Nifty50 can go for a base formation in the range of 16,800-17,200,” said Gaurav Ratnaparkhi, Head of Technical Research at Sharekhan.
For the day, the index closed at 16,983.20 down 70.75 points or 0.41 percent.
“Unless the Nifty50 manage a sustainable close above 17,000 level, the index can breach the recent corrective swing low of 16,782 levels. In that scenario, the initial logical target of 16,325 can be expected. Eventually the test of the 200-day moving average - placed at around 16,100 - can’t be ruled out. Upside rallies, if any, shall remain capped around 17,300 levels,” said Mazhar Mohammad, Chief Strategist at Chartview.in.
Independent Analyst Manish Shah said the underlying trend is down but the oscillators are oversold.
Sometime in the near future, there will be a rebound from the lows. A move above 17,350 could signal there could be at least a couple of days of rally to the top end of the falling channel at 17,650, he said.
#nifty#banknifty#bse#nse#sensex#tradewithraj#brainmassfinance#brainmasstraders#movingaverage#DMA#channel#oscillators#bearish#invertedhammer#macd#stochastic#nifty50#technical#research#chartview
0 notes
Text
Julian Robertson’s tips to attain extraordinary success in the stock market
Legendary investor Julian Robertson says if investors want to make money in the stock market, they have to keep their losses to a minimum.
Robertson, called by some as “Father of Hedge Funds”, launched his firm Tiger Management in 1980 with $8 million and turned it into over $22 billion in the late 1990s. The 89-year-old billionaire was in the US navy working as stockbroker for Kidder, Peabody & Co., when he and his family moved to New York.
Robertson had the best hedge fund record among his peers throughout the 1980s and 1990s. It is said that he generated a compound rate of return of 32% for his investors, Robertson was considered to be the “Wizard of Wall Street”. His hedge fund, Tiger Management, became the world’s largest fund over the years.
Besides his investment record, Robertson also mentored a group of young hedge fund managers who were later known as the “Tiger Cubs”. A number of these hedge fund managers became extremely successful in their own right, including John Griffin of Blue Ridge Capital, Andreas Halvorsen of Viking Global, and Steve Mandel of Lone Pine Capital.
Robertson used a long and short investment strategy where he “shorted” assets he believed were going to perform badly over a specific period, “For my shorts, I look for a bad management team, and a wildly overvalued company in an industry that is declining or misunderstood,” he said.
For longer term investments, he trusted his research and took an extended view on whether his choice of investment was right. ”Our mandate is to find the 200 best companies in the world and invest in them, and find the 200 worst companies in the world and go short on them. If 200 best don’t do better than the 200 worst you should probably be in another business.
Robertson built his fund on a strategy of investing on global macro principles where he decided on the investments that would be made by the fund based on the overall direction of the economy of a country. This type of investing initially worked well for him. When he found an opportunity he believed in, he would invest heavily in it to maximize the benefit.
Let’s look at some tips that Robertson has shared in various interviews over the years on what helped his attain extraordinary success.
1. Be Patient and disciplined.
Robertson says research and critical analysis are very important for the success of an investment portfolio. Being patient, disciplined and yet aggressive is a rare combination of qualities that a number of investing greats have had. “Smart idea, grounded on exhaustive research, followed by a big bet. Hear a story, analyze and buy aggressively if it feels right,” he once said in an interview to a finance website.
2. Invest where competition is weak
Investors should look to invest where the competition is weak as it may be very profitable for them, he says. Competing in markets that are less well researched gives investors who do their research an advantage. “Hedge funds are antithesis of baseball. In baseball, you can hit 40 home runs on a single-A-league team and never get paid a thing. But in a hedge fund, you get paid on your batting average. So you go to the worst league you can find where there’s the least competition. You can bat 400 playing for the Durham Bulls, but you will not make any real money. If you play in the big leagues, even if your batting average isn’t terribly high, you still make a lot of money,” he says.
One of the best ways to do well in the investment business is to look for areas that have been unexploited by research capability and work them out thoroughly, he says. “It is easier for a hedge fund to go to areas where there is less competition. For instance, we originally went into Korea well before most people had invested in Korea. We invested a lot in Japan a long time before it was really chic to get in there.”
3. Cut down your investment risk
Robertson says investors should use a strategy in which long and short positions are taken in various stocks so that investors can hedge exposure to the broader market, which makes gains more associated with solid stock picking. “I believe that the best way to manage money is to go long and short stocks,” he says.
4. Use shorting strategy on business with bad management
When an investor shorts a company with a bad management team, the former hedge fund manager says, it is a safer bet as a business with a good management team is far more likely to fix its problems. If a shorted business has a bad management team, it is expected that the real business problem underlying the short will continue says Robertson. The overvaluation must be wild rather than mild for investors to be in a short, he adds.
5. Don’t be afraid to take decisions
Robertson, who was known for being the “trigger puller” at Tiger Fund, says if investors want to achieve success, they need to be prepared to make a decision when the time is right. “Dithering on whether to buy, hold or sell can lead to losses that would not be made if you have the courage of your convictions to make a decision,” he adds.
(Disclaimer: This article is based on Julian Robertson’s various interviews)
#long#short#strategy#management#julianrobertson#tigerfund#hedgefund#tradewithraj#brainmassfinance#brainmasstraders#investment#risk#economy
0 notes
Text
Two trading ideas for next week by Kunal Bothra
For the coming week, many of the pharma names could get into a bounce-back mode.
Synopsis : We are in a downtrend but a better opportunity to try and short the market would be not when the markets are into an extremely oversold territory but to wait for a bounce like the one that happened in the middle of this week.
One could play the pharma sector for a short term rally, specifically Biocon, Glenmark Pharma and Natco Pharma as they are looking far more attractive than the usual large-cap pharma names, say independent market expert Kunal Bothra.
How does one read through what happened this week and what is the outlook?
It was a tough week for the markets. Nifty just shade below the 17,000 mark and Bank Nifty below the 36,000 mark brings in a lot of anxiety for market participants. But this is a natural correction that the markets were hinting at for the last couple of months. Finally, that correction has come into the indices.
Now, there are a lot of parameters to try and gauge this correction and how far it can go. For example, the Bank Nifty has neared its 200-day moving average. It is just 200-250 points away from testing its 200-day moving average and this could be the first test which the Bank Nifty can do over the last eight or nine months. The second way to look at is the 100-day moving average support for the Nifty. In the previous two corrections, the 17,100 mark which is close to the 100-day moving average level, was a key support for the index. We have managed to hold on to the 100-day moving average on the previous two occasions with a margin of 0.5% to 1% error. If we manage to just about skirt around 100-day moving average for the next couple of days, and the volatility drops down, that also could be an indicator that the markets would get back into some stable trajectory.
All in all, we are in a downtrend but a better opportunity to try and short the market would be not when the markets are into an extremely oversold territory but to wait for a bounce like the one that happened in the middle of this week.
How does Nifty Pharma look like on chart? Is interest coming back to this particular sector?
After five straight weeks of negative close, this was first week of respite for the pharma index. I call it a respite as even though many of the pharma stocks did pretty well for themselves on Friday, there are lot of breakouts that the sector must provide over the next two consecutive weeks before we call it reversal. That said, the texture of the pharma rally was very interesting. It was not the usual large-cap pharma names like Sun Pharma or Dr Reddy’s that were leaders but tier II pharma that did pretty well.
Aurobindo Pharma recovered some 8-10% from its intra-week low while Grenmark Pharma over 10% to 12%. This was also the case with other names like Divi’s lab, etc. There was a lot of recovery in play. So, whenever you see such kind of recovery, it is typically a short-covering rally which happens because of the oversold nature of indicators for many of the stocks. And once the short covering gets completed, we wait for long built-up formations to happen where traders are more confident about taking long positions.
So, if we see that change happening in the pharma index, which I believe may be over the next one week or max two weeks, we could see those patterns playing out. And then we could be talking of a more substantial rally in the pharma names. You have to take it step by step. As of now, we could probably play it for a short-term rally, specifically Biocon, Glenmark Pharma, Natco Pharma as they are looking far more attractive than the usual large-cap pharma names.
What are your picks for the week?
For the coming week, many of the pharma names could get into a bounce-back mode. So, one can pick Biocon at current levels. The stock looks attractive. With Syngene bouncing back and breaking above 200-day moving average, I believe Biocon should also probably try and follow up in a very similar kind of chart trajectory for itself. Keep a target at Rs 400 and stop loss at Rs 340.
The second call would be sell in Manapurram. It looks' quite weak in terms of chart structure. The stock has broken below its major swing support on the short-term timeframe chart. The targets which traders could be looking at should be closer to Rs 160 mark and stop loss for that could be kept at Rs 175.
#manapurram#biocon#syngene#glenmark#natcopharma#glenmarkpharma#divislan#drreddy#sunpharma#pharmastocks#pharmaindex#nifty#banknifty#movingaverage#support#resistance#brainmassfinance#brainmasstraders#tradewithraj#nse#bse#sensex#chartbyraj#granules#cipla#torrentpharma
0 notes
Quote
Don't invest in what you don't know. Learn first then invest. #richdad
Robert Kiyosaki
#inspiration#inspirationwithraj#trade#investing#learn#brainmasstraders#brainmassfinance#brainmass#tradewithraj#learnwithraj#chartbyraj#rkmotivation
1 note
·
View note
Text
Stocks that gave bull market returns even as Nifty corrected
Synopsis: On an average, a Nifty500 stock has fallen 8 per cent in the five-week period, suggesting that the underbelly of the market has seen more pain than what is being reflected by the benchmarks.

MUMBAI – The past five weeks have been full of doubts, false revivals and calibrating of expectations for investors in the Indian stock market. The benchmark Nifty50 and the more comprehensive Nifty500 have both corrected over 6 per cent since hitting their record highs on October 19. Investor exuberance has mellowed amid mixed September quarter earnings, US Federal Reserve’s tapering announcement and the bombing of the largest IPO in India’s history, Paytm.
Consistent withdrawal of money by foreign portfolio investors (FPIs) as well as domestic institutional investors has proven to be more than enough to douse the optimism among retail investors. On an average, a Nifty500 stock has fallen 8 per cent in the five-week period, suggesting that the underbelly of the market has seen more pain than what is being reflected by the benchmarks. “So it is a pause rather than a sellout by FIIs (foreign institutional investors) or FPIs, and and they will come back because the growth in India would be one of the highest in the world in terms of GDP growth, and earnings will continue to follow. And that is where the excitement will come again for the market,” Andrew Holland, CEO at Avendus Capital Public Markets Alternate Strategies, told ETNow in a recent interview.
That said, market veterans always suggest that investors should keep an eye on stocks that are not falling during the bad times than those that are. That is because in the case of such stocks, investor conviction is the strongest based on an upbeat earnings trajectory instead of merely a rosy narrative.
While only a fifth of the Nifty500 stocks managed to deliver positive returns when the entire market was going through a corrective phase, around 14 stocks were able to deliver returns that are more fitting of a bull market.
Among them were prominent names such as Apollo Hospitals, Thermax, Minda Corporation, KPIT Technologies and Trident. The average return in the five-month period among these 14 stocks was a handsome 30 per cent.
Stocks like Minda Corporation, Thermax and Apollo Hospitals have benefitted from stellar September quarter earnings and the upgrades to their valuations that followed from analysts. However, the majority of them belonged to sectors that are benefitting either from the reopening of the economy or the green shoots appearing in the industrial part of the economy.

“The cyclicals are the ones wherein the most of the earning recovery is happening because they have come off from almost a lost decade and there the valuations are still quite cheap. I would stay with the cyclical part of it,” Santosh Kumar Singh, head of research at Motilal Oswal AMC, told ETNow.
#ttml#tanla platforms#kpit#elgi equipments#tci express#asahiindiaglass#minda corporation#tridentltd#apollohospital#homefirstfinance#ponnawallafincorp#sheelfoam#tubeinvestment#thermax#brainmass#brainmassfinance#brainmasstraders#tradewithraj#Sensex#nifty#nse#banknifty#chartbyraj#tradingview#stocktwits#twitter#facebook#whatsapp#telegram
0 notes
Text
Spice jet, UPL among five stocks that may deliver strong return in short term
Money making ideas: The nervousness in the market is at its high. Understandably, traders have been on their toes given the volatility. But that has also created opportunities for them, with many stocks giving breakout on either side. Here are five such names that are primed for a rally and may deliver handsome gain in a short term:
#Astral | BUY | TGT 2650
The stock is trading near the lower band of an ascending channel. The analyst expects a reversal from the support of the lower band of the channel. It has also taken the support of 55-EMA line. Indicators like MACD and RSI are indicating that the momentum in the stock is likely to continue. Thus, the analyst recommends a buy above Rs. 2250 with a target of Rs. 2650 and s stop loss of 2050.
(Analyst: Vijay Dhanotiya, Lead Technical Research, CapitalVia Global Research)
#UPL | BUY | TGT 870
UPL has taken the support of the 200-day EMA line. Earlier, the stock had given the breakout from levels of Rs 700. Reversal can be seen from the support of EMA 200 line and level of 700 which is important support level. Momentum indicators like MACD and RSI are indicating positivity in the stock. The analyst recommends a buy on UPL above Rs 790 with a target of Rs 870. Investors are advised to maintain a stop loss of Rs 690.
(Analyst: Vijay Dhanotiya, Lead Technical Research, CapitalVia Global Research)
#JubilantFoodWorks | BUY | TGT 4550
Jubilant Food is trading in an ascending channel and has taken the support of the 100-day EMA line. The analyst expects a reversal in the stock from the lower band of the channel. Indicators like MACD and RSI are indicating momentum in the stock. The analyst recommends a buy above Rs. 3860 with a target of Rs 4550 with a stop loss of Rs 3580.
(Analyst: Vijay Dhanotiya, Lead Technical Research, CapitalVia Global Research)
#ElgiEquipments | BUY | TGT 255
The volume has started to rise during upside breakout and the weekly 14-period RSI has moved above 60 levels. This is a positive indication and one may expect further upside in the near term. Buying can be initiated in Elgi Equipments with addition on dips down to Rs 222; wait for the upside target Rs 255 in the next 3-4 weeks. Place stop loss of Rs 215.
(Analyst: Nagaraj Shetti, Technical Research Analyst, CapitalVia Global Research)
#Spicejet | BUY | TGT 94
The aviation stock has been in a sustainable up move over that last couple of weeks. The stock price is currently making an attempt to witness an upside breakout of the crucial overhead resistance around Rs 85 levels, as per the weekly chart. Further, upside from here could open a sustainable up move in the near term. Weekly RSI and weekly DMI/ADX patterns are showing a positive outlook for the stock price ahead. One may look to buy spicejet on dips down to Rs 83 and wait for the upside target for Rs 94 in the next 3-4 weeks. Place a stop loss of Rs 80.
(Analyst: Nagaraj Shetti, Technical Research Analyst, CapitalVia Global Research)
#spicejet#elgi equipments#astral travel#upl#jubilantfood#brainmassfinance#brainmasstraders#tradewithraj#nifty#sensex#banknifty#adx#dmi#macd#rsi#ema
0 notes
Text
Timeless trading lessons from reclusive market wizard Ed Seykota
While the names of market gurus like Benjamin Graham, Warren Buffett and Peter Lynch are known by nearly everyone in the investing community, there are several traders who generate exceptional returns but do not want to come in the limelight. One such name is Ed Seykota, who may be one of the only traders who also wrote and starred in musical performance of his trading strategy " The Whipsaw Song".

Although almost completely unknown to the investment world, Seykota’s achievements rank him as one of the best trend followers and traders of his time. Seykota believes a trader’s psychology is the most important part of operating any trading system.
As a trend follower and money manager, he amassed millions in the 1970s and 1980s for his investors. He is basically a mechanical trend following trader who built the majority of his systems around exponential moving averages, with some reliance on pattern recognition. Seykota has always kept a low profile and caught the public eye only after his interview in Jack Schwager’s 'Market Wizards' books. He began his trading career in the 1970s, when he was hired by a major brokerage firm. It was in that brokerage firm that Seykota developed one of the first commercialized trading systems for managing money in the futures market.
After a few disagreements regarding the way management was interfering with his system, Seykota decided to part ways with them. Investors over the years have learnt many invaluable lessons by following his trading philosophy. Let's look at some of the trading rules that he mentioned in an interview with Jack Schwager.
Cut your losses Seykota believes that the most important trading rule is to cut losses because protecting one's capital is the primary job of a trader. He feels making money should be the secondary goal in the priority list of traders and they should embrace trading losses. He believes to stay ahead in the trading business, traders need to learn to lose like winners which means accepting losses the moment the market refutes their trade idea.
"If you make the mistake of hoping for the market to turn around in your favor, you’ve already lost. The best way to embrace trading losses is to have a plan. Combine that with small bets and you’ll be lightyears ahead of other traders. If you can’t take a small loss, sooner or later you will take the mother of all losses," he said in an interview in Jack Schwager’s 'Market Wizards' book series.
Seykota also believes that losing a trading position is aggravating, whereas losing one's nerve is devastating for a trading portfolio.
"The best way to ensure you never lose your nerve is to cut losses early. It’s one of the simplest ways to maintain your discipline and avoid emotional decision-making," he said.
Ride your winners
Seykota is of the view that trading isn’t about having a win rate of 70% or 80% but it comes down to how much investors make when they’re right and how much they lose when they’re wrong.
He feels the only way to achieve asymmetrical returns is to ride one's winners. Seykota feels trends tend to persist in all parts of life, and they also exist in the stock market.
"Successful trend following is buying when you recognize a trend, and holding on until that trend has finally come to fruition and begins to change. Of course, once in a while, a trader is going to end up buying nearly the exact top in a market, but that's where risk management and stop losses come into play. The key to enjoying enormous returns in the stock market is riding out your winners, and being stubborn enough to hold onto positions to capture as much of the trend as possible," he said.
Seykota believes that investors make the mistake of holding on to their losers as it's uncomfortable to sell them. On the other hand, they sell their winners before they ever get big as they don't want those gains to erode.
Seykota is of the view that investors shouldn't get influenced by soothsayers and prognosticators as they provide fanatical calls that are often way out in the future and turn out to be eventually wrong.
"I usually ignore advice from other traders, especially the ones who believe they are on to a “sure thing”. The old timers, who talk about 'maybe there is a chance of so and so,' are often right and early," he said.
Keep bets small
Seykota feels that one of the best ways to keep emotions at bay while trading is to keep bets small by speculating with less than 10% of one's liquid net worth.
"Risk less than 1% of your speculative account on a trade. This tends to keep the fluctuations in the trading account small, relative to net worth. Risk no more than you can afford to lose, and also risk enough so that a win is meaningful. The solution is to risk just enough that a profitable outcome is meaningful but not so much that a loss forces you to lose your nerve," he said.
Follow your trading rules
According to Seykota trading rules are vital and are critical to one's success. He feels when traders sit down to place a trade, nobody tells them how much to risk or whether to buy or sell.
Seykota is also a huge believer in rules and everything he does is based on strict trading rules he’s outlined for himself which helps him stay calm even when things aren’t going his way.
"It’s a rule that defines how much you’re allowed to risk or what you’re supposed to do during a losing streak. They help keep you disciplined in a world without many boundaries," he said.
Know when to break the rules
Seykota is of the view that a balance between following rules and breaking them is very important.
"Sometimes I trade entirely off the mechanical part, sometimes I override the signals based on strong feelings, and sometimes I just quit altogether. If I didn’t allow myself the freedom to discharge my creative side, it might build up to some kind of blowout. Striking a workable ecology seems to promote trading longevity, which is one key to success," he said.
Seykota believes that the win rate for any trader is insignificant and what really matters is having an asymmetrical profit to loss ratio.
He feels finding a trading approach that fits one's personality is vital and sometimes intuition and “gut feel” can become one's most useful assets.
"I don’t think traders can follow rules for very long unless they reflect their own trading style. Eventually, a breaking point is reached and the trader has to quit or change or find a new set of rules he can follow. This seems to be part of the process of evolution and growth of a trader," he says.
Reduce your trading risk
Seykota is of the view that the three primary components of trading are (1) the long-term trend, (2) the current chart pattern, and (3) picking a good spot to buy or sell.
"Trading requires skill at reading the markets and at managing your own anxieties. Risk is the uncertain possibility of loss. If you could quantify risk exactly, it would no longer be a risk. Risk control has to do with your willingness to allow your stop to do its job," he said.
Have a winning mindset
Seykota believes a losing trader can do little to transform himself into a winning trader as a losing trader is not going to want to transform himself.
But a winning trader will always be wanting to learn and would like to transform every bet into a profitable one.
Seykota is of the view that in the recipe for success investors shouldn't forget commitment and a deep belief in the inevitability of success.
Leave emotions aside while trading
Seykota feels investors shouldn't get emotionally attached to their trading bets as it may lead to huge losses.
“Dramatic and emotional trading experiences tend to be negative. Pride is a great banana peel, as are hope, fear, and greed. My biggest slip-ups occurred shortly after I got emotionally involved with positions,” he said.
Seykota is of the view that the market is always right and investors should make their trading bets without letting their emotions get the better of them.
“If you want to know everything about the market, go to the beach. Push and pull your hands with the waves. Some are bigger waves, some are smaller. But if you try to push the wave out when it’s coming in, it’ll never happen. The market is always right,” he said.
(Disclaimer: This article is based on Ed Seykota's interview with Jack Schwager in the Market Wizards books series)
#trade#investing#brainmasstraders#brainmassfinance#tradewithraj#learnwithraj#investinglessons#tradingquotes#marketwizard#edseykota#greed#psychology#bet#emotions#cutloss#ridewinners#benjamingraham#warrenbuffet#peterlynch
0 notes