#circlebar
Explore tagged Tumblr posts
Visit Tumblr Blog
Explore Tumblr blogs with no restrictions, modern design and the best experience.
Last Seen Tumblr Blogs


Fun Fact
If you dial 1-866-584-6757, you can leave an audio post for your followers.
Text
June 1st - Subsonics & Chicken Snake at Circle Bar, New Orleans
“We are all gonna be gettin a quick eyefull and earfull in New Orleans this Saturday night at the Circle Bar, a place that's near and dear to our hearts, wherever we are. It's gonna be a quick trip: get in Saturday around 530 pm... take off Sunday morning around 7am. It's all gonna be over in the wink of an eye. Faster than the life cycle of a fly.” - Subsonics
youtube

#subsonics#thesubsonics#slovenlyrecordings#slovenlyrecords#atlanta#punk#garagepunk#punkrock#concert#circlebar
1 note
·
View note
Photo

This was an unexpected shot Razor Linings is a New Orleans tradition I try to zone out in focus and give attention set a task at hand. I believe this is one of my gifts and the Bible said that my gifts will make room I'm looking forward #7140 #BMC #CARNIVALLOUNGE #CIRCLEBAR #DMACSBAR&GRILL #HIHOLOUNGE #HOUSEOFBLUES #THEJAZZPLAYHOUSE #PRESERVATION HALL #PRIMEEXAMPLE #RALPHONTHEPARK #ROCKNBOWL #ROOSEVELT'HOTEL (at Blades Barber and Beauty Salon) https://www.instagram.com/p/B5OqSRJlGxH/?igshid=l4bluvivzzrs
#7140#bmc#carnivallounge#circlebar#dmacsbar#hiholounge#houseofblues#thejazzplayhouse#preservation#primeexample#ralphonthepark#rocknbowl#roosevelt
0 notes
Photo

Salute everyone I'm meeing tonight @ @ameristarsc #CircleBar @KingChecaugo Fl@out Entertainment LLC (at Ameristar Casino Resort Spa St. Charles) https://www.instagram.com/p/Bsj-9TSnel4/?utm_source=ig_tumblr_share&igshid=13zr9kp4na3on
0 notes
Photo

#pretty #CrownePlaza #rosebank @tsogosun #light #circlebar #purple #lights #roses #rosesofinstagram (at Circle Bar)
0 notes
Photo

NEWS FLASH #tommywrightiii #rikandthepigs at #circlebar SATURDAY MARCH 4th #neworleansnightlife #memphisrap #lumpyrecords (at The Circle Bar)
0 notes
Text
Tutorial Visualisasi Data Circle Pack Menggunakan Aplikasi Stata
Tutorial Visualisasi Data Circle Pack Menggunakan Aplikasi Stata-Visualisasi data Circle Pack adalah sebuah metode visualisasi yang digunakan untuk menyajikan data hierarki dalam bentuk lingkaran-lingkaran yang saling bersarang. Lingkaran-lingkaran tersebut mewakili entitas-entitas dalam data hierarki, dan ukuran lingkaran menunjukkan tingkat pentingnya entitas tersebut dalam hierarki. Visualisasi ini berguna untuk menyajikan data yang kompleks dengan cara yang mudah dipahami.
Kelebihan dan kekurangan Visualisasi Data Circle Pack
Kelebihan dari visualisasi data Circle Pack adalah: - Mempermudah pemahaman data hierarki: Visualisasi ini memungkinkan pengguna untuk dengan mudah memahami hubungan antara entitas dalam hierarki. - Menyajikan banyak informasi dalam satu tampilan: Visualisasi ini mampu menyajikan banyak informasi dalam satu tampilan, sehingga pengguna dapat dengan cepat menemukan pola dan hubungan dalam data. - Memungkinkan interaksi: Visualisasi ini sering dilengkapi dengan fitur interaksi seperti zoom, pan, dan hover, yang memungkinkan pengguna untuk lebih dekat dengan detail data. Kekurangan dari visualisasi data Circle Pack adalah: - Sulit untuk data dengan jumlah entitas yang besar: Jika data memiliki banyak entitas, maka visualisasi ini dapat menjadi sangat kompleks dan sulit dipahami. - Memerlukan pengetahuan yang cukup: Untuk dapat memahami visualisasi ini, pengguna harus memiliki pengetahuan yang cukup tentang hierarki dan bagaimana menginterpretasikan visualisasi. - Memerlukan spesifikasi yang tepat: Visualisasi ini harus dikonfigurasi dengan benar agar dapat memberikan informasi yang berguna. Jika tidak dikonfigurasi dengan benar, maka hasil visualisasi mungkin tidak berguna.
Tutorial Visualisasi Data Circle Pack dengan Aplikasi Stata
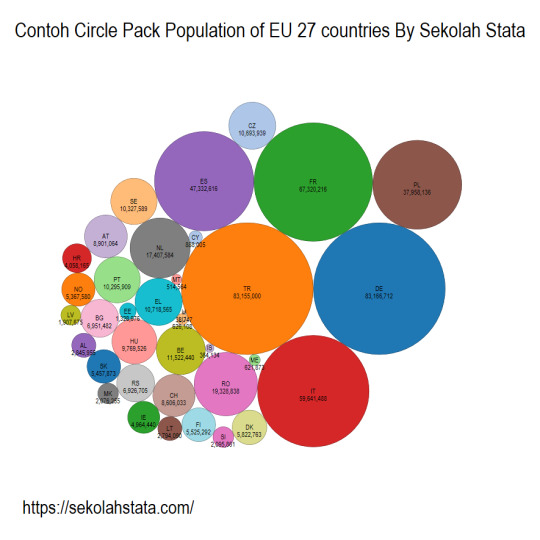
Untuk membuat visualisasi data Circle Pack dengan aplikasi Stata, Sobat dapat menggunakan paket "circlepack" yang dapat diunduh melalui SSC atau GitHub. Berikut adalah langkah-langkah umum untuk membuat visualisasi Circle Pack dengan menggunakan paket "circlepack" di Stata: - Unduh paket "circlepack" dengan perintah "ssc install circlepack, replace" atau "net install circlepack, from("https://raw.githubusercontent.com/asjadnaqvi/stata-circlepack/main/installation/")" - Import data sobat ke dalam Stata. Data harus dalam format hierarki, dengan kolom yang mewakili entitas dan relasi hierarki antar entitas. - Jalankan perintah "circlepack" dengan opsi yang sesuai, misalnya "circlepack var1 , by(var3) size(var4) color(var5) level(1) - Opsi yang tersedia dalam perintah "circlepack" seperti by, size, color, level yang digunakan untuk menentukan tingkatan hierarki yang akan ditampilkan, variabel yang digunakan untuk menentukan hierarki, ukuran lingkaran, dan warna lingkaran. - Perintah ini akan menghasilkan visualisasi Circle Pack yang dapat diinteraksikan dan dapat di-save dengan perintah seperti "graph export" Pastikan Sobat sudah meng-install paket "circlepack" sebelum menjalankan perintah ini. Jika ada masalah pada saat install paket "circlepack" , Sobat dapat mengecek dokumentasi paket tersebut. kemudian sobat juga dapat menggunakan ttemplate codingan berikut ini : clear set scheme white_tableau graph set window fontface "Arial Narrow" use "https://github.com/asjadnaqvi/stata-circlepack/blob/main/data/demo_r_pjangrp3_clean.dta?raw=true", clear drop year keep NUTS_ID y_TOT drop if y_TOT==0 keep if length(NUTS_ID)==5 gen NUTS2 = substr(NUTS_ID, 1, 4) gen NUTS1 = substr(NUTS_ID, 1, 3) gen NUTS0 = substr(NUTS_ID, 1, 2) ren NUTS_ID NUTS3 circlepack y_TOT, by(NUTS0) format(.0fc) title("Population of EU 27 countries")
bagaimana sobat menarik kah ? kasih komentar ya dibawah ini
Kesimpulan
Demikian adalah tulisan Tutorial Visualisasi Data Circle Pack Menggunakan Aplikasi Stata. jika terdapat pertanyaan silahkan tinggalkan dibawah ini. Baca Juga : - Tutorial Visualisasi Data Population Pyramid Plot Menggunakan Aplikasi Stata - Tutorial Visualisasi data Circlebar Menggunakan Stata - Asyafina Survey: Survey Untuk Para Peneliti Read the full article
0 notes
Photo

Creating Stylish and Responsive Progress Bars Using ProgressBar.js
Nothing on the web happens instantly. The only difference is in the time it takes for a process to complete. Some processes can happen in a few milliseconds, while others can take up to several seconds or minutes. For example, you might be editing a very large image uploaded by your users, and this process can take some time. In such cases, it is a good idea to let the visitors know that the website is not stuck somewhere but it is actually working on your image and making some progress.
One of the most common ways to show readers how much a process has progressed is to use progress bars. In this tutorial, you will learn how to use the ProgressBar.js library to create different progress bars with simple and complex shapes.
Creating a Basic Progress Bar
Once you have included the library in your project, creating a progress bar using this library is easy. ProgressBar.js is supported in all major browsers, including IE9+, which means that you can use it in any website you are creating with confidence. You can get the latest version of the library from GitHub or directly use a CDN link to add it in your project.
To avoid any unexpected behavior, please make sure that the container of the progress bar has the same aspect ratio as the progress bar. In the case of a circle, the aspect ratio of the container should be 1:1 because the width will be equal to the height. In the case of a semicircle, the aspect ratio of the container should be 2:1 because the width will be double the height. Similarly, in the case of a simple line, the container should have an aspect ratio of 100:strokeWidth for the line.
When creating progress bars with a line, circle, or semicircle, you can simply use the ProgressBar.Shape() method to create the progress bar. In this case, the Shape can be a Circle, Line, or SemiCircle. You can pass two parameters to the Shape() method. The first parameter is a selector or DOM node to identify the container of the progress bar. The second parameter is an object with key-value pairs which determine the appearance of the progress bar.
You can specify the color of the progress bar using the color property. Any progress bar that you create will have a dark gray color by default. The thickness of the progress bar can be specified using the strokeWidth property. You should keep in mind that the width here is not in pixels but in terms of a percentage of the canvas size. For instance, if the canvas is 200px wide, a strokeWidth value of 5 will create a line which is 10px thick.
Besides the main progress bar, the library also allows you to draw a trailing line which will show readers the path on which the progress bar will move. The color of the trail line can be specified using the trailColor property, and its width can be specified using the trailWidth property. Just like strokeWidth, the trailWidth property also computes the width in percentage terms.
The total time taken by the progress bar to go from its initial state to its final state can be specified using the duration property. By default, a progress bar will complete its animation in 800 milliseconds.
You can use the easing property to specify how a progress bar should move during the animation. All progress bars will move with a linear speed by default. To make the animation more appealing, you can set this value to something else like easeIn, easeOut, easeInOut, or bounce.
After specifying the initial parameter values, you can animate the progress bars using the animate() method. This parameter accepts three parameters. The first parameter is the amount up to which you want to animate the progress line. The two other parameters are optional. The second parameter can be used to override any animation property values that you set during initialization. The third parameter is a callback function to do something else once the animation ends.
In the following example, I have created three different progress bars using all the properties we have discussed so far.
var lineBar = new ProgressBar.Line('#line-container', { color: 'orange', strokeWidth: 2, trailWidth: 0.5 }); lineBar.animate(1, { duration: 1000 }); var circleBar = new ProgressBar.Circle('#circle-container', { color: 'white', strokeWidth: 2, trailWidth: 10, trailColor: 'black', easing: 'easeInOut' }); circleBar.animate(0.75, { duration: 1500 }); var semiBar = new ProgressBar.SemiCircle('#semi-container', { color: 'violet', strokeWidth: 2, trailWidth: 0.5, easing: 'bounce' }); semiBar.animate(1, { duration: 3000 });
Animating Text Values With the Progress Bar
The only thing that changes with the animation of the progress bars in the above example is their length. However, ProgressBar.js also allows you to change other physical attributes like the width and color of the stroking line. In such cases, you will have to specify the initial values for the progress bar inside the from parameter and the final values inside the to parameter when initializing the progress bars.
You can also tell the library to create an accompanying text element with the progress bar to show some textual information to your users. The text can be anything from a static value to a numerical value indicating the progress of the animation. The text parameter will accept an object as its value.
This object can have a value parameter to specify the initial text to be shown inside the element. You can also provide a class name to be added to the text element using the className parameter. If you want to apply some inline styles to the text element, you can specify them all as a value of the style parameter. All the default styles can be removed by setting the value of style to null. It is important to remember that the default values only apply if you have not set a custom value for any CSS property inside style.
The value inside the text element will stay the same during the whole animation if you don't update it yourself. Luckily, ProgressBar.js also provides a step parameter which can be used to define a function to be called with each animation step. Since this function will be called multiple times each second, you need to be careful with its use and keep the calculations inside it simple.
var lineBar = new ProgressBar.Line("#line-container", { strokeWidth: 4, trailWidth: 0.5, from: { color: "#FF9900" }, to: { color: "#00FF99" }, text: { value: '0', className: 'progress-text', style: { color: 'black', position: 'absolute', top: '-30px', padding: 0, margin: 0, transform: null } }, step: (state, shape) => { shape.path.setAttribute("stroke", state.color); shape.setText(Math.round(shape.value() * 100) + ' %'); } }); lineBar.animate(1, { duration: 4000 }); var circleBar = new ProgressBar.Circle("#circle-container", { color: "white", strokeWidth: 2, trailWidth: 25, trailColor: "black", easing: "easeInOut", from: { color: "#FF9900", width: 1 }, to: { color: "#FF0099", width: 25 }, text: { value: '0', className: 'progress-text', style: { color: 'black', position: 'absolute', top: '45%', left: '42%', padding: 0, margin: 0, transform: null } }, step: (state, shape) => { shape.path.setAttribute("stroke", state.color); shape.path.setAttribute("stroke-width", state.width); shape.setText(Math.round(shape.value() * 100) + ' %'); } }); circleBar.animate(0.75, { duration: 1500 }); var semiBar = new ProgressBar.SemiCircle("#semi-container", { color: "violet", strokeWidth: 2, trailWidth: 8, trailColor: "black", easing: "bounce", from: { color: "#FF0099", width: 1 }, to: { color: "#FF9900", width: 2 }, text: { value: '0', className: 'progress-text', style: { color: 'black', position: 'absolute', top: '45%', left: '50%', padding: 0, margin: 0, transform: null } }, step: (state, shape) => { shape.path.setAttribute("stroke", state.color); shape.path.setAttribute("stroke-width", state.width); shape.setText(Math.round(shape.value() * 100) + ' %'); } }); semiBar.animate(0.75, { duration: 2000 });
Creating Progress Bars With Custom Shapes
Sometimes, you might want to create progress bars with different shapes that match the overall theme of your website. ProgressBar.js allows you to create progress bars with custom shapes using the Path() method. This method works like Shape() but provides fewer parameters to customize the progress bar animation. You can still provide a duration and easing value for the animation. If you want to animate the color and width of the stroke used for drawing the custom path, you can do so inside the from and to parameters.
The library does not provide any way to draw a trail for the custom path, as it did for simple lines and circles. However, you can create the trail yourself fairly easily. In the following example, I have created a triangular progress bar using the Path() method.
Before writing the JavaScript code, we will have to define our custom SVG path in HTML. Here is the code I used to create a simple triangle:
<svg xmlns="http://www.w3.org/2000/svg" version="1.1" x="0" y="0" width="300" height="300" viewBox="0 0 300 300"> <path d="M 50 50 L 200 100 L 200 300 z" fill="none" stroke="#ddd" stroke-width="1"/> <path id="triangle" d="M 50 50 L 200 100 L 200 300 z" fill="none" stroke="blue" stroke-width="5"/> </svg>
You might have noticed that I created two different path elements. The first path has a light gray color which acts like the trail we saw with simple progress bars in the previous section. The second path is the one that we animate with our code. We have given it an id which is used to identify it in the JavaScript code below.
var path = new ProgressBar.Path("#triangle", { duration: 6000, from: { color: "#ff0000", width: 2 }, to: { color: "#0099ff", width: 10 }, strokeWidth: 4, easing: "easeInOut", step: (state, shape) => { shape.path.setAttribute("stroke", state.color); shape.path.setAttribute("stroke-width", state.width); } }); path.animate(1);
Final Thoughts
As you saw in this tutorial, ProgressBar.js allows you to easily create different kinds of progress bars with ease. It also gives you the option to animate different attributes of the progress bar like its width and color.
Not only that, but you can also use this library to change the value of an accompanying text element in order to show the progress in textual form. This tutorial covers everything that you need to know to create simple progress bars. However, you can go through the documentation to learn more about the library.
If there is anything that you would like me to clarify in this tutorial, feel free to let me know in the comments.
by Monty Shokeen via Envato Tuts+ Code https://ift.tt/2JrlpBT
0 notes
Photo

This was an unexpected shot Razor Linings is a New Orleans tradition I try to zone out in focus and give attention set a task at hand. I believe this is one of my gifts and the Bible said that my gifts will make room I'm looking forward #7140 #BMC #CARNIVALLOUNGE #CIRCLEBAR #DMACSBAR&GRILL #HIHOLOUNGE #HOUSEOFBLUES #THEJAZZPLAYHOUSE #PRESERVATION HALL #PRIMEEXAMPLE #RALPHONTHEPARK #ROCKNBOWL #ROOSEVELT'HOTEL (at Blades Barber and Beauty Salon) https://www.instagram.com/p/B5OqSRJlGxH/?igshid=1l98jsng7ea04
#7140#bmc#carnivallounge#circlebar#dmacsbar#hiholounge#houseofblues#thejazzplayhouse#preservation#primeexample#ralphonthepark#rocknbowl#roosevelt
0 notes
Photo

My signature drink #StrawberryDaiquiri at #CrownePlaza #circlebar @TsogoSun I approve. 😉 (at Circle Bar)
0 notes
Photo

TONIGHT @thecirclebar #DARKANDSHINY a night of #goth #deathrock #postpunk #industrialdance #minimalsynth #synthpop & #eroticthrillers #nighteyes #shannontweed #neworleansnightlife #circlebar #followyournola (at The Circle Bar)
#goth#neworleansnightlife#eroticthrillers#deathrock#darkandshiny#industrialdance#postpunk#minimalsynth#circlebar#shannontweed#nighteyes#followyournola#synthpop
0 notes
Text
Tutorial Visualisasi data Circlebar Menggunakan Stata
Tutorial Visualisasi data Circlebar Menggunakan Stata-Bagai ungkapan "Lingkaran itu seperti hidup, tidak selalu rapi dan sempurna, tapi dengan Circlebar kita bisa memahami setiap bagiannya". Visualisasi data Circlebar adalah sebuah representasi grafis dari data yang digunakan untuk menampilkan distribusi data dalam bentuk lingkaran yang dipotong-potong oleh batang-batang. Setiap potongan lingkaran mewakili sebuah kategori dari data yang ditampilkan, dan ukurannya menunjukkan jumlah item dalam kategori tersebut. Ini digunakan untuk menunjukkan proporsi relatif dari setiap kategori dalam data secara visual yang mudah dimengerti.
Apa kelebihan dan kurangan Visualisasi Circlebar
Kelebihan
Kelebihan visualisasi data Circlebar adalah: - Mempermudah pemahaman tentang proporsi relatif setiap kategori dalam data secara visual. - Dapat digunakan untuk menampilkan data kategori dengan jumlah yang besar. - Dapat menampilkan data dengan warna yang berbeda untuk menunjukkan hubungan antar kategori. - Dapat menampilkan legenda yang jelas untuk membantu pemahaman data.
Kekurangan
Kekurangan visualisasi data Circlebar adalah: - Dapat menimbulkan kesulitan dalam membaca data jika jumlah kategori terlalu banyak. - Dapat menimbulkan kesalahan interpretasi jika ukuran lingkaran tidak sebanding dengan jumlah item dalam kategori. - Dapat menimbulkan kesulitan dalam membaca data jika warna yang digunakan tidak jelas atau tidak sesuai dengan kategori. - Sulit untuk menampilkan data dengan skala yang berbeda atau data kontinu. Langkah -langkah Membuat Visualisasi Ciclebar Dengan Aplikasi Stata Langkah-langkah yang benar untuk membuat visualisasi data Circlebar dengan aplikasi Stata adalah sebagai berikut: - Buka aplikasi Stata dan buka data yang akan digunakan untuk visualisasi. - Masukkan perintah "ssc install circlebar, replace" atau "net install circlebar, from("https://raw.githubusercontent.com/asjadnaqvi/stata-circlebar/main/installation/") replace" untuk menginstal paket circlebar yang diperlukan untuk membuat visualisasi Circlebar. - Masukkan perintah "circlebar var1, var2" tanpa tanda kutip, di mana var1 adalah variabel yang akan digunakan sebagai kategori dan var2 adalah variabel yang akan digunakan sebagai ukuran. Misalnya, jika Sobatku ingin menampilkan distribusi jenis kelamin dari sampel data Sobat, Sobat dapat menggunakan "circlebar gender, count" - Tambahkan perintah "color(var3)" tanpa tanda kutip untuk memberikan warna pada setiap kategori, di mana var3 adalah variabel warna. - Tambahkan perintah "legend()" tanpa tanda kutip untuk menambahkan legenda pada visualisasi. - Gunakan perintah "saveas" tanpa tanda kutip untuk menyimpan visualisasi sebagai file gambar. Misalnya, "saveas graph1.png" - Selesai. Sobat sekarang dapat melihat visualisasi Circlebar yang dibuat di aplikasi Stata. Note: perintah diatas hanya sebagai contoh, disesuaikan dengan variabel yang digunakan pada data Sobat stata. Berikut adalah contoh template do fle stata ya sobat use "https://github.com/asjadnaqvi/stata-circlebar/blob/main/data/cbardata.dta?raw=true", clear untuk membuat gambar circle bar sebagai berikut : circlebar deathspm, by(month) hasil perintah diatas akan menghasilkan visual sebagai berikut:

bagaimna? keren nggk tuh sobat? langsung cobain ya cuslah
Kesimpulan
Secara umum, visualisasi data Circlebar adalah pilihan yang baik untuk menampilkan data kategori dengan jumlah yang besar dan proporsi relatif yang jelas, Namun, perlu diperhatikan juga kekurangan yang mungkin muncul dan disesuaikan dengan konteks yang digunakan. Kabar baik nih sobat sekolah stata akan menyelenggarakan kelas visualisasi data join kelas yuk . Registrasi disini Baca juga : - Tutorial Visualisasi data Slope Chart Dengan Aplikasi Stata - Tutorial Sankey diagram Menggunakan Aplikasi Stata - Komunitas Riset Dan Inovasi Read the full article
0 notes
Video
vimeo
"Locusts" - Widowspeak
I was fortunate enough to see the Brooklyn-based band Widowspeak live at the Circle Bar only a month ago before they embarked on a summer long tour of Europe. Not only are Molly, Michael, Willy, Dylan, and Kyle some of the coolest, most down to earth cats I've met, their music, both live and recorded, is dreamy, sexy, and dark in all the right ways. Check out their most recent album, Almanac (2012) from label Captured Tracks now.
- KREWE
2 notes
·
View notes
Photo

Custom #circlebar built by @thetentmerchant for our @sanysidroranch #wedding | photos @schmittphoto | planning @soigneproductions | flowers @toastsantabarbara | lighting @bellavistadesigns (at San Ysidro Ranch)
1 note
·
View note
Link
Get pumped for sunday at circle bar!
1 note
·
View note
Photo

#recordraid after-party @6 or 7 till late #neworleansnightlife #aor to #swamppop in 9 hours or less. #circlebar #alligatorchompchomp (at The Circle Bar)
0 notes