#dataprep
Explore tagged Tumblr posts
Visit Tumblr Blog
Explore Tumblr blogs with no restrictions, modern design and the best experience.
Last Seen Tumblr Blogs


Fun Fact
Post activity is at the highest at 4:00 pm EDT; notes peak at 10:00 pm EDT.
Text


🌐 𝐏𝐨𝐢𝐧𝐭 𝐂𝐥𝐨𝐮𝐝 101: 𝐒𝐨𝐮𝐫𝐜𝐞𝐬, 𝐅𝐨𝐫𝐦𝐚𝐭𝐬, 𝐚𝐧𝐝 𝐏𝐫𝐨𝐜𝐞𝐬𝐬𝐢𝐧𝐠
Working with 3D data? Point clouds are at the core of digital twins, autonomous navigation, and AI-driven spatial analysis—but only if they’re properly understood and processed.
Clean data = better models. And better models = better decisions.
Whether you're in AEC, robotics, or computer vision, mastering point cloud preprocessing is the first step toward smarter, faster, and more accurate outcomes.
👉 Dive deeper and see how intelligent 3D workflows can enhance your projects.
#PointCloudProcessing#Lidar#3DData#SpatialIntelligence#ScanToBIM#ComputerVision#AIData#DigitalTwins#Open3D#Geospatial#SmartConstruction#DataPrep#MachineLearning#AECInnovation#BIM#MEP#Architecture#Engineering#Construction#ConstructionTech
0 notes
Text

Diagram View in Power Query Online lets you visually explore and manage your data transformation steps and dependencies. It's great for understanding the flow and structure of your queries. Have you tried it yet? What do you like or wish it had?
#PowerQuery#DataTransformation#MicrosoftFabric#PowerBI#DataPrep#DiagramView#DataModeling#AnalyticsTools
0 notes
Text
Maximizing Data Potential: The Power of Data Preparation Tools
Data preparation tools play a pivotal role in the realm of big data, catering to structured, unstructured, and semi-structured data environments. These tools come equipped with pre-built functionalities that effectively automate and streamline recurring processes. With collaborative interfaces for report generation and model construction, they ensure seamless operations in data management. Their primary objective is to facilitate the migration of top-quality data for analysis while promptly flagging any instances of data duplication, empowering users to take necessary corrective measures.
Key vendors of data analysis tools offer a plethora of capabilities, ranging from consolidating diverse data sources into cohesive datasets to employing AI-driven mechanisms for data and field identification within multi-structured documents. Automated extraction and classification of data, along with quality assessment, data discovery, and data lineage functionalities, are integral features provided by these leading tools. Moreover, they excel in rectifying imbalanced datasets by amalgamating internal and external data sources, generating new data fields, and eliminating outliers. The evolution of data preparation software is evident in the expansion towards cloud-based solutions and the augmentation of their capabilities to align with DataOps principles, facilitating the automation of data pipeline construction for business intelligence (BI) and analytics purposes.
Quadrant Knowledge Solutions emphasizes the significance of data preparation tools in enabling organizations to identify, cleanse, and transform raw datasets from diverse sources. These tools empower data professionals to conduct comprehensive analysis and derive valuable insights using machine learning (ML) algorithms and analytics tools. By streamlining processes such as data cleansing, validation, and transformation without necessitating human intervention or coding expertise, these tools expedite decision-making processes for businesses. They enable users to devote more time to data mining and analysis, thereby enhancing overall operational efficiency.
Prominent vendors in the data preparation software market include Modak Analytics, Oracle, Precisely, Quest, SAP, SAS, Talend, Tamr, TIBCO, and Yellowfin. These industry leaders offer robust solutions that cater to the diverse needs of modern enterprises. Their continuous innovation and commitment to enhancing data management capabilities contribute significantly to driving efficiency and fostering data-driven decision-making across various sectors.
In conclusion, data preparation tools serve as indispensable assets in the realm of big data, offering a wide array of functionalities to streamline data management processes. Their role in facilitating data migration, cleansing, and transformation cannot be overstated, especially in today's data-driven landscape. With advancements in technology and a growing emphasis on automation, these tools are poised to play an even more significant role in empowering organizations to harness the full potential of their data assets.
#DataAnalysisPreparation#DataPrepTools#DataPreparationSoftware#DataPrep#DataPrepSoftware#DataPreparationTools#CloudBasedDataPreparation#DataOps#BI
1 note
·
View note
Text
🔮 The future of spreadsheets is here! (Un)Perplexed Spready isn't just another incremental update-it's a revolutionary leap that brings conversational AI into the heart of your data workflows. Don't just calculate data, have a conversation with it! Welcome to Spreadsheets 2.0! ✨
https://matasoft.hr/qtrendcontrol/index.php/un-perplexed-spready/un-perplexed-spready-various-articles/135-un-perplexed-spready-when-spreadsheets-finally-learn-to-think
https://matasoft.hr/qtrendcontrol/index.php/un-perplexed-spready/un-perplexed-spready-various-articles/135-un-perplexed-spready-when-spreadsheets-finally-learn-to-think
#Innovation #FutureTech #TimeEfficiency #WorkSmarter #SmallBusiness #CompetitiveAdvantage #HRTech #PeopleAnalytics #AIMarketing #DataDrivenStrategy #TextAnalytics #NLProcessing #SpreadsheetRevolution #AIAdvantage #UserExperience #IntuitiveTech #AICapabilities #SmartSpreadsheets
#UnstructuredData #AIAnalytics #DataAutomation #TimeEfficiency #MarketAnalysis #BusinessIntelligence #AIFlexibility #AffordableAI #ValueForMoney #FreeTrial #AITools #LocalAI #DataPrivacy #Ollama #PerplexityAI #DataInnovation #AISpreadsheets #ProductivityRevolution #SpreadsheetRevolution #AIProductivity #DataTools #Automation #Consistency #AIDataSolutions #Analytics #AI #DataAnalysis #AIData #AugmentedIntelligence #HumanAITeamwork #DataProcessing #DataTransformation #AIDataSolutions #Analytics #LLM #Data #AIProductivity #AIDataService #DataExtraction #DataCategorization #DataClassification #DataLabeling #DataMining #AutomatedAnalysis #DataCleaning #DataCategorization #BusinessIntelligence
#Productivity #DataAnalysis #AIPoweredAnalysis #DataPrep #DataPolish #SupplyChain #Logistics #ProductAnalysis #AITools #FinTech #EcommerceTools #MarketingAnalytics #CustomerInsights
#SpreadsheetRevolution #AIDecisionMaking #DataOptimization #IntelligentSpreadsheets #AITransformation #AIprecision #DataConsistency #DataStrategy #AIDataSolutions #PracticalAI #DataProcessingPro#DataSolutions #Automation #Speed #Efficiency #AISolutions #AIrevolution #SpreadsheetInnovation #AIProductivity #DataManagement #DataTransformation #BigData #AIProductivity #DataAnnotation #AIDriven #DataMagic #TaskAutomation #AIformulas #Productivity #AIinsights #SpreadsheetMagic #UnPerplexedSpready #AITech #DataTransformation #AIFuture #DataProcessing #DataEfficiency #Spreadsheets #AItransformation #SpreadsheetSolutions #ErrorReduction #AccuracyMatters #AIDataHelp #FastSolutions #SpreadsheetHelp #NLP #DataEntry #ArtificialIntelligence #Spreadsheets #MachineLearning #DataAnnotation #DataPrep #BigData #DataProcessing #Matasoft #MachineLearning #Ecommerce #HealthTech #Marketing #Software #Innovation #Matasoft #SpreadsheetAutomation #AIpoweredTools #EfficiencyWithAI #ExcelAutomation #GoogleSheetsIntegration

0 notes
Text

How to Automate Data Insights with Machine Learning (Without a Data Science Team)
Not long ago, extracting meaningful insights from data required a team of highly skilled data scientists armed with complex algorithms and deep technical expertise. For many businesses, this was a roadblock—hiring a dedicated data team wasn’t just expensive, it was impractical. But today, the game has changed. Advances in machine learning (ML) automation have made it possible for companies to harness the power of AI without needing an in-house team of experts.
Imagine being able to predict customer trends, optimize marketing strategies, and streamline operations—all without writing a single line of code. Thanks to no-code and low-code machine learning platforms, this is now a reality. Whether you're a small startup, a growing business, or an established company looking to do more with data, automated ML tools can help you turn raw numbers into actionable insights.
Why Automate Data Insights?
Automating data insights with machine learning allows businesses to make informed decisions faster and more efficiently. Here are some key benefits:
Saves Time and Resources – Eliminates the need for manual data analysis, enabling teams to focus on strategic tasks.
Increases Accuracy – Reduces human error by leveraging AI-driven algorithms.
Improves Decision-Making – Helps businesses make data-backed decisions in real-time.
Democratizes Data Access – Empowers non-technical teams to analyze and interpret data without reliance on data scientists.
Scalability – Allows businesses to process large datasets quickly and efficiently.

Steps to Automating Data Insights with Machine Learning
1. Identify Your Business Goals
Before diving into automation, define what insights you need. Some common business use cases include:
Customer behaviour analysis – Understanding purchasing trends and preferences.
Sales forecasting – Predicting future revenue based on historical data.
Operational efficiency – Identifying bottlenecks in workflows.
Fraud detection – Spotting unusual patterns in financial transactions.
By defining clear objectives, you can choose the right ML tools and models to achieve meaningful insights.
2. Collect and Prepare Your Data
Good insights start with high-quality data. Here’s how to prepare your data:
Gather Data – Extract information from CRM systems, sales reports, social media analytics, IoT devices, etc.
Clean Data – Remove duplicates, handle missing values, and normalize formats.
Label Data (if needed) – Ensure structured data for supervised machine learning models.
There are automated data preparation tools such as Trifacta, DataRobot, DataPeak by FactR and Google Cloud Dataprep that can help streamline this process.
3. Choose a No-Code/Low-Code Machine Learning Tool
For businesses without a data science team, no-code and low-code ML platforms offer a powerful solution. Some popular options include:
Google AutoML – Automates model training and deployment.
DataRobot – End-to-end automation of machine learning workflows.
DataPeak by FactR – Uses AI to automate workflows and deliver real-time insights.
BigML – Drag-and-drop machine learning for business analytics.
H2O.ai – Open-source AI with automated machine learning capabilities.
These tools allow users to upload datasets, train models, and extract insights with minimal coding.
4. Build and Train Machine Learning Models
Most automated ML platforms handle the complex processes of model selection, feature engineering, and hyperparameter tuning. Here’s a typical workflow:
Upload Your Data – Import datasets into your chosen ML platform.
Select a Target Variable – Choose the metric or outcome you want to predict (e.g., customer churn, sales revenue, inventory demand).
Run AutoML – Let the tool analyze the data and generate the best-performing model.
Evaluate Model Performance – Review accuracy, precision, and recall metrics.
5. Deploy and Integrate ML Models
Once your model is trained, it needs to be deployed so that it can generate real-time insights. Automated ML platforms typically provide:
APIs for Integration – Connect predictive models to business applications like CRM, ERP, and marketing automation tools.
Batch Processing – Upload bulk data for periodic analysis.
Dashboards & Reports – Tools like Tableau, DataPeak by FactR, Power BI, and Google Data Studio can visualize the insights.
6. Automate Insights Delivery
For real impact, your insights should be actionable and easily accessible. Consider:
Automated Reports & Alerts – Set up scheduled email alerts when key metrics change.
Embedded Analytics – Integrate insights directly into business dashboards.
Chatbots & Virtual Assistants – Use AI-driven chatbots to deliver insights via Slack, Teams, or email.
7. Continuously Monitor and Improve Models
Machine learning models need regular updates to maintain accuracy. Here’s how:
Monitor Performance – Track how well the model is performing over time.
Retrain with New Data – Periodically update models with the latest data to improve accuracy.
A/B Testing – Experiment with different models to optimize results.
“Machine learning automation is leveling the playing field—turning complex data into actionable insights without the need for an entire data science department. No-code and low-code platforms now empower every business to harness sophisticated analytics effortlessly.”
— Jordan Fields, CEO of DataInnovate
Best Practices for Automating Data Insights
1. Start Small and Scale Gradually
Begin with a simple use case, evaluate its impact, and then expand automation efforts across departments.
2. Ensure Data Governance and Security
Use encryption, access controls, and compliance measures (GDPR, CCPA) to protect sensitive data.
3. Foster a Data-Driven Culture
Encourage employees to rely on data-driven insights for decision-making by providing training and accessible analytics tools.
4. Regularly Validate Insights
Cross-check ML-generated insights with business knowledge to ensure practical relevance.
5. Leverage Cloud-Based Solutions
Cloud platforms like AWS, Google Cloud, and Azure offer scalable machine learning automation with minimal infrastructure costs.
6. The Human Touch in Automated Insights
Even though machine learning automates insights, the best results still come from the combination of AI and human expertise. Business leaders should focus on:
Asking the Right Questions – AI can process data, but it needs the right business questions to generate meaningful insights.
Balancing AI with Intuition – Not every decision should be solely data-driven; human judgment plays a key role.
Encouraging a Data-Driven Culture – Teams should be empowered to trust, interpret, and act on AI-driven insights rather than blindly following recommendations.
Avoid These Mistakes When Implementing ML for Data Insights
1. Using Low-Quality Data
Garbage in, garbage out—if your data is inaccurate, incomplete, or biased, your machine learning model will produce unreliable insights. Always clean and validate your data before use.
2. Ignoring Model Monitoring and Updates
ML models can degrade over time due to shifting trends in the data. Regularly retrain and update models to ensure they stay relevant and accurate.
3. Overcomplicating the Process
Many businesses try to automate too much at once. Start with simple use cases and scale gradually to avoid overwhelming your team.
4. Misinterpreting Insights
Machine learning can highlight patterns, but human judgment is still crucial. Always cross-check AI-generated insights with business knowledge to avoid making flawed decisions.
5. Lacking Data Security and Compliance
Failing to protect sensitive data can lead to security breaches and legal issues. Ensure your data practices comply with regulations like GDPR and CCPA.
What’s Next for Automated Machine Learning?
1. AI-Driven Data Wrangling
More tools are emerging that can automatically clean, transform, and prepare data for ML models without human intervention.
2. Explainable AI (XAI)
New advancements are making it easier to interpret machine learning decisions, building trust in automated insights.
3. Real-Time Predictive Analytics
More businesses are moving toward real-time AI-driven analytics for instant decision-making.
4. Conversational AI for Data Insights
AI-powered chatbots and voice assistants are making it possible to ask questions and receive insights conversationally.
5. AutoML 2.0
The next generation of automated machine learning will bring greater model customization with even less manual intervention.
Automating data insights with machine learning no longer requires a dedicated data science team. Thanks to no-code and low-code platforms, businesses of all sizes can harness the power of AI-driven analytics. By following the right approach—defining goals, preparing data, leveraging AutoML tools, and continuously improving models—your business can gain valuable insights without deep technical expertise.
Learn more about DataPeak:
#datapeak#factr#saas#technology#agentic ai#artificial intelligence#machine learning#ai#ai-driven business solutions#machine learning for workflow#ai solutions for data driven decision making#ai business tools#aiinnovation#digitaltools#digital technology#digital trends#cloudmigration#cloudcomputing#smbsuccess#smbs
0 notes
Text
Big Data and Analytics in GCC Market: Size, Share, Scope, Analysis, Forecast, Growth and Industry Report 2032 – Retail and E-commerce Trends
Big Data and Analytics are transforming the operational frameworks of Global Capability Centers (GCCs) across the globe. As businesses increasingly recognize the pivotal role of data in driving strategic initiatives, Global Capability Centers are evolving into centers of excellence for data-driven decision-making. According to research 76% of Global Capability Centers identified data as a critical area for future growth,
Big Data and Analytics in GCC Market is experiencing rapid growth due to the region’s digital transformation initiatives. Governments and enterprises are leveraging data to drive innovation, optimize services, and improve decision-making. As a result, demand for data-driven strategies is surging across sectors.
Big Data and Analytics in GCC Market continues to evolve with the rising adoption of AI, cloud computing, and IoT technologies. From smart cities to healthcare and finance, businesses in the Gulf Cooperation Council (GCC) are embracing analytics to remain competitive, improve operational efficiency, and enhance customer experiences.
Get Sample Copy of This Report: https://www.snsinsider.com/sample-request/4716
Market Keyplayers:
IBM Corporation (IBM Watson, IBM Cloud Pak for Data)
Microsoft Corporation (Microsoft Azure, Power BI)
Oracle Corporation (Oracle Analytics Cloud, Oracle Big Data Service)
SAP SE (SAP HANA, SAP BusinessObjects)
SAS Institute Inc. (SAS Viya, SAS Data Management)
Google LLC (Google Cloud Platform, BigQuery)
Amazon Web Services (AWS) (Amazon Redshift, Amazon EMR)
Tableau Software (Tableau Desktop, Tableau Online)
Teradata Corporation (Teradata Vantage, Teradata Cloud)
Cloudera, Inc. (Cloudera Data Platform, Cloudera Machine Learning)
Snowflake Inc. (Snowflake Cloud Data Platform)
MicroStrategy Incorporated (MicroStrategy Analytics)
Qlik Technologies (Qlik Sense, QlikView)
Palantir Technologies (Palantir Foundry, Palantir Gotham)
TIBCO Software Inc. (TIBCO Spotfire, TIBCO Data Science)
Domo, Inc. (Domo Business Cloud)
Sisense Inc. (Sisense for Cloud Data Teams, Sisense Fusion)
Alteryx, Inc. (Alteryx Designer, Alteryx Connect)
Zoho Corporation (Zoho Analytics, Zoho DataPrep)
ThoughtSpot Inc. (ThoughtSpot Search & AI-Driven Analytics)
Trends Shaping the Market
Government-Led Digital Initiatives: National visions such as Saudi Arabia’s Vision 2030 and the UAE’s Smart Government strategy are fueling the adoption of big data solutions across public and private sectors.
Growth in Smart City Projects: Cities like Riyadh, Dubai, and Doha are integrating big data analytics into infrastructure development, transportation, and citizen services to enhance urban living.
Increased Investment in Cloud and AI: Cloud-based analytics platforms and AI-powered tools are gaining traction, enabling scalable and real-time insights.
Sector-Wide Adoption: Industries including oil & gas, healthcare, finance, and retail are increasingly utilizing analytics for predictive insights, risk management, and personalization.
Enquiry of This Report: https://www.snsinsider.com/enquiry/4716
Market Segmentation:
By Type
Shared Service Centers
Innovation Centers
Delivery Centers
By Industry Vertical
Banking and Financial Services
Healthcare
Retail
Manufacturing
Telecommunications
By Functionality
Descriptive Analytics
Predictive Analytics
Prescriptive Analytics
Real-time Analytics
By Technology Type
Data Management
Analytics Tools
Artificial Intelligence & Machine Learning
By End-User
Large Enterprises
Small and Medium Enterprises (SMEs)
Market Analysis
Accelerated Digital Transformation: Organizations across the GCC are shifting to digital-first operations, creating vast amounts of data that require robust analytics solutions.
Public and Private Sector Collaboration: Joint efforts between governments and tech firms are fostering innovation, resulting in smart platforms for public services, energy, and education.
Data-Driven Decision Making: Businesses are leveraging data to improve ROI, streamline operations, and personalize offerings—especially in e-commerce, banking, and telecommunications.
Cybersecurity and Data Privacy Awareness: With the increase in data generation, there’s a growing emphasis on securing data through advanced governance and compliance frameworks.
Future Prospects
The Big Data and Analytics in GCC Market is expected to witness exponential growth over the next five years. With increasing internet penetration, 5G rollout, and continued focus on digital infrastructure, data-driven technologies will become even more central to economic and social development in the region.
Talent Development and Upskilling: Governments are investing in training programs and digital literacy to prepare a workforce capable of managing and interpreting big data.
Emerging Startups and Innovation Hubs: The GCC is witnessing a rise in homegrown analytics startups and incubators that are driving localized solutions tailored to regional needs.
AI Integration: The convergence of AI with big data will unlock new insights and automate complex tasks in sectors such as logistics, healthcare diagnostics, and financial modeling.
Regulatory Frameworks: Future success will depend on the creation of robust regulatory policies ensuring data privacy, cross-border data flows, and ethical AI usage.
Access Complete Report: https://www.snsinsider.com/reports/big-data-and-analytics-in-gcc-market-4716
Conclusion
The Big Data and Analytics in GCC Market stands at the forefront of digital transformation. With strong government backing, sector-wide adoption, and a growing tech ecosystem, the region is well-positioned to become a data-driven powerhouse. As the market matures, the focus will shift from data collection to intelligent utilization—empowering smarter decisions, better services, and sustainable growth across the GCC.
About Us:
SNS Insider is one of the leading market research and consulting agencies that dominates the market research industry globally. Our company's aim is to give clients the knowledge they require in order to function in changing circumstances. In order to give you current, accurate market data, consumer insights, and opinions so that you can make decisions with confidence, we employ a variety of techniques, including surveys, video talks, and focus groups around the world.
Contact Us:
Jagney Dave - Vice President of Client Engagement
Phone: +1-315 636 4242 (US) | +44- 20 3290 5010 (UK)
0 notes
Text
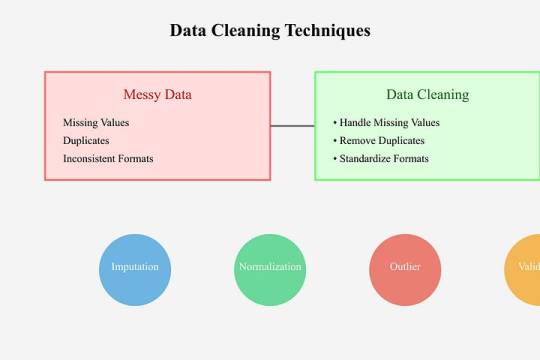
Data Cleaning Techniques Every Data Scientist Should Know

Data Cleaning Techniques Every Data Scientist Should Know
Data cleaning is a vital step in any data analysis or machine learning workflow. Raw data is often messy, containing inaccuracies, missing values, and inconsistencies that can impact the quality of insights or the performance of models.
Below, we outline essential data cleaning techniques that every data scientist should know.
Handling Missing Values
Missing data is a common issue in datasets and needs to be addressed carefully.
Common approaches include:
Removing Missing Data:
If a row or column has too many missing values, it might be better to drop it entirely.
python
df.dropna(inplace=True)
# Removes rows with any missing values Imputing Missing Data:
Replace missing values with statistical measures like mean, median, or mode.
python
df[‘column’].fillna(df[‘column’].mean(),
inplace=True)
Using Predictive Imputation:
Leverage machine learning models to predict and fill missing values.
2. Removing Duplicates Duplicates can skew your analysis and result in biased models.
Identify and remove them efficiently:
python
df.drop_duplicates(inplace=True)
3. Handling Outliers
Outliers can distort your analysis and lead to misleading conclusions.
Techniques to handle them include:
Visualization: Use boxplots or scatter plots to identify outliers.
Clipping: Cap values that exceed a specific threshold.
python
df[‘column’] = df[‘column’].clip(lower=lower_limit, upper=upper_limit)
Transformation: Apply logarithmic or other transformations to normalize data.
4. Standardizing and Normalizing
Data To ensure consistency, particularly for machine learning algorithms, data should often be standardized or normalized:
Standardization: Converts data to a mean of 0 and a standard deviation of
python from sklearn.preprocessing
import StandardScaler scaler = StandardScaler()
df_scaled = scaler.fit_transform(df)
Normalization:
Scales values to a range between 0 and 1.
pythonfrom sklearn.preprocessing
import MinMaxScaler scaler = MinMaxScaler()
df_normalized = scaler.fit_transform(df)
5. Fixing Structural Errors
Structural errors include inconsistent naming conventions, typos, or incorrect data types.
Correct these issues by: Renaming columns for uniformity:
python df.rename(columns={‘OldName’: ‘NewName’}, inplace=True)
Correcting data types:
python
df[‘column’] = df[‘column’].astype(‘int’)
6. Encoding Categorical Data
Many algorithms require numeric input, so categorical variables must be encoded:
One-Hot Encoding:
python
pd.get_dummies(df, columns=[‘categorical_column’], drop_first=True)
Label Encoding:
python
from sklearn.preprocessing
import LabelEncoder encoder = LabelEncoder()
df[‘column’] = encoder.fit_transform(df[‘column’])
7. Addressing Multicollinearity
Highly correlated features can confuse models.
Use correlation matrices or Variance Inflation Factor (VIF) to identify and reduce multicollinearity.
8. Scaling Large Datasets For datasets with varying scales, scaling ensures all features contribute equally to the model:
python
from sklearn.preprocessing
import StandardScaler scaler = StandardScaler()
df_scaled = scaler.fit_transform(df)
Tools for Data Cleaning
Python Libraries:
Pandas, NumPy, OpenRefine Automation:
Libraries like dataprep or pyjanitor streamline the cleaning process.
Visual Inspection:
Tools like Tableau and Power BI help spot inconsistencies visually. Conclusion Data cleaning is the foundation of accurate data analysis and successful machine learning projects.
Mastering these techniques ensures that your data is reliable, interpretable, and actionable.
As a data scientist, developing an efficient data cleaning workflow is an investment in producing quality insights and impactful results.
0 notes
Link

Exciting news for data enthusiasts! Zoho DataPrep 2.0, now with AI-driven capabilities, revolutionizes business data management. Features include a visual pipeline builder, Ask Zia AI assistant, reusable templates, real-time dashboards, and enhanced integrations. Sign up for a free trial!
0 notes
Text
Dataset Splitting: Mastering Machine Learning Data Preparation
MachineLearning tip: Master the art of splitting datasets! Learn why it's crucial, how to implement train_test_split, and verify your results. Perfect for #DataScience beginners and pros alike. Boost your ML skills now! #AIEducation #DataPrep
Dataset splitting is a crucial step in machine learning data preparation. By dividing your data into training and testing sets, you ensure your models can generalize well to unseen information. This blog post will guide you through the process of splitting datasets, with a focus on financial data like Tesla’s stock prices. We’ll explore the importance of this technique and provide practical…
0 notes
Text
Practical Python in Power BI: Cleaning constituent data using dataprep.ai
Power BI is a powerful tool. In my consulting work I utilize Power Query for Power BI to transform and prepare constituent data for system migrations. One recent breakthrough in regards to making that even more powerful and efficient was the implementation of Python scripting and the dataprep library.
The following articles were very helpful for figuring out how to do this:
How to Use Python in Power BI - freeCodeCamp
Run Python scripts in Power BI Desktop - Microsoft
There's a major discrepancy between those articles - the freeCodeCamp article provides instructions on how to use a Python environment managed via Anaconda in Power BI; whereas Microsoft's documentation warns that Python distributions requiring an extra step to prepare the environment, such as Conda, might fail to run. They advise to instead use the official Python distribution from python.org.
I've tried both, and as far as I can tell both methods seem to work for this purpose. When installing the official Python distribution, the only pre-packaged installer available is for the current version (currently 3.11.4) which requires a little bit of dataprep debugging post-install to get it working. Anaconda makes it easier to install prior Python versions and to switch between multiple Python environments (I successfully tested this in a Python 3.9 installation running in Anaconda). The following instructions are written for the former method though, using the latest version of Python installed via their Windows executable per Microsoft's recommendation.
To conceptualize how Power BI works with Python, it's important to understand them as entirely separate systems. For the purpose of data transformation, a Power Query Python scripting step loads the previous query step into a pandas dataframe for Python to execute, then loads the output of that back to the next query step.
So with that context, the way we'll approach this install is like so:
Set up a local Python development environment
Install the Dataprep library within that
Utilize a test script to debug and verify that the Python environment is working as expected
Configure Power BI to tap into the Python environment
1. Set up a local Python development environment
The first step is easy, navigate to python.org/downloads, click the Download button, and execute the installer keeping all the default settings.

Once you have Python installed, then open a command prompt and run the following commands:
py -m pip install pandas
py -m pip install matplotlib
After installing these two libraries, you've now got the basics set to use Python in Power BI.
2. Install the Dataprep library
Installing the Dataprep library comes next, and to do that you need Microsoft Visual C++ 14.0 installed as a prerequisite. Navigate on over to the Microsoft Visual Studio downloads page and download the free Community version installer.
Launch the Visual Studio installer, and before you click the install button select the box to install the Python development workload, then also check the box to install optional Python native development tools. Then click install and go get yourself a cup of coffee - it's a large download that'll take a few minutes.
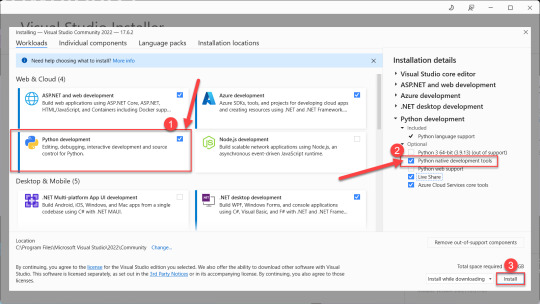
After the Visual Studio installation completes, then head back to your command prompt and run the following command to install Dataprep:
py -m pip install dataprep
3. Utilize a test script to debug and validate the Python environment
With the local Python development environment and Dataprep installed, you can try to execute this test script by running the following command in your command prompt window:
py "C:\{path to script}\Test python pandas script.py"
In practice this script will fail if you try to run it using Python 3.11 (it might work in Python 3.9 via Anaconda). It seems that the reason the script fails is because of a couple of minor incompatibilities in the latest versions of a couple packages used by Dataprep. They're easily debugged and fixed though:
The first error message reads: C:\Users\yourname\AppData\Local\Programs\Python\Python311\Lib\site-packages\dask\dataframe\utils.py:367: FutureWarning: pandas.Int64Index is deprecated and will be removed from pandas in a future version. Use pandas.Index with the appropriate dtype instead.
To fix this error, simply navigate to that file location in Windows Explorer, open the utils.py file, and comment out line 367 by adding a pound sign at the beginning. While you're in there, also comment out lines 409-410 which might produce another error because they reference that function from line 367.

After making that adjustment, if you return to the command line and try to execute the test script you'll encounter another error message. This time it reads: cannot import name 'soft_unicode' from 'markupsafe'
Googling that message turns up a lot of discussion threads from people who encountered the same problem, the upshot of which is that the soft_unicode function was deprecated in markupsafe as of version 2.1.0, and the fix is a simple matter of downgrading that package by running this command in your command line window: py -m pip install markupsafe==2.0.1

After those adjustments have been made, you should be able to run the test script in your command line window and see this successful result:

4. Configure Power BI to tap into the Python environment
You're so close! Now that you have Dataprep working in Python on your local machine, it's time to configure Power BI to leverage it.
In Power BI Desktop - Options - Python scripting, ensure that your Python installation directory is selected as the home directory. Note that if you manage multiple environments via Anaconda, this is where you would instead select Other and paste an environment file path.

Now in Power Query, select Transform - Run Python Script to add a step to your query. The script used here differs in a couple key ways from the test Python script run via your command prompt:
omit import pandas and import numpy
instead of defining df as your pandas dataframe, use the predefined dataset dataframe
My final script, pasted below, leverages the phone and email cleanup functions in Dataprep, as well as leveraging Python to calculate when a proper case cleanup is needed in a slightly more efficient manner than my previous PBI steps to clean that up.

Scripts
Power BI Python script syntax
# 'dataset' holds the input data for this script dataset['FirstName Lower'] = dataset['FirstName'] == dataset['FirstName'].str.lower() dataset['FirstName Upper'] = dataset['FirstName'] == dataset['FirstName'].str.upper() dataset['FirstName Proper'] = dataset['FirstName'].str.title() dataset['LastName Lower'] = dataset['LastName'] == dataset['LastName'].str.lower() dataset['LastName Upper'] = dataset['LastName'] == dataset['LastName'].str.upper() dataset['LastName Proper'] = dataset['LastName'].str.title() from dataprep.clean import validate_phone dataset['Valid Phone'] = validate_phone(dataset["Phone"]) from dataprep.clean import clean_phone dataset = clean_phone(dataset, "Phone") from dataprep.clean import validate_email dataset['Valid Email'] = validate_phone(dataset["Email"]) from dataprep.clean import clean_email dataset = clean_email(dataset, "Email", remove_whitespace=True, fix_domain=True)
Python test script syntax
import pandas as pd import numpy as np df = pd.DataFrame({ "phone": [ "555-234-5678", "(555) 234-5678", "555.234.5678", "555/234/5678", 15551234567, "(1) 555-234-5678", "+1 (234) 567-8901 x. 1234", "2345678901 extension 1234" ], "email": [ "[email protected]", "[email protected]", "y [email protected]", "[email protected]", "H [email protected]", "hello", np.nan, "NULL" ] }) from dataprep.clean import validate_phone df["valid phone"] = validate_phone(df["phone"]) from dataprep.clean import clean_phone df = clean_phone(df, "phone") from dataprep.clean import validate_email df["valid email"] = validate_phone(df["email"]) from dataprep.clean import clean_email df = clean_email(df, "email", remove_whitespace=True, fix_domain=True) print(df)
0 notes
Text
BigQuery for data analytics in GCP
GCP Taining and Certification, Google BigQuery is a fully managed, serverless data warehousing and analytics platform offered by Google Cloud Platform (GCP). It enables organizations to analyze large datasets quickly and efficiently. Here's an overview in 250 words:
1. Scalable Data Warehousing:
BigQuery can handle petabytes of data, providing a scalable solution for data warehousing and analytics.
2. Serverless and Managed:
It's serverless, meaning users don't need to manage infrastructure, and Google takes care of performance optimization and scaling automatically.
3. SQL Query Language:
BigQuery uses standard SQL for querying data, making it accessible to users familiar with SQL.
4. Real-time Analysis:
It supports real-time analysis with streaming data ingestion, enabling immediate insights from live data sources.
5. Integration with GCP Services:
BigQuery seamlessly integrates with other GCP services like Cloud Storage, Dataflow, and Dataprep, allowing data import, transformation, and visualization.
6. Data Security and Governance:
It provides robust security features, including fine-grained access control, encryption at rest and in transit, and audit logging.
7. Cost-Effective Pricing:
Users are billed for the amount of data processed by queries and storage used. BigQuery's pricing model is cost-effective, especially for on-demand, ad-hoc querying.
8. Machine Learning Integration:
It offers integration with Google's AI and machine learning tools, allowing data scientists to train models on BigQuery data.
9. Geospatial Analytics:
BigQuery supports geospatial data types and functions for location-based analysis.
10. Data Export:
Users can export query results to various formats or directly into other GCP services for further analysis or visualization.
11. Data Studio Integration:
Connect BigQuery with Google Data Studio for creating interactive, customizable reports and dashboards.
BigQuery is widely used for various data analytics tasks, including business intelligence, data exploration, machine learning, and real-time data analysis. Its simplicity, scalability, and integration with the broader GCP ecosystem make it a powerful tool for deriving insights from large and complex datasets.
0 notes
Text
🆓 Curious about AI-powered spreadsheets? Get a FREE evaluation period for (Un)Perplexed Spready! Just install the software, send us your machine code, and we'll provide a trial license key that unlocks all premium AI functions. Experience the future of data analysis without risk! 🔍
https://matasoft.hr/qtrendcontrol/index.php/un-perplexed-spready/un-perplexed-spready-download
#FreeTrial #AITools #LocalAI #DataPrivacy #Ollama #PerplexityAI #DataInnovation #AISpreadsheets #ProductivityRevolution #SpreadsheetRevolution #AIProductivity #DataTools #Automation #Consistency #AIDataSolutions #Analytics #AI #DataAnalysis #AIData #AugmentedIntelligence #HumanAITeamwork #DataProcessing #DataTransformation #AIDataSolutions #Analytics #LLM #Data #AIProductivity #AIDataService #DataExtraction #DataCategorization #DataClassification #DataLabeling #DataMining #AutomatedAnalysis #DataCleaning #DataCategorization #BusinessIntelligence
#Productivity #DataAnalysis #AIPoweredAnalysis #DataPrep #DataPolish #SupplyChain #Logistics #ProductAnalysis #AITools #FinTech #EcommerceTools #MarketingAnalytics #CustomerInsights
#SpreadsheetRevolution #AIDecisionMaking #DataOptimization #IntelligentSpreadsheets #AITransformation #AIprecision #DataConsistency #DataStrategy #AIDataSolutions #PracticalAI #DataProcessingPro#DataSolutions #Automation #Speed #Efficiency #AISolutions #AIrevolution #SpreadsheetInnovation #AIProductivity #DataManagement #DataTransformation #BigData #AIProductivity #DataAnnotation #AIDriven #DataMagic #TaskAutomation #AIformulas #Productivity #AIinsights #SpreadsheetMagic #UnPerplexedSpready #AITech #DataTransformation #AIFuture #DataProcessing #DataEfficiency #Spreadsheets #AItransformation #SpreadsheetSolutions #ErrorReduction #AccuracyMatters #AIDataHelp #FastSolutions #SpreadsheetHelp #NLP #DataEntry #ArtificialIntelligence #Spreadsheets #MachineLearning #DataAnnotation #DataPrep #BigData #DataProcessing #Matasoft #MachineLearning #Ecommerce #HealthTech #Marketing #Software #Innovation #Matasoft #SpreadsheetAutomation #AIpoweredTools #EfficiencyWithAI #ExcelAutomation #GoogleSheetsIntegration

0 notes
Text
Dataprep by Trifacta in a minute
Marketing main landing page → Support article → DataVis DevTalk: Google Data … source
0 notes
Photo

Playmobil surveyor is what I got from my daughter yesterday! So great full she know I love the profession! #survey #takeoff #3dmodeling #surveying #landsurveying #trimble #drafting #surveyinglife #buildingsurveying #lovesurveying #dataprep #earthworks #trimblebusinesscenter #sitemodz #prositeconsulting #surveyworld #geospatial #geodesy #mixedreality #sitemodz #Trimble geospatial #leicageosystems (at Spruce Grove, Alberta) https://www.instagram.com/p/ChH1NSXr-2I/?igshid=NGJjMDIxMWI=
#survey#takeoff#3dmodeling#surveying#landsurveying#trimble#drafting#surveyinglife#buildingsurveying#lovesurveying#dataprep#earthworks#trimblebusinesscenter#sitemodz#prositeconsulting#surveyworld#geospatial#geodesy#mixedreality#leicageosystems
5 notes
·
View notes
Photo
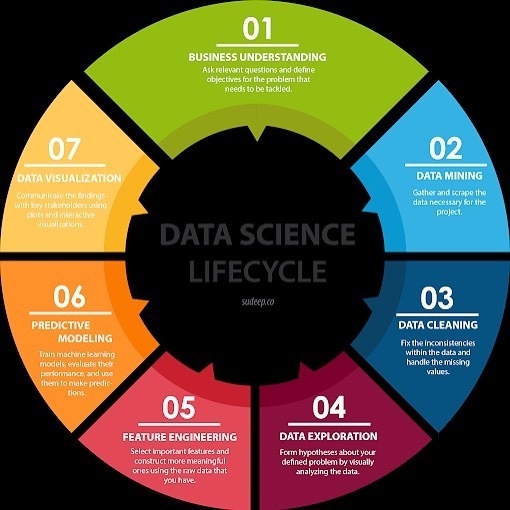
Interesting piece, the #DataScience Lifecycle #infographic, read more at: datastandard.io —————— #BigData #DataScientists #AI #MachineLearning #DataLiteracy #DataMining #DataClearning #DataPrep #FeatureEngineering #PredictiveModeling #DataViz #DataStorytelling #tensorflow #googleai #nvidia #datascience (at Mambo Microsystems Ltd) https://www.instagram.com/p/CAPDnb4BCNr/?igshid=67fhyew7nrmd
#datascience#infographic#bigdata#datascientists#ai#machinelearning#dataliteracy#datamining#dataclearning#dataprep#featureengineering#predictivemodeling#dataviz#datastorytelling#tensorflow#googleai#nvidia
0 notes
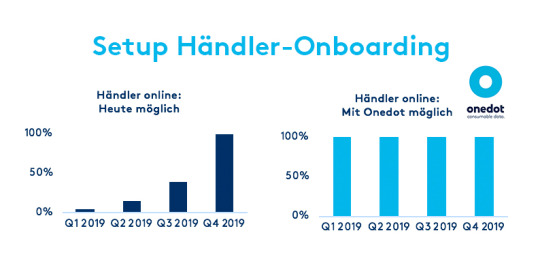
Link
Doppelt so viele Händler und Produkte online nehmen. Onedot hilft beim Onboarding. Erfahren Sie mehr.
#onedot#consumabledata#ai#artificialintelligence#ml#dataprep#pdm#pim#erp#produktdaten#zukunft#datacleaning
0 notes