#loop 2.4.3
Explore tagged Tumblr posts
Visit Tumblr Blog
Explore Tumblr blogs with no restrictions, modern design and the best experience.
Last Seen Tumblr Blogs


Fun Fact
Tumblr has been providing a Korean-language service since 2013.
Text
Firealpaca update 2.5 (May 11th) + prev updates
The next big update! this came out this Tuesday. This improves a few things in FA and fixes a common bug (window settings being reset)
FireAlpaca Ver 2.5.0(2021/05/11)
Added support for UI display in high dpi environments (Windows)
Improved response to multi-touch operations (Windows)
Fixed a bug in saving and loading window positions (conventional window settings will be reset once).
Dramatically accelerated overwriting and saving of MDP files.
Added a setting to prevent infinite loop when outputting animated GIFs and APNGs.
There's also a few other improvements of note from previous updates worth mentioning (as usual, full update log at https://firealpaca.com/download/#history)
[2.4.6]
Textures can now be applied to bitmaps and scatter brushes.
Improved the interpolation shape of brush strokes.
[2.4.5]
Improved the brush processing bug.
Improved processing when changing canvas resolution.
When cropping or changing the resolution of the canvas, the brush snap coordinates are now also linked.
[2.4.3]
Added debug output function to brush script editor.
12 notes
·
View notes
Text
Dmg canvas serial

#Dmg canvas serial how to#
#Dmg canvas serial code#
#Dmg canvas serial license#
#Dmg canvas serial download#
#Dmg canvas serial free#
Release notes were unavailable when this listing was updated.
#Dmg canvas serial download#
Reallusion crazytalk animator pipeline 3 3 3007 1 freeload. Apple strongly recommends using disk images to ship applications, so developers should take note!
#Dmg canvas serial code#
DMG Canvas also supports code signing disk images, so developers can be prepared for changes to Gatekeeper, particular Launch Path Randomization. Your disk images will be bold and beautiful. DMG Canvas supports Retina displays on OS X 10.7 or later. DMG Canvas creates disk images that work seamlessly on any version of OS X. Just drop in images, add customized text, and you're done. With DMG Canvas, creating backgrounds is easy. Setting up your image You then drag, from the Finder into the preview window, the files you want included on the disc. Your disk image will appear in Finder exactly as you designed it. DMG Canvas shows you a live preview of what your opened window will look like. Choose your files, create your background image using helpful controls, and click 'Build'. You can create numerous projects, from printable forms to PDFs, invoices, flyers and infographics, and even websites.
#Dmg canvas serial free#
Canva free version is a full-featured design tool for those who need to get started and don’t have much design experience. Make a selection your information, create your background symbol the use of useful controls, and click on 'Build'. DMG Canvas is helping you organize the content material and look of disk symbol information the use of useful templates. DMG Canvas 2.4.3 – Create custom disk images. ・Invisible files in the mounted disk image (., etc) are now moved out of view so they do not visibily. What's New in Version 2.3.3: ・DMG Canvas now checks for case-insensitive file name conflicts, points out which specific files are conflicting, and advises for them to be renamed to resolve the conflict. DMG Canvas helps you manage the content and appearance of disk image files using helpful templates. DMG Canvas 2.4 – Create custom disk images. Create Retina-Ready Designs When targeting OS X Lion and later, add beautifully crisp Retina images and text to your disk images. MacOS 10.12 or later 64-bit DOWNLOAD uploadgig.DMG Canvas goes the extra mile and carefully creates disk images with maximum compatibility so they look and work great all the way back to OS X 10.4, regardless of which version of OS X you're using.
#Dmg canvas serial license#
Simply drag and drop your files into place, add text, images, and change the background image for the mounted window, and you can even add stylized license agreements to your disk images, which believe us is a massive pain otherwise. Just drop in images, add customized text, and you're done. DMG Canvas lets you create and build disk images using the slick designer. Disk images, delivered with style - Simplified design.Disk images, delivered with style – Simplified design. Your disk image will appear in Finder exactly as you designed it. Choose your files, create your background image using helpful controls, and click “Build”. DMG Canvas helps you manage the content and appearance of disk image files using helpful templates.Clone/Copy EVERYTHING including Windows from old hard drive to a new one step by step (Easy way) - Duration: 16:09.Indie Pop Guitar 1 contains 31 elaborated guitar kits. The key point for you is that it has the ability to let you create the bootable image directly without any issue in the future. FANTASTiC 16 October 2020 700 MB If you're looking for cutting-edge indie pop guitar loops, this sample loop library is made for you and surpasses all other guitar products on the market. UUbyte DMG Editor Crack+ Download X64 2022 DMS to DD Converter is able to convert the ISO, RPI-SDIMG and DMG image into the DD image file which can be used to restore your Mac.Dmg Canvas Stylized Disk Images Made Easy V3 0 4 Download If you are creating your own disk image for Mac, you.
#Dmg canvas serial how to#
Download DMG Canvas and choose how to present your installation. DMG Canvas is a simple, easy to use application for customizing setup windows for Mac. 8/10 (5 votes) - Download DMG Canvas Mac Free.
0 notes
Text
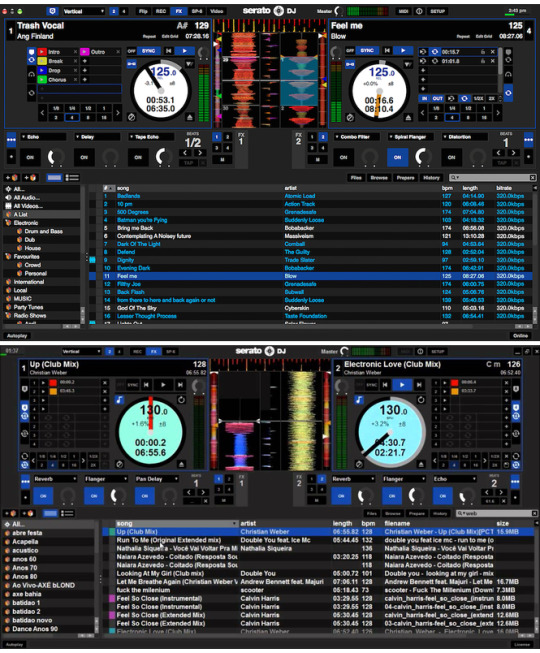
Serato Scratch Live Torrent

Scratch Live 2.3.3 (Legacy)
Serato Scratch Live Download Mac
WHAT'S NEW?
If you are using a Rane Sixty-One or Sixty-Two, please download Scratch Live for Rane Sixty-One and Sixty-Two.
Serato Torrent
Added in 2.3.3
2.3.3 is a maintenance release containing many bug fixes, read the release notes for details.
Scratch Live 2.3.3 includes a large rewrite of all MPEG-4 file reading and writing of meta data (tagging data). This includes .mp4, .m4a, .aac and many .mov files. One of these changes involves writing Serato meta data to files in a different way than previous versions of Scratch Live.
Serato Scratch Live 2.5 Download
When playing one of the affected audio files in Scratch Live 2.3.3 for the first time, all existing Serato meta data will need to saved in the new format. Consequently there will be a lot of writing to file, as signified in the status bar.
Scratch Live 2.3.3 will not delete meta data created in previous versions of Scratch Live, however, new meta data created in Scratch Live 2.3.3 will not be able to be read in older versions. Such meta data includes cues, loops etc.
Sep 25, 2012 Serato’s newsletter announcing the upgrades today. In a slew of announcements, Serato today revealed updates to all of its software (apart from the entry-level Serato DJ Intro program). Serato Video 1.1 is the biggest news, with a host of new power features, while Serato ITCH 2.2.2 and Serato Scratch Live 2.4.3 get incremental updates plus compatibility with the new features of Serato Video 1.1. Interoperable with Scratch Live, ITCH, DJ Intro, and iTunes Music Libraries. Serato DJ is concede winning, progressed DJ programming used by specialists over the globe. Serato DJ Pro 2.3.3 Crack is fantastic programming that incorporates all things required to blend and record music like a professional. Garageband download windows vista.
Added in 2.3.0
Cue Point Labels
64-bit drivers for Mac
Better software THRU mode indication for the SL 2, SL 3 and SL 4
Core Audio/ASIO drivers for the SL 3 and Sixty-Eight
Improved Scratch Live user interface layout for minimum screen resolutions
Added native support for the Pioneer CDJ-350
Added native support for the Pioneer CDJ-850
Support for all current Rane Scratch Live hardware (SL 1, SL 2, SL 3, SL 4, TTM 57SL, Sixty-Eight)
Watch the Scratch Live 2.3 Release notes video.
Omnisphere 2 monthly payment. 8 Payments of 59.88 ⚡ Shop Spectrasonics Omnisphere 2 Software Synthesizer only at AMS! Free 2 Day Shipping ⚡ Free Extended Warranty ⚡ Call our Gear Experts at 800-319-9043 for expert advice! Spectrasonics Omnisphere 2.6 Software Omnisphere is the flagship synthesizer of Spectrasonics - an instrument of extraordinary power and versatility. Top Artists all over the world rely on Omnisphere as an essential source of sonic inspiration. Omnisphere 2.6 Features. Creative “Psychoacoustic” sounds from the renowned Spectrasonics sound design team. Sound Lock™ feature gives endless useful variations by locking sound aspects while browsing. Wavetable Synthesis - Each waveform is a Morphing Wavetable. Is Omnisphere 2 worth the $500?? Is there a monthly payment option sorta like Serum has with Splice? Or a student discount? 1 point 2 years ago. No payment plans or student discounts from Spectrasonics. The only way to get it for slightly cheaper is through Guitar Center during sales. Omnisphere 2.6 includes a stunning new “Hardware Library” with over 1,600 new patches created by Eric Persing and the renowned Spectrasonics Sound Development team. Each hardware profile has a corresponding set of sounds in the Hardware Library which were specially designed using that hardware synth as an Omnisphere controller.
Minimum System Requirements
Read the minimum system requirements.
Read the full Scratch Live 2.3.3 release notes.
Making music should be fun, even if you’re making it alone with your Mac. So you can download GarageBand and see how making tracks, sequences, and mixes look and sound like a real band. Looking like a simulator game, this app is quite a tool for composing and arranging your own songs. The core app is free, but you may purchase additional. Here's the way you can.download Garageband for Windows. for free, this method works on Windows 10 hassle free. Install Garageband for PC using this 2020 guide. 6.8 spc.
Latest Version:
TeamViewer Not Working in Windows 10. Windows 10 is running on more than 800 million devices. Recently, I noticed a problem in it: the TeamViewer not working. Many users reported that they can't use it anymore after upgrading systems to Windows 10. There is no connection to partner. The session limit of Teamviewer is reached. Re: Team Viewer NOT Working on Mac Is there a box at the top right of the TeamViewer window for the partner ID? If you don't have the TeamViewer window open, right click the TeamViewer icon on your Doc and select TeamViewer. Teamviewer pc to mac not working windows 7. Feb 13, 2019 Having the same problem on my on my Mac even after following the directions for How to control a Mac running macOS 10.14 Mojave on both apple computers one running MAC OS 14 and one running MacOS 10.13. Team Viewer is the same Version on both computers. Also added Teamview to the Firewall Settings still no keyboard and mouse on remote computer.
Serato DJ Pro 2.3.4 LATEST
Requirements:
macOS 10.13 High Sierra or later
Author / Product:
Serato / Serato DJ Pro for Mac
Old Versions:
Filename:
Serato DJ Pro 2.3.4.pkg
MD5 Checksum:
7f78cd49a798cb98aec243369cacff87
Details:
Serato DJ Pro for Mac 2020 full offline installer setup for Mac
Serato Dj Scratch Live
Serato DJ Pro for Mac delivers all the features and performance to meet the demands of DJs at the top of their game and sets the new standard for controller DJs. Load and customize your choice of high quality FX powered by iZotope including: Delay, Echo, Ping Pong Delay, Reverb, Phaser, Flanger, Distortion, HPF, LPF and a Combo HPF/LPF. Adjust and customize a range of parameters for each effect to shape your sound. Lock your tracks together for seamless grooves. Smart Sync with Beatgrids gives you even more time to get creative. 4 deck mixing has never been better with the ability to create your own special blends of tracks, instrumentals and vocals without the pressure of keeping everything in time too. Less time making it work, more time at the party. Interoperable with Scratch Live, ITCH, DJ Intro and iTunes Music Libraries. Serato DJ for macOS is award winning, digital DJing software used by professionals across the globe. Features and Highlights Virtual decks All the important track information you need is displayed on famous virtual decks. Get live BPM and track time information as well as visual representation of upcoming cue points and playhead position while scratching. Colored waveforms Visualize your tracks with unique EQ colored waveforms. Red for bass, blue for treble and green for mid-range. Never miss an incoming vocal or bass drop. Keep your tracks in time with a simple beat matching display next to waveforms. Full DVS support Use club standard setups with Serato Control Vinyl or CDs for the perfect emulation of real feel DJing. For turntablists there is the unique sticker lock feature to keep your routines super tight. Recording + SP6 Record your full sets in customizable high quality formats, ready to share with your followers online. Trigger DJ stings, loops, acapellas, drops and whole tracks from the SP-6 sample player. Keep up to 24 samples loaded across 4 banks and sync them with your playing tracks. Midi support Add ready-mapped official accessories to your setup. Alternatively connect any MIDI device, or remap your primary device however you like to personalize your performances and increase your productivity. Powerful FX A huge array of customizable DJ FX powered by industry leaders iZotope. From the DJ necessities of Filters, Echoes, and Delays to complex and creative noise synths, dubbed out tape echoes and retro 8-bit audio bending FX. Note: 14-day trial period. Serato DJ is now Serato DJ Pro, a free upgrade for existing DJ users. All supported hardware works too. Also Available: Download Serato DJ Pro for Windows
0 notes
Text
Global Lyocell Fiber Market Size, Manufacturers, Supply Chain, Sales Channel and Clients, 2021-2027
Lyocell, derived from cellulose, is known as a man-made fiber. It is popularly known by the brand name ?Tencel.? Lyocell, a type of rayon fiber, is manufactured in a closed-loop method through a solvent spinning technique, wherein the cellulose undergoes a limited chemical change. Lyocell fibers are widely used in the textile industry in a broad range of apparels and home textiles. These fibers are also used in the medical industry in the production of medical equipment and surgical products.
Global Lyocell Fiber key players include Lenzing, Hi-Tech Fiber, etc. Global top two manufacturers hold a share over 85%.
Europe is the largest market, with a share about 65%, followed by China, and North America, both have a share about 35 percent.
Download FREE Sample of this Report @ https://www.grandresearchstore.com/report-sample/global-lyocell-fiber-2021-2027-184
In terms of product, Regular Lyocell Fiber is the largest segment, with a share about 65%. And in terms of application, the largest application is Apparels, followed by Home Textiles, Nonwoven, etc.
Market Analysis and Insights: Global Lyocell Fiber Market
In 2020, the global Lyocell Fiber market size was US$ 599 million and it is expected to reach US$ 893.5 million by the end of 2027, with a CAGR of 5.8% during 2021-2027.
Global Lyocell Fiber Scope and Market Size
Lyocell Fiber market is segmented by region, by country, company, type, application and by sales channels. Players, stakeholders, and other participants in the global Lyocell Fiber market will be able to gain the upper hand as they use the report as a powerful resource. The segmental analysis focuses on sales, revenue and forecast by region, by country, company, type, application and by sales channels for the period 2016-2027.
Segment by Type, the Lyocell Fiber market is segmented into
Regular Lyocell Fiber
Crosslinked Lyocell Fiber
Segment by Application, the Lyocell Fiber market is segmented into
Apparels
Home Textiles
Nonwoven
Others
Regional and Country-level Analysis:
North America
United States
Canada
Asia-Pacific
China
Japan
South Korea
India
Southeast Asia
Australia
Rest of Asia-Pacific
Europe
Germany
France
U.K.
Italy
Russia
Nordic Countries
Rest of Europe
Latin America
Mexico
Brazil
Rest of Latin America
Middle East & Africa
Turkey
Saudi Arabia
UAE
Rest of MEA
Competitive Landscape and Lyocell Fiber Market Share Analysis
Lyocell Fiber market competitive landscape provides details and data information by companies. The report offers comprehensive analysis and accurate statistics on revenue by the player for the period 2016-2021. It also offers detailed analysis supported by reliable statistics on sale and revenue by players for the period 2016-2021. Details included are company description, major business, Lyocell Fiber product introduction, recent developments, Lyocell Fiber sales by region, type, application and by sales channel.
The major companies include:
Lenzing
Hi-Tech Fiber
Shangtex Holding
Get the Complete Report & TOC @ https://www.grandresearchstore.com/chemicals-and-materials/global-lyocell-fiber-2021-2027-184
Table of content
1 Study Coverage 1.1 Lyocell Fiber Product Introduction 1.2 Market by Type 1.2.1 Global Lyocell Fiber Market Size Growth Rate by Type 1.2.2 Regular Lyocell Fiber 1.2.3 Crosslinked Lyocell Fiber 1.3 Market by Application 1.3.1 Global Lyocell Fiber Market Size Growth Rate by Application 1.3.2 Apparels 1.3.3 Home Textiles 1.3.4 Nonwoven 1.3.5 Others 1.4 Study Objectives 1.5 Years Considered 2 Executive Summary 2.1 Global Lyocell Fiber Market Size Estimates and Forecasts 2.1.1 Global Lyocell Fiber Revenue 2016-2027 2.1.2 Global Lyocell Fiber Sales 2016-2027 2.2 Lyocell Fiber Market Size by Region: 2021 Versus 2027 2.3 Lyocell Fiber Sales by Region (2016-2027) 2.3.1 Global Lyocell Fiber Sales by Region: 2016-2021 2.3.2 Global Lyocell Fiber Sales Forecast by Region (2022-2027) 2.3.3 Global Lyocell Fiber Sales Market Share by Region (2016-2027) 2.4 Lyocell Fiber Market Estimates and Projections by Region (2022-2027) 2.4.1 Global Lyocell Fiber Revenue by Region: 2016-2021 2.4.2 Global Lyocell Fiber Revenue Forecast by Region (2022-2027) 2.4.3 Global Lyocell Fiber Revenue Market Share by Region (2016-2027) 3 Global Lyocell Fiber by Manufacturers 3.1 Global Top Lyocell Fiber Manufacturers by Sales 3.1.1 Global Lyocell Fiber Sales by Manufacturer (2016-2021) 3.1.2 Global L
CONTACT US: 276 5th Avenue, New York , NY 10001,United States International: (+1) 646 781 7170 / +91 8087042414 Email: [email protected] Follow Us On linkedin :- https://www.linkedin.com/company/grand-research-store/
0 notes
Link
The Packet Transport Network (PTN) Equipment market report provides a detailed analysis of global market size, regional and country-level market size, segmentation market growth, market share, competitive Landscape, sales analysis, impact of domestic and global market players, value chain optimization, trade regulations, recent developments, opportunities analysis, strategic market growth analysis, product launches, area marketplace expanding, and technological innovations.
Market segmentation Packet Transport Network (PTN) Equipment market is split by Type and by Application. For the period 2016-2026, the growth among segments provide accurate calculations and forecasts for sales by Type and by Application in terms of volume and value. This analysis can help you expand your business by targeting qualified niche markets.
GET FREE SAMPLE PDF:https://www.wiseguyreports.com/sample-request/7285225-global-packet-transport-network-ptn-equipment-market-2021
Market segment by Type, covers Large-scaled Midium-scaled Small-scaled Ultra Small-scaled
Market segment by Application can be divided into Metropolitan Area Network Enterprise Others
The key market players for global Packet Transport Network (PTN) Equipment market are listed below: HUAWEI Cisco Nokia ZTE Fiber Home Belden(Hirschmann) WooriNet Loop Telecom Wuhan Yinkom Telecommunication Technologies Co., Ltd.
REPORT DETAILS:https://www.wiseguyreports.com/reports/7285225-global-packet-transport-network-ptn-equipment-market-2021
Market segment by Region, regional analysis covers North America (United States, Canada and Mexico) Europe (Germany, France, United Kingdom, Russia, Italy, and Rest of Europe) Asia-Pacific (China, Japan, Korea, India, Southeast Asia, and Australia) South America (Brazil, Argentina, Colombia, and Rest of South America) Middle East & Africa (Saudi Arabia, UAE, Egypt, South Africa, and Rest of Middle East & Africa)
The content of the study subjects, includes a total of 14 chapters: Chapter 1, to describe Packet Transport Network (PTN) Equipment product scope, market overview, market opportunities, market driving force and market risks. Chapter 2, to profile the top manufacturers of Packet Transport Network (PTN) Equipment, with price, sales, revenue and global market share of Packet Transport Network (PTN) Equipment from 2019 to 2021. Chapter 3, the Packet Transport Network (PTN) Equipment competitive situation, sales, revenue and global market share of top manufacturers are analyzed emphatically by landscape contrast. Chapter 4, the Packet Transport Network (PTN) Equipment breakdown data are shown at the regional level, to show the sales, revenue and growth by regions, from 2016 to 2026. Chapter 5 and 6, to segment the sales by type and application, with sales market share and growth rate by type, application, from 2016 to 2026. Chapter 7, 8, 9, 10 and 11, to break the sales data at the country level, with sales, revenue and market share for key countries in the world, from 2016 to 2021.and Packet Transport Network (PTN) Equipment market forecast, by regions, type and application, with sales and revenue, from 2021 to 2026. Chapter 12, 13 and 14, to describe Packet Transport Network (PTN) Equipment sales channel, distributors, customers, research findings and conclusion, appendix and data source.
TABLE OF CONTENTS
1 Market Overview 1.1 Packet Transport Network (PTN) Equipment Introduction 1.2 Market Analysis by Type 1.2.1 Overview: Global Packet Transport Network (PTN) Equipment Revenue by Type: 2019 Versus 2021 Versus 2026 1.2.2 Large-scaled 1.2.3 Midium-scaled 1.2.4 Small-scaled 1.2.5 Ultra Small-scaled 1.3 Market Analysis by Application 1.3.1 Overview: Global Packet Transport Network (PTN) Equipment Revenue by Application: 2019 Versus 2021 Versus 2026 1.3.2 Metropolitan Area Network 1.3.3 Enterprise 1.3.4 Others 1.4 Global Packet Transport Network (PTN) Equipment Market Size & Forecast 1.4.1 Global Packet Transport Network (PTN) Equipment Sales in Value (2016-2026)) 1.4.2 Global Packet Transport Network (PTN) Equipment Sales in Volume (2016-2026) 1.4.3 Global Packet Transport Network (PTN) Equipment Price by Type (2016-2026) & (US$/Unit) 1.5 Global Packet Transport Network (PTN) Equipment Production Capacity Analysis 1.5.1 Global Packet Transport Network (PTN) Equipment Total Production Capacity (2016-2026) 1.5.2 Global Packet Transport Network (PTN) Equipment Production Capacity by Geographic Region 1.6 Market Drivers, Restraints and Trends 1.6.1 Packet Transport Network (PTN) Equipment Market Drivers 1.6.2 Packet Transport Network (PTN) Equipment Market Restraints 1.6.3 Packet Transport Network (PTN) Equipment Trends Analysis 2 Manufacturers Profiles 2.1 HUAWEI 2.1.1 HUAWEI Details 2.1.2 HUAWEI Major Business 2.1.3 HUAWEI Packet Transport Network (PTN) Equipment Product and Services 2.1.4 HUAWEI Packet Transport Network (PTN) Equipment Sales, Price, Revenue, Gross Margin and Market Share (2019-2021) 2.2 Cisco 2.2.1 Cisco Details 2.2.2 Cisco Major Business 2.2.3 Cisco Packet Transport Network (PTN) Equipment Product and Services 2.2.4 Cisco Packet Transport Network (PTN) Equipment Sales, Price, Revenue, Gross Margin and Market Share (2019-2021) 2.3 Nokia 2.3.1 Nokia Details 2.3.2 Nokia Major Business 2.3.3 Nokia Packet Transport Network (PTN) Equipment Product and Services 2.3.4 Nokia Packet Transport Network (PTN) Equipment Sales, Price, Revenue, Gross Margin and Market Share (2019-2021) 2.4 ZTE 2.4.1 ZTE Details 2.4.2 ZTE Major Business 2.4.3 ZTE Packet Transport Network (PTN) Equipment Product and Services 2.4.4 ZTE Packet Transport Network (PTN) Equipment Sales, Price, Revenue, Gross Margin and Market Share (2019-2021) 2.5 Fiber Home 2.5.1 Fiber Home Details 2.5.2 Fiber Home Major Business 2.5.3 Fiber Home Packet Transport Network (PTN) Equipment Product and Services 2.5.4 Fiber Home Packet Transport Network (PTN) Equipment Sales, Price, Revenue, Gross Margin and Market Share (2019-2021) 2.6 Belden(Hirschmann) 2.6.1 Belden(Hirschmann) Details 2.6.2 Belden(Hirschmann) Major Business 2.6.3 Belden(Hirschmann) Packet Transport Network (PTN) Equipment Product and Services 2.6.4 Belden(Hirschmann) Packet Transport Network (PTN) Equipment Sales, Price, Revenue, Gross Margin and Market Share (2019-2021) 2.7 WooriNet 2.7.1 WooriNet Details 2.7.2 WooriNet Major Business 2.7.3 WooriNet Packet Transport Network (PTN) Equipment Product and Services 2.7.4 WooriNet Packet Transport Network (PTN) Equipment Sales, Price, Revenue, Gross Margin and Market Share (2019-2021) 2.8 Loop Telecom 2.8.1 Loop Telecom Details 2.8.2 Loop Telecom Major Business 2.8.3 Loop Telecom Packet Transport Network (PTN) Equipment Product and Services 2.8.4 Loop Telecom Packet Transport Network (PTN) Equipment Sales, Price, Revenue, Gross Margin and Market Share (2019-2021) 2.9 Wuhan Yinkom Telecommunication Technologies Co., Ltd. 2.9.1 Wuhan Yinkom Telecommunication Technologies Co., Ltd. Details 2.9.2 Wuhan Yinkom Telecommunication Technologies Co., Ltd. Major Business 2.9.3 Wuhan Yinkom Telecommunication Technologies Co., Ltd. Packet Transport Network (PTN) Equipment Product and Services 2.9.4 Wuhan Yinkom Telecommunication Technologies Co., Ltd. Packet Transport Network (PTN) Equipment Sales, Price, Revenue, Gross Margin and Market Share (2019-2021) 3 Packet Transport Network (PTN) Equipment Sales by Manufacturer 3.1 Global Packet Transport Network (PTN) Equipment Sales in Volume by Manufacturer (2019-2021e) 3.2 Global Packet Transport Network (PTN) Equipment Revenue by Manufacturer (2019-2021e) 3.3 Key Manufacturer Market Position in Packet Transport Network (PTN) Equipment 3.4 Market Concentration Rate 3.4.1 Top 3 Packet Transport Network (PTN) Equipment Manufacturer Market Share 3.4.2 Top 6 Packet Transport Network (PTN) Equipment Manufacturer Market Share 3.5 Global Packet Transport Network (PTN) Equipment Production Capacity by Company
..... continued
CONTACT DETAILS:
+44 203 500 2763
+1 62 825 80070
971 0503084105
0 notes
Photo

Loop 2.4.3 with @colleenclarkmusic. Projected images by Catherine Rutgers.
1 note
·
View note
Text
Process Automation and Instrumentation Market Report 2020: By manufacturers, Type & Applications, Global status and Industry Forecast by 2023
Process Automation and Instrumentation Industry
Description
Global Process Automation and Instrumentation market is expected to grow from $60.12 billion in 2017 to reach $105.94 billion by 2026 with a CAGR of 6.5%. Increased adoption of process automation and instrumentation products across industries, rising oil and refineries industry, shifting production approach from conventional practices to digitalized methods, adoption of multivendor portable applications, growing regulatory compliances in process industries, increased usage and application of MES, PLC, SCADA, and DCS, in process industries, rising adoption of IoT across industries and increasing labor wages in major manufacturing hubs are some of the major factors boosting the market growth. On the other hand, high instrument failure rates, high implementation and maintenance costs are the restraints limiting the market growth.
By instrument, control valves segment is expected to witness higher CAGR during the forecast period due to its significance in control loop. Distributed control system (DCS) segment was the dominant solution in process automation and instrumentation market as these systems are widely used in process industries as an extension of conventional controllers. Distributed control system (DCS) solutions are widely used in oil & gas, energy & power, packaging, automotive, pharmaceutical, chemical, food and beverages, and pulp and paper industries.
In 2017, the oil and gas industry dominated the Process Automation and Instrumentation market as there is always huge demand for safety and reliability from exploration through delivery. Whereas, the market share of the energy & power segment is estimated to improve significantly over forecast period due to growing need for cleaner and smarter energy and high demand for non-renewable sources of energy production.
North America accounted for the largest share in global process automation and instrumentation market followed by Europe. The dominance of this region is due to increased industrial automation adoption rates in various end-user industries such as oil & gas, chemicals, petrochemicals and pharmaceuticals. Asia Pacific is expected to witness high growth during the forecast period due to rapid industrialization. Emerging economies such as India and China, on the other hand, are expected to witness rapid penetration in process automation & instrumentation market, owing to the favorable government policies and increasing investments in energy & power sector.
Request for Sample Report @ https://www.wiseguyreports.com/sample-request/3068779-process-automation-and-instrumentation-global-market-outlook-2017-2026
Some of the prominent Process Automation and Instrumentation industry participants include ABB Ltd., Agilent Technologies, Inc., Beckhoff Automation GmbH & Co., Kg, Bosch Group, Danaher Corp, Emerson Electric Co., General Electric Co., Hollysys Automation Technologies Ltd., Honeywell International Inc., Intech Process Automation Inc., Key Innovators, Metso Corporation, Mitsubishi Electric Corporation, Omron, Rockwell Automation, Inc., Schneider Electric Se, Siemens AG, Texas Instruments, Thermo Fisher Scientific Inc. and Yokogawa Electric Corporation.
Types of Processes Covered: • Process Automation • Process Instrumentation
Instruments Covered: • Analyzer • Transmitters • Control Valve
Solutions Covered: • Advanced Process Control (APC) • Distributed Control System (DCS) • Human Machine Interface (HMI) • Manufacturing Execution System (MES) • Programmable Logic Controller (PLC) • Supervisory Control and Data Acquisition (SCADA) • Safety Automation
Communication Protocols Covered: • Wireless Communication Protocol • Wired Communication Protocol
Applications Covered: • Oil & Gas • Food & Beverages • Chemicals • Pharmaceuticals • Water & Wastewater • Metals & Mining • Energy & Power • Pulp & Paper • Other Applications
Regions Covered: • North America o US o Canada o Mexico • Europe o Germany o UK o Italy o France o Spain o Rest of Europe • Asia Pacific o Japan o China o India o Australia o New Zealand o South Korea o Rest of Asia Pacific • South America o Argentina o Brazil o Chile o Rest of South America • Middle East & Africa o Saudi Arabia o UAE o Qatar o South Africa o Rest of Middle East & Africa
Leave a Query @ https://www.wiseguyreports.com/enquiry/3068779-process-automation-and-instrumentation-global-market-outlook-2017-2026
What our report offers: – Market share assessments for the regional and country level segments – Market share analysis of the top industry players – Strategic recommendations for the new entrants – Market forecasts for a minimum of 9 years of all the mentioned segments, sub segments and the regional markets – Market Trends (Drivers, Constraints, Opportunities, Threats, Challenges, Investment Opportunities, and recommendations) – Strategic recommendations in key business segments based on the market estimations – Competitive landscaping mapping the key common trends – Company profiling with detailed strategies, financials, and recent developments – Supply chain trends mapping the latest technological advancements
Table of Content
1 Executive Summary
2 Preface 2.1 Abstract 2.2 Stake Holders 2.3 Research Scope 2.4 Research Methodology 2.4.1 Data Mining 2.4.2 Data Analysis 2.4.3 Data Validation 2.4.4 Research Approach 2.5 Research Sources 2.5.1 Primary Research Sources 2.5.2 Secondary Research Sources 2.5.3 Assumptions
3 Market Trend Analysis 3.1 Introduction 3.2 Drivers 3.3 Restraints 3.4 Opportunities 3.5 Threats 3.6 Application Analysis 3.7 Emerging Markets 3.8 Futuristic Market Scenario
….
11 Key Developments 11.1 Agreements, Partnerships, Collaborations and Joint Ventures 11.2 Acquisitions & Mergers 11.3 New Product Launch 11.4 Expansions 11.5 Other Key Strategies
12 Company Profiling 12.1 ABB Ltd. 12.2 Agilent Technologies, Inc. 12.3 Beckhoff Automation GmbH & Co., Kg 12.4 Bosch Group 12.5 Danaher Corp 12.6 Emerson Electric Co. 12.7 General Electric Co. 12.8 Hollysys Automation Technologies Ltd. 12.9 Honeywell International Inc. 12.10 Intech Process Automation Inc. 12.11 Key Innovators 12.12 Metso Corporation 12.13 Mitsubishi Electric Corporation 12.14 Omron 12.15 Rockwell Automation, Inc. 12.16 Schneider Electric Se 12.17 Siemens AG 12.18 Texas Instruments 12.19 Thermo Fisher Scientific Inc. 12.20 Yokogawa Electric Corporation
Buy Now @ https://www.wiseguyreports.com/checkout?currency=one_user-USD&report_id=3068779
Continued…
Contact Us: [email protected] Ph: +1-646-845-9349 (Us) Ph: +44 208 133 9349 (Uk)
0 notes
Text
Lead Acid Battery Recycling Global Market Demand, Growth, Opportunities, Analysis of Top Key Player and Forecast to 2025
Battery recycling is the reuse and reprocessing activity of spent batteries that aims to reduce the number of spent batteries being disposed of as municipal solid waste or material waste. Batteries contain several toxic chemicals and heavy metals and disposing them off as trash has raised environmental and health concerns over water pollution and soil contamination.
Lead acid batteries are closed-loop recycled, meaning each part the the old batteries is recycled into a new battery. It is estimated that 98% of all lead acid batteries are recycled. Lead acid batteries either start or power cars, trucks, buses, boats, trains, rapid mass-transit systems, recreational vehicles and electric wheelchairs all over the globe. The car battery also provides a stable electrical supply to a vehicle’s electrical system. Lead acid batteries power electric fork trucks used in warehouses, factories, mines, and ships. They also power the shuttle vehicles in airports, as well as wheelchairs, amusement park shuttles and golf carts. On the road, lead acid batteries power electric law-enforcement vehicles, buses, and very soon mail delivery vans.
According to this study, over the next five years the Lead Acid Battery Recycling market will register a xx% CAGR in terms of revenue, the global market size will reach US$ xx million by 2024, from US$ xx million in 2019. In particular, this report presents the global revenue market share of key companies in Lead Acid Battery Recycling business, shared in Chapter 3.
Request a Free Sample Report @ https://www.wiseguyreports.com/sample-request/4014424-global-lead-acid-battery-recycling-market-growth-status-and-outlook-2019-2024
This report presents a comprehensive overview, market shares and growth opportunities of Lead Acid Battery Recycling market by product type, application, key companies and key regions.
This study considers the Lead Acid Battery Recycling value generated from the sales of the following segments:
Segmentation by product type: breakdown data from 2014 to 2019 in Section 2.3; and forecast to 2024 in section 10.7. VRLA Lead Acid Battery Flooded Lead Acid Battery Segmentation by application: breakdown data from 2014 to 2019, in Section 2.4; and forecast to 2024 in section 10.8. Automotive Utilities Construction Telecom Marine UPS Others
This report also splits the market by region: Breakdown data in Chapter 4, 5, 6, 7 and 8. Americas United States Canada Mexico Brazil APAC China Japan Korea Southeast Asia India Australia Europe Germany France UK Italy Russia Spain Middle East & Africa Egypt South Africa Israel Turkey GCC Countries
The report also presents the market competition landscape and a corresponding detailed analysis of the major vendor/manufacturers in the market. The key manufacturers covered in this report: Breakdown data in in Chapter 3. Battery Solutions Call2Recyle Exide Technologies Gravita Group Johnson Controls EnerSys Aqua Metals ECOBAT Technologies Umicore SUNLIGHT Recycling HydroMet Retriev Technologies Campine Gopher Resource G&P Batteries Terrapure Environmental East Penn Manufacturing RSR Corporation INMETCO (American Zinc Recycling) Cleanlites Recycling RILTA Environmental C&D Technologies
Table of Contents
2019-2024 Global Lead Acid Battery Recycling Market Report (Status and Outlook)
1 Scope of the Report 1.1 Market Introduction 1.2 Research Objectives 1.3 Years Considered 1.4 Market Research Methodology 1.5 Economic Indicators 1.6 Currency Considered
2 Executive Summary 2.1 World Market Overview 2.1.1 Global Lead Acid Battery Recycling Market Size 2014-2024 2.1.2 Lead Acid Battery Recycling Market Size CAGR by Region 2.2 Lead Acid Battery Recycling Segment by Type 2.2.1 VRLA Lead Acid Battery 2.2.2 Flooded Lead Acid Battery 2.2.3 Other 2.3 Lead Acid Battery Recycling Market Size by Type 2.3.1 Global Lead Acid Battery Recycling Market Size Market Share by Type (2014-2019) 2.3.2 Global Lead Acid Battery Recycling Market Size Growth Rate by Type (2014-2019) 2.4 Lead Acid Battery Recycling Segment by Application 2.4.1 Automotive 2.4.2 Utilities 2.4.3 Construction 2.4.4 Telecom 2.4.5 Marine 2.4.6 UPS 2.4.7 Others 2.5 Lead Acid Battery Recycling Market Size by Application 2.5.1 Global Lead Acid Battery Recycling Market Size Market Share by Application (2014-2019) 2.5.2 Global Lead Acid Battery Recycling Market Size Growth Rate by Application (2014-2019)
3 Global Lead Acid Battery Recycling by Players 3.1 Global Lead Acid Battery Recycling Market Size Market Share by Players 3.1.1 Global Lead Acid Battery Recycling Market Size by Players (2017-2019) 3.1.2 Global Lead Acid Battery Recycling Market Size Market Share by Players (2017-2019) 3.2 Global Lead Acid Battery Recycling Key Players Head office and Products Offered 3.3 Market Concentration Rate Analysis 3.3.1 Competition Landscape Analysis 3.3.2 Concentration Ratio (CR3, CR5 and CR10) (2017-2019) 3.4 New Products and Potential Entrants 3.5 Mergers & Acquisitions, Expansion
4 Lead Acid Battery Recycling by Regions 4.1 Lead Acid Battery Recycling Market Size by Regions 4.2 Americas Lead Acid Battery Recycling Market Size Growth 4.3 APAC Lead Acid Battery Recycling Market Size Growth 4.4 Europe Lead Acid Battery Recycling Market Size Growth 4.5 Middle East & Africa Lead Acid Battery Recycling Market Size Growth
5 Americas 5.1 Americas Lead Acid Battery Recycling Market Size by Countries 5.2 Americas Lead Acid Battery Recycling Market Size by Type 5.3 Americas Lead Acid Battery Recycling Market Size by Application 5.4 United States 5.5 Canada 5.6 Mexico 5.7 Key Economic Indicators of Few Americas Countries
6 APAC 6.1 APAC Lead Acid Battery Recycling Market Size by Countries 6.2 APAC Lead Acid Battery Recycling Market Size by Type 6.3 APAC Lead Acid Battery Recycling Market Size by Application 6.4 China 6.5 Japan 6.6 Korea 6.7 Southeast Asia 6.8 India 6.9 Australia 6.10 Key Economic Indicators of Few APAC Countries
……Continued
Access Complete Report @ https://www.wiseguyreports.com/reports/4014424-global-lead-acid-battery-recycling-market-growth-status-and-outlook-2019-2024
Contact Us:
Norah Trent
Partner Relations & Marketing Manager
Ph: +1 (339) 368 6938 (US)
Ph: +44 208 133 9349 (UK)
0 notes
Text
Global Hybrid Stepper Motors Market Size, Manufacturers, Supply Chain, Sales Channel and Clients, 2021-2027
A stepper motor or step motor or stepping motor is a brushless DC electric motor that divides a full rotation into a number of equal steps. The motor's position can then be commanded to move and hold at one of these steps without any position sensor for feedback (an open-loop controller), as long as the motor is carefully sized to the application in respect to torque and speed. Stepper motors are available in three basic types; which are permanent magnet, variable reluctance and hybrid.
Hybrid stepper motors combine aspects of both permanent magnet (PM) and variable reluctance (VR) stepper motors. Like PM motors, they contain a permanent magnet in the rotor teeth. Two sets of teeth called cups ring the rotor. One ring is all south poles, and the other ring is all north poles.
Global Hybrid Stepper Motors key players include Shinano Kenshi, MinebeaMitsumi, Moons', Nidec Servo, etc. Global top four manufacturers hold a share over 70%.
Download FREE Sample of this Report @ https://www.grandresearchstore.com/report-sample/global-hybrid-stepper-motors-2021-2027-68
China is the largest market, with a share over 30%, followed by Japan, and Southeast Asia, both have a share about 40 percent.
In terms of product, 2-phase is the largest segment, with a share over 85%. And in terms of application, the largest application is Office Equipment, followed by Telecommunication Equipment, Industrial Automation, Security Equipment, etc.
Market Analysis and Insights: Global Hybrid Stepper Motors Market
In 2020, the global Hybrid Stepper Motors market size was US$ 1024 million and it is expected to reach US$ 1431.2 million by the end of 2027, with a CAGR of 5.0% during 2021-2027.
Global Hybrid Stepper Motors Scope and Market Size
Hybrid Stepper Motors market is segmented by region, by country, company, type, application and by sales channels. Players, stakeholders, and other participants in the global Hybrid Stepper Motors market will be able to gain the upper hand as they use the report as a powerful resource. The segmental analysis focuses on sales, revenue and forecast by region, by country, company, type, application and by sales channels for the period 2016-2027.
Segment by Type, the Hybrid Stepper Motors market is segmented into
2-phase Hybrid Stepper Motors
3-phase Hybrid Stepper Motors
Others
Segment by Application, the Hybrid Stepper Motors market is segmented into
Telecommunication Equipment
Office Equipment
Medical Equipment
Industrial Automation
Security Equipment
Others
Regional and Country-level Analysis:
North America
United States
Canada
Asia-Pacific
China
Japan
South Korea
India
Southeast Asia
Australia
Rest of Asia-Pacific
Europe
Germany
France
U.K.
Italy
Russia
Nordic Countries
Rest of Europe
Latin America
Mexico
Brazil
Rest of Latin America
Middle East & Africa
Turkey
Saudi Arabia
UAE
Rest of MEA
Competitive Landscape and Hybrid Stepper Motors Market Share Analysis
Hybrid Stepper Motors market competitive landscape provides details and data information by companies. The report offers comprehensive analysis and accurate statistics on revenue by the player for the period 2016-2021. It also offers detailed analysis supported by reliable statistics on sale and revenue by players for the period 2016-2021. Details included are company description, major business, Hybrid Stepper Motors product introduction, recent developments, Hybrid Stepper Motors sales by region, type, application and by sales channel.
The major companies include:
Shinano Kenshi
MinebeaMitsumi
Nidec Servo
Moons?
Sanyo Denki
Oriental Motor
Tamagawa Seiki
Fulling Motor
Nippon Pulse Motor
Nanotec
AMETEK
Sonceboz
Phytron
MICROSTEP GmbH
ST?GRA
Get the Complete Report & TOC @ https://www.grandresearchstore.com/machines/global-hybrid-stepper-motors-2021-2027-68
Table of content
1 Study Coverage 1.1 Hybrid Stepper Motors Product Introduction 1.2 Market by Type 1.2.1 Global Hybrid Stepper Motors Market Size Growth Rate by Type 1.2.2 2-phase Hybrid Stepper Motors 1.2.3 3-phase Hybrid Stepper Motors 1.2.4 Others 1.3 Market by Application 1.3.1 Global Hybrid Stepper Motors Market Size Growth Rate by Application 1.3.2 Telecommunication Equipment 1.3.3 Office Equipment 1.3.4 Medical Equipment 1.3.5 Industrial Automation 1.3.6 Security Equipment 1.3.7 Others 1.4 Study Objectives 1.5 Years Considered 2 Executive Summary 2.1 Global Hybrid Stepper Motors Market Size Estimates and Forecasts 2.1.1 Global Hybrid Stepper Motors Revenue 2016-2027 2.1.2 Global Hybrid Stepper Motors Sales 2016-2027 2.2 Hybrid Stepper Motors Market Size by Region: 2021 Versus 2027 2.3 Hybrid Stepper Motors Sales by Region (2016-2027) 2.3.1 Global Hybrid Stepper Motors Sales by Region: 2016-2021 2.3.2 Global Hybrid Stepper Motors Sales Forecast by Region (2022-2027) 2.3.3 Global Hybrid Stepper Motors Sales Market Share by Region (2016-2027) 2.4 Hybrid Stepper Motors Market Estimates and Projections by Region (2022-2027) 2.4.1 Global Hybrid Stepper Motors Revenue by Region: 2016-2021 2.4.2 Global Hybrid Stepper Motors Revenue Forecast by Region (2022-2027) 2.4.3 Global Hy
CONTACT US: 276 5th Avenue, New York , NY 10001,United States International: (+1) 646 781 7170 / +91 8087042414 Email: [email protected] Follow Us On linkedin :- https://www.linkedin.com/company/grand-research-store/
0 notes
Text
Current Transducer EUROPE Market Research Report 2021-2026
A Current Transducer is a device that converts alternating or direct electrical signals into a proportional industrial standard electrical signal. Projected and forecast revenue values are in constant U.S. dollars, unadjusted for inflation. Product values and regional markets are estimated by market analyst, data analyst and people from related industry, based on companys' revenue and applications market respectively."
ALSO READ: http://www.marketwatch.com/story/current-transducer-market-research-report-with-size-share-value-cagr-outlook-analysis-latest-updates-data-and-2021-2030-2021-07-16
The report demonstrates detail coverage of Current Transducer industry and main market trends. The data sources include but not limited to reports of companys,international organizations and governments, MMI market surveys,and related industry news. The market research includes historical and forecast data from like demand, application details, price trends, and company shares of the leading Current Transducer by geography, especially focuses on the key regions like United States, European Union, China, and other regions. In addition, the report provides insight into main drivers,challenges,opportunities and risk of the market and strategies of suppliers. Key players are profiled as well with their market shares in the global Current Transducer market discussed. Overall, this report covers the historical situation, present status and the future prospects of the global Current Transducer market for 2016-2026. Moreover,the impact of COVID-19 is also concerned. Since outbreak in December 2019, the COVID-19 virus has spread to over 100 countries and caused huge losses of lives and economy, and the global manufacturing, tourism and financial markets have been hit hard,while the online market increase. Fortunately, with the development of vaccine and other effort by global governments and orgnizations, the nagetive impact of COVID-19 is excepted to subside and the global ecnomy is excepted to recover. Studying and analyzing the impact of Coronavirus COVID-19 on the Current Transducer industry, the report provide in-depth analysis and professtional advices on how to face the post COIVD-19 period.
ALSO READ: http://www.marketwatch.com/story/june-2021-report-on-global-regional-dental-office-lighting-industry-production-sales-and-consumption-status-and-prospects-professional-market-size-share-value-and-competitive-landscape-2021---2026-2021-06-04
Market Segment by Product Type Open Loop Closed Loop
Market Segment by Product Application Industrial Automotive Renewable Residential & Commercial Others
Finally, the report provides detailed profile and data information analysis of leading company. ABB Texas Instrument Veris Industries LEM IME CR Magnetic Johnson Controls Hobut Siemens Phoenix Contact NK Technologies American Aerospace Control (CR) Topstek
ALSO READ: http://www.marketwatch.com/story/june-2021-report-on-global-uv-nail-gel-lamp-industry-supply-and-demand-market-overview-size-share-and-trends-2021-2026-2021-06-08
Report Includes: - xx data tables (appendix tables) - Overview of global Current Transducer market - An detailed key players analysis across regions - Analyses of global market trends, with historical data, estimates for 2021 and projections of compound annual growth rates (CAGRs) through 2026 - Insights into regulatory and environmental developments - Information on the supply and demand scenario and evaluation of technological and investment opportunities in the Current Transducer market - Profiles of major players in the industry, including ABB, Texas Instrument, Veris Industries, LEM, IME.....
Research Objectives 1.To study and analyze the global Current Transducer consumption (value & volume) by key regions/countries, product type and application, history data from 2016 to 2020, and forecast to 2026. 2.To understand the structure of Current Transducer market by identifying its various subsegments. 3.Focuses on the key global Current Transducer manufacturers, to define, describe and analyze the sales volume, value, market share, market competition landscape, Porter's five forces analysis, SWOT analysis and development plans in next few years. 4.To analyze the Current Transducer with respect to individual growth trends, future prospects, and their contribution to the total market. 5.To share detailed information about the key factors influencing the growth of the market (growth potential, opportunities, drivers, industry-specific challenges and risks). 6.To project the consumption of Current Transducer submarkets, with respect to key regions (along with their respective key countries). 7.To analyze competitive developments such as expansions, agreements, new product launches, and acquisitions in the market. 8.To strategically profile the key players and comprehensively analyze their growth strategies.
ALSO READ: http://www.marketwatch.com/story/june-2021-report-o-n-global-worldwide-chemical-fertilizer-markt-size-share-value-and-competi-tive-landsc-ape-2021--20-26-2021-06-09
Table of Contents
Global Current Transducer Professional Survey Report Report 2021, Forecast to 2026
1 Market Study Overview 1.1 Study Objectives 1.2 Current Transducer Introduce 1.3 Combined with the Analysis of Macroeconomic Indicators 1.4 Brief Description of Research Methods 1.5 Market Breakdown and Data Triangulation
2 Global Trend Summary 2.1 Current Transducer Segment by Type 2.1.1 Open Loop 2.1.2 Closed Loop 2.2 Market Analysis by Application 2.2.1 Industrial 2.2.2 Automotive 2.2.3 Renewable 2.2.4 Residential & Commercial 2.2.5 Others 2.3 Global Current Transducer Market Comparison by Regions (2016-2026) 2.3.1 Global Current Transducer Market Size (2016-2026) 2.3.2 North America Current Transducer Status and Prospect (2016-2026) 2.3.3 Europe Current Transducer Status and Prospect (2016-2026) 2.3.4 Asia-pacific Current Transducer Status and Prospect (2016-2026) 2.3.5 South America Current Transducer Status and Prospect (2016-2026) 2.3.6 Middle East & Africa Current Transducer Status and Prospect (2016-2026) 2.4 Basic Product Information 2.4.1 Basic Product Information & Technology Development History 2.4.2 Product Manufacturing Process 2.4.3 Interview with Major Market Participants 2.4.4 High-end Market Analysis and Forecast 2.5 Coronavirus Disease 2019 (Covid-19): Current Transducer Industry Impact 2.5.1 Current Transducer Business Impact Assessment - Covid-19 2.5.2 Market Trends and Current Transducer Potential Opportunities in the COVID-19 Landscape 2.5.3 Measures / Proposal against Covid-19
3 Competition by Manufacturer 3.1 Global Current Transducer Sales and Market Share by Manufacturer (2016-2021) 3.2 Global Current Transducer Revenue and Market Share by Manufacturer (2016-2021) 3.3 Global Current Transducer Industry Concentration Ratio (CR5 and HHI) 3.4 Top 5 Current Transducer Manufacturer Market Share 3.5 Top 10 Current Transducer Manufacturer Market Share 3.6 Date of Key Manufacturers Enter into Current Transducer Market 3.7 Key Manufacturers Current Transducer Product Offered 3.8 Mergers & Acquisitions Planning
ALSO READ: http://www.marketwatch.com/story/june-2021-report-on-global-phoropter-sales-market-overview-size-share-and-trends-2021-2026-2021-06-09
4 Analysis of Current Transducer Industry Key Manufacturers 4.1 ABB 4.1.1 Company Details 4.1.2 ABB Current Transducer Product Introduction, Application and Specification 4.1.3 ABB Current Transducer Sales, Price, Cost, Gross Margin, and Revenue (2016-2021) 4.1.4 Main Business Overview 4.1.5 ABB News 4.2 Texas Instrument 4.2.1 Company Details 4.2.2 Texas Instrument Current Transducer Product Introduction, Application and Specification 4.2.3 Texas Instrument Current Transducer Sales, Price, Cost, Gross Margin, and Revenue (2016-2021) 4.2.4 Main Business Overview 4.2.5 Texas Instrument News 4.3 Veris Industries 4.3.1 Company Details 4.3.2 Veris Industries Current Transducer Product Introduction, Application and Specification 4.3.3 Veris Industries Current Transducer Sales, Price, Cost, Gross Margin, and Revenue (2016-2021) 4.3.4 Main Business Overview 4.3.5 Veris Industries News 4.4 LEM 4.4.1 Company Details 4.4.2 LEM Current Transducer Product Introduction, Application and Specification 4.4.3 LEM Current Transducer Sales, Price, Cost, Gross Margin, and Revenue (2016-2021) 4.4.4 Main Business Overview 4.4.5 LEM News 4.5 IME 4.5.1 Company Details 4.5.2 IME Current Transducer Product Introduction, Application and Specification 4.5.3 IME Current Transducer Sales, Price, Cost, Gross Margin, and Revenue (2016-2021) 4.5.4 Main Business Overview 4.5.5 IME News 4.6 CR Magnetic 4.6.1 Company Details 4.6.2 CR Magnetic Current Transducer Product Introduction, Application and Specification 4.6.3 CR Magnetic Current Transducer Sales, Price, Cost, Gross Margin, and Revenue (2016-2021)
….CONTINUED
CONTACT DETAILS :
+44 203 500 2763
+1 62 825 80070
971 0503084105
0 notes
Photo

May 18, 2018 - Exclusive NYC Event for Sub-Verse, Rachael Elliott, Loop 2.4.3 at ShapeShifter Lab
0 notes
Text
United States Insulin Pump Market Dynamics and Growth Rate 2017-2022
In this report, the United States Insulin Pump market is valued at USD XX million in 2016 and is expected to reach USD XX million by the end of 2022, growing at a CAGR of XX% between 2016 and 2022.
To get exclusive sample copy @ http://www.researchtrades.com/request-sample/1131754
Geographically, this report splits the United States market into seven regions:
The West
Southwest
The Middle Atlantic
New England
The South
The Midwest
with sales (volume), revenue (value), market share and growth rate of Insulin Pump in these regions, from 2012 to 2022 (forecast).
Purchase a copy of this report for single user price of $ 3800 @ http://www.researchtrades.com/checkout/1131754
United States Insulin Pump market competition by top manufacturers/players, with Insulin Pump sales volume, price, revenue (Million USD) and market share for each manufacturer/player; the top players including
Medtronic
Insulet Corporation
Roche
Animas corporation
SOOIL Development
Tandem Diabetes Care
Debiotech
Asante Solutions
Shinmyung Mediyes
……
On the basis of product, this report displays the sales volume, revenue, product price, market share and growth rate of each type, primarily split into
Closed-Loop Insulin Pump
Open-Loop Insulin Pump
On the basis on the end users/applications, this report focuses on the status and outlook for major applications/end users, sales volume, market share and growth rate of Insulin Pump for each application, including
Hospitals
Individuals
Key factors for this report:
1 Insulin Pump Overview
1.1 Product Overview and Scope of Insulin Pump
1.2 Classification of Insulin Pump by Product Category
1.2.1 United States Insulin Pump Market Size (Sales Volume) Comparison by Type (2012-2022)
1.2.2 United States Insulin Pump Market Size (Sales Volume) Market Share by Type (Product Category) in 2016
1.2.3 Closed-Loop Insulin Pump
1.2.4 Open-Loop Insulin Pump
1.3 United States Insulin Pump Market by Application/End Users
1.3.1 United States Insulin Pump Market Size (Consumption) and Market Share Comparison by Application (2012-2022)
1.3.2 Hospitals
1.3.3 Individuals
2 United States Insulin Pump Market Competition by Players/Suppliers
2.1 United States Insulin Pump Sales and Market Share of Key Players/Suppliers (2012-2017)
2.2 United States Insulin Pump Revenue and Share by Players/Suppliers (2012-2017)
2.3 United States Insulin Pump Average Price by Players/Suppliers (2012-2017)
2.4 United States Insulin Pump Market Competitive Situation and Trends
2.4.1 United States Insulin Pump Market Concentration Rate
2.4.2 United States Insulin Pump Market Share of Top 3 and Top 5 Players/Suppliers
2.4.3 Mergers & Acquisitions, Expansion in United States Market
2.5 United States Players/Suppliers Insulin Pump Manufacturing Base Distribution, Sales Area, Product Type
3 United States Insulin Pump Sales (Volume) and Revenue (Value) by Region (2012-2017)
3.1 United States Insulin Pump Sales and Market Share by Region (2012-2017)
3.2 United States Insulin Pump Revenue and Market Share by Region (2012-2017)
3.3 United States Insulin Pump Price by Region (2012-2017)
4 United States Insulin Pump Sales (Volume) and Revenue (Value) by Type (Product Category) (2012-2017)
4.1 United States Insulin Pump Sales and Market Share by Type (Product Category) (2012-2017)
4.2 United States Insulin Pump Revenue and Market Share by Type (2012-2017)
4.3 United States Insulin Pump Price by Type (2012-2017)
4.4 United States Insulin Pump Sales Growth Rate by Type (2012-2017)
View this report @ http://www.researchtrades.com/report/united-states-insulin-pump-market-report-2017/1131754
Who we are
Research Trades has team of experts who works on providing exhaustive analysis pertaining to market research on a global basis. This comprehensive analysis is obtained by a thorough research and study of the ongoing trends and provides predictive data regarding the future estimations, which can be utilized by various organizations for growth purposes.
We distribute customized reports that focus on meeting the client’s specific requirement. Our database consists of a large collection of high-quality reports obtained using a customer-centric approach, thus providing valuable research insights.
Reach at us:
Address: Flat No.10, Wing C, S. No. 245/4/2+245/5/1, Baner, Pune-411045
Email: [email protected]
Call us: +91 7507349866
Skype ID: researchtradescon
Web: http://www.researchtrades.com
0 notes
Link
Prepaid Card
Covered In This Report:
This report studies the Prepaid Card market status and outlook of global and United States, from angles of players, regions, product types and end industries; this report analyzes the top players in global and United States market, and splits the Prepaid Card market by product type and applications/end industries.
The global Prepaid Card market is valued at XX million USD in 2016 and is expected to reach XX million USD by the end of 2022, growing at a CAGR of XX% between 2016 and 2022.
The Asia-Pacific will occupy for more market share in following years, especially in China, also fast growing India and Southeast Asia regions.
North America, especially The United States, will still play an important role which cannot be ignored. Any changes from United States might affect the development trend of Prepaid Card. United States plays an important role in global market, with market size of xx million USD in 2016 and will be xx million USD in 2022, with a CAGR of XX.
Geographically, this report is segmented into several key regions, with sales, revenue, market share (%) and growth Rate (%) of Prepaid Card in these regions, from 2012 to 2022 (forecast), covering United States North America Europe Asia-Pacific South America Middle East and Africa
The major players in global and United States Prepaid Card market, including Visa, MasterCard, UnionPay, American Express, JCB, Discover, Walmart, Bank of America, Apple Inc, Wells Fargo, Paypal, West Union, Kaiku, AccountNow, NetSpend, AT&T, T-Mobil, Verizon,
Get Sample Report @
http://ift.tt/2pqCFbO
The On the basis of product, the Prepaid Card market is primarily split into Open-loop prepaid card Closed-loop prepaid card Reloadable prepaid card Payroll card Government benefit card
On the basis on the end users/applications, this report covers Personal Enterprise Government Others
Make An Enquiry Before Buying This Report@
http://ift.tt/2op9jNs
Key Points In Table Of Content
2017-2022 Prepaid Card Report on Global and United States Market, Status and Forecast, by Players, Types and Applications 1 Methodology and Data Source 1.1 Methodology/Research Approach 1.1.1 Research Programs/Design 1.1.2 Market Size Estimation 1.1.3 Market Breakdown and Data Triangulation 1.2 Data Source 2.1.1 Secondary Sources 2.1.2 Primary Sources 1.3 Disclaimer 2 Prepaid Card Market Overview 2.1 Prepaid Card Product Overview 2.2 Prepaid Card Market Segment by Type 2.2.1 Open-loop prepaid card 2.2.2 Closed-loop prepaid card 2.2.3 Reloadable prepaid card 2.2.4 Payroll card 2.2.5 Government benefit card 2.3 Global Prepaid Card Product Segment by Type 2.3.1 Global Prepaid Card Sales (K Units) and Growth (%) by Types (2012, 2016 and 2022) 2.3.2 Global Prepaid Card Sales (K Units) and Market Share (%) by Types (2012-2017) 2.3.3 Global Prepaid Card Revenue (Million USD) and Market Share (%) by Types (2012-2017) 2.3.4 Global Prepaid Card Price (USD/Unit) by Type (2012-2017) 2.4 United States Prepaid Card Product Segment by Type 2.4.1 United States Prepaid Card Sales (K Units) and Growth by Types (2012, 2016 and 2022) 2.4.2 United States Prepaid Card Sales (K Units) and Market Share by Types (2012-2017) 2.4.3 United States Prepaid Card Revenue (Million USD) and Market Share by Types (2012-2017) 2.4.4 United States Prepaid Card Price (USD/Unit) by Type (2012-2017) 3 Prepaid Card Application/End Users 3.1 Prepaid Card Segment by Application/End Users 3.1.1 Personal 3.1.2 Enterprise 3.1.3 Government 3.1.4 Others 3.2 Global Prepaid Card Product Segment by Application 3.2.1 Global Prepaid Card Sales (K Units) and CGAR (%) by Applications (2012, 2016 and 2022) 3.2.2 Global Prepaid Card Sales (K Units) and Market Share (%) by Applications (2012-2017) 3.3 United States Prepaid Card Product Segment by Application 3.3.1 United States Prepaid Card Sales (K Units) and CGAR (%) by Applications (2012, 2016 and 2022) 3.3.2 United States Prepaid Card Sales (K Units) and Market Share (%) by Applications (2012-2017) 4 Prepaid Card Market Status and Outlook by Regions 4.1 Global Market Status and Outlook by Regions 4.1.1 Global Prepaid Card Market Size and CAGR by Regions (2012, 2016 and 2022) 4.1.2 North America 4.1.3 Asia-Pacific 4.1.4 Europe 4.1.5 South America 4.1.6 Middle East and Africa 4.1.7 United States 4.2 Global Prepaid Card Sales and Revenue by Regions 4.2.1 Global Prepaid Card Sales (K Units) and Market Share (%) by Regions (2012-2017) 4.2.2 Global Prepaid Card Revenue (Million USD) and Market Share (%) by Regions (2012-2017) 4.2.3 Global Prepaid Card Sales (K Units), Revenue (Million USD), Price (USD/Unit) and Gross Margin (%) (2012-2017) 4.2.4 North America Prepaid Card Sales (K Units), Revenue (Million USD), Price (USD/Unit) and Gross Margin (%) (2012-2017) 4.2.5 Europe Prepaid Card Sales (K Units), Revenue (Million USD), Price (USD/Unit) and Gross Margin (%) (2012-2017) 4.2.6 Asia-Pacific Prepaid Card Sales (K Units), Revenue (Million USD), Price (USD/Unit) and Gross Margin (%) (2012-2017) 4.2.7 South America Prepaid Card Sales (K Units), Revenue (Million USD), Price (USD/Unit) and Gross Margin (2012-2017) 4.2.8 Middle East and Africa Prepaid Card Sales (K Units), Revenue (Million USD), Price (USD/Unit) and Gross Margin (%) (2012-2017) 4.2.9 United States Prepaid Card Sales (K Units), Revenue (Million USD), Price (USD/Unit) and Gross Margin (2012-2017)
……………….
10 Global Prepaid Card Market Forecast 10.1 Global Prepaid Card Sales, Revenue Forecast (2017-2022) 10.1.1 Global Prepaid Card Sales (K Units) and Growth Rate (%) Forecast (2017-2022) 10.1.2 Global Prepaid Card Revenue (Million USD) and Growth Rate (%) Forecast (2017-2022) 10.2 United States Prepaid Card Market Forecast 10.1.1 United States Prepaid Card Sales (K Units) and Growth Rate (%) Forecast (2017-2022) 10.2.2 United States Prepaid Card Revenue (Million USD) and Growth Rate (%) Forecast (2017-2022) 10.3 Global Prepaid Card Forecast by Regions 10.3.1 North America Prepaid Card Sales (K Units) and Revenue (Million USD) Forecast (2017-2022) 10.3.2 Europe Prepaid Card Sales (K Units) and Revenue (Million USD) Forecast (2017-2022) 10.3.3 Asia-Pacific Prepaid Card Sales (K Units) and Revenue (Million USD) Forecast (2017-2022) 10.3.4 South America Prepaid Card Sales (K Units) and Revenue (Million USD) Forecast (2017-2022) 10.3.5 Middle East and Africa Prepaid Card Sales (K Units) and Revenue (Million USD) Forecast (2017-2022) 10.4 Prepaid Card Forecast by Type 10.4.1 Global Prepaid Card Sales (K Units) and Revenue (Million USD) Forecast by Type (2017-2022) 10.4.2 United States Prepaid Card Sales (K Units) and Revenue (Million USD) Forecast by Type (2017-2022) 10.5 Prepaid Card Forecast by Application 10.5.1 Global Prepaid Card Sales (K Units) Forecast by Application (2017-2022) 10.5.2 United States Prepaid Card Sales (K Units) Forecast by Application (2017-2022) 11 Research Findings and Conclusion
List of Tables and Figures
Table Research Programs/Design for This Report Figure Bottom-up and Top-down Approaches for This Report Figure Data Triangulation Table Key Data Information from Secondary Sources Table Key Data Information from Primary Sources Figure Prepaid Card Product Picture Figure Global Prepaid Card Revenue (Million USD) Status and Outlook (2012-2022) Figure United States Prepaid Card Revenue (Million USD) Status and Outlook (2012-2022) Figure Product Picture of Open-loop prepaid card Table Major Players of Open-loop prepaid card Figure Global Open-loop prepaid card Sales (K Units) and Growth Rate (%) (2012-2017) Figure Product Picture of Closed-loop prepaid card Table Major Players of Closed-loop prepaid card Figure Global Closed-loop prepaid card Sales (K Units) and Growth Rate (%) (2012-2017) Figure Product Picture of Reloadable prepaid card
Continued...
Buy 1-User Pdf @
http://ift.tt/2pqwOmR
Contact Us:
Norah Trent
Partner Relations & Marketing Manager
Ph: +1-646-845-9349 (Us)
Ph: +44 208 133 9349 (Uk)
Follow On Linkedin: http://ift.tt/2nlLMhD
Subscribe Our Youtube Channel @
http://ift.tt/2p9xv40
Click Here For More Details
http://ift.tt/1Ko9GyO
0 notes
Photo

Coming up on March 16, 2016 in Brooklyn - with Jon Waldo, Catherine Rutgers, David Derickson, Yuhan Su, @istvanpeterbracz, @colleenclarkmusic, Stephen Gilewski, and Tom Burnett
3 notes
·
View notes
Link
Meena Rezkallah, P.Eng.
May 17
2 min read
2.0 Piping Design For Loading Types
As described in Introduction to Pipe Stress Analysis, the pipe stress analyst is concerned with two types of loads — primary and secondary. Not only are the causes and the failure modes of these two loading types quite different, but not surprisingly, the solutions to these two types of loading are usually different as well. In fact, the solution to a problem caused by one of the loading types often causes a problem with the other loading type. Therefore, a compromise must often be reached in order to find the solution to these two types of loading.
Note that primary loads are usually classified further, according to their duration of loading. Those primary loads which are nearly always present throughout operation are called sustained loads, while those which occur less frequently are called occasional loads. The methods of resisting these two types of loads are similar, with the main difference being found in the use of a higher allowable stress for occasional loads (as seen in Introduction to Pipe Stress Analysis)
Index:
Pipe Stress Analysis Notes
2.1 Designing For Sustained Loads — Pressure
2.1.1 Minimum Wall Thickness Requirements 2.1.2 Pressure Design of Elbows and Miters 2.1.3 Pressure Design of Flanges and Blanks 2.1.4 Pressure Design of Branch Connections
2.1.5 Restraint of Unbalanced Expansion Joint Pressure Loads
2.2 Designing For Sustained Loads — Weight
2.2.1 Calculation of Weight Stresses 2.2.2 Use of Standard Weight Spans 2.2.3 Consideration of Nozzle Loads
2.3 Designing For Expansion Loads
2.3.1 Magnitude of Thermal Load 2.3.2 Guided Cantilever Method 2.3.3 Refining the Model Through the Use of Restraint Stiffnesses 2.3.4 Use of Expansion Loops 2.3.5 Simplified Expansion Stress Check 2.3.6 Stress Reduction through Use of Expansion Joints 2.3.7 Expansion Stress — Other Solutions
2.4 Hanger Design
2.4.1 Variable Spring Hanger Design Basics 2.4.2 Load Variation 2.4.3 Hanger Selection Table 2.4.4 Hanger Design Process — Restrained Weight, Free Thermal, and More.. 2.4.5 Restraint Placement Using Distance to First Rigid Criteria 2.4.6 Notes on Hanger Design 2.4.7 CAESAR II Hanger Design Control and Options
2.5 Designing For Occasional Loads (Static Equivalent of Dynamic Loads)
2.5.1 Wind Loading 2.5.2 Earthquake Loading 2.5.3 Quickly Applied Loads
To get our piping engineering services, please contact our engineering consultant department for a free quote
Tags:
Piping Design
Loading Types
CAESAR II
Pipe Stress Analysis Notes
•
Piping Stress Analysis
142 views
Engineering Consulting Services Alberta
Engineering Consulting Services British Columbia
Engineering Consulting Services Saskatchewan
Engineering Consulting Services Ontario
Engineering Consulting Services Middle East (Arabian Gulf)
Engineering Services
0 notes
Link
2.0 Piping Design For Loading Types
May 17, 2020
P.Eng.
Meena Rezkallah
As described in Introduction to Pipe Stress Analysis, the pipe stress analyst is concerned with two types of loads — primary and secondary. Not only are the causes and the failure modes of these two loading types quite different, but not surprisingly, the solutions to these two types of loading are usually different as well. In fact, the solution to a problem caused by one of the loading types often causes a problem with the other loading type. Therefore, a compromise must often be reached in order to find the solution to these two types of loading.
Note that primary loads are usually classified further, according to their duration of loading. Those primary loads which are nearly always present throughout operation are called sustained loads, while those which occur less frequently are called occasional loads. The methods of resisting these two types of loads are similar, with the main difference being found in the use of a higher allowable stress for occasional loads (as seen in Introduction to Pipe Stress Analysis)
Index:
Pipe Stress Analysis Notes
2.1 Designing For Sustained Loads — Pressure
2.1.1 Minimum Wall Thickness Requirements 2.1.2 Pressure Design of Elbows and Miters 2.1.3 Pressure Design of Flanges and Blanks 2.1.4 Pressure Design of Branch Connections
2.1.5 Restraint of Unbalanced Expansion Joint Pressure Loads
2.2 Designing For Sustained Loads — Weight
2.2.1 Calculation of Weight Stresses 2.2.2 Use of Standard Weight Spans 2.2.3 Consideration of Nozzle Loads
2.3 Designing For Expansion Loads
2.3.1 Magnitude of Thermal Load 2.3.2 Guided Cantilever Method 2.3.3 Refining the Model Through the Use of Restraint Stiffnesses 2.3.4 Use of Expansion Loops 2.3.5 Simplified Expansion Stress Check 2.3.6 Stress Reduction through Use of Expansion Joints 2.3.7 Expansion Stress — Other Solutions
2.4 Hanger Design
2.4.1 Variable Spring Hanger Design Basics 2.4.2 Load Variation 2.4.3 Hanger Selection Table 2.4.4 Hanger Design Process — Restrained Weight, Free Thermal, and More.. 2.4.5 Restraint Placement Using Distance to First Rigid Criteria 2.4.6 Notes on Hanger Design 2.4.7 CAESAR II Hanger Design Control and Options
2.5 Designing For Occasional Loads (Static Equivalent of Dynamic Loads)
2.5.1 Wind Loading 2.5.2 Earthquake Loading 2.5.3 Quickly Applied Loads
To get our piping engineering services, please contact our engineering consultant department for a free quote
TAGS:
Piping Design
Loading Types
Engineering Consulting Services
0 notes