#more certainly sql than tableau
Explore tagged Tumblr posts
Visit Tumblr Blog
Explore Tumblr blogs with no restrictions, modern design and the best experience.
Last Seen Tumblr Blogs


Fun Fact
Post activity is at the highest at 4:00 pm EDT; notes peak at 10:00 pm EDT.
Text
caught between my cousin didn't get a job right out of college and it didn't kill her 😀 and my cousin went to an Ivy and also still only got the job because of a friend referral 😨
#eggsistential speaks#i have exactly One (1) referral that went anywhere#final interview is tomorrow and im pretty nervous#but also what can i do at this point other than be myself#and i know myself is plenty capable#trying to speedrun brushing up on previous classwork#position desires more tableau and sql but I'm a matplotlib/seaborn and pandas mfer#ive certainly touched both#more certainly sql than tableau#but only through the wonky edpuzzle coding thingy we used for class#eggsistential job hunt crisis#if it doesn't go well I'll make it known#the feeling that since this is my only surviving referral this is my last shot is kinda overwhelming
0 notes
Text
Data Analytics Training in Kerala: Unlocking Opportunities in the Age of Data
In today’s information-driven economy, the ability to make data-driven decisions has become a core function of successful businesses. Whether it's understanding customer behavior, optimizing internal operations, forecasting trends, or creating new products, data analytics is at the heart of modern strategy. For those looking to break into this transformative field, enrolling in Data Analytics training in Kerala can be the ideal starting point for a rewarding and future-proof career.
What Is Data Analytics?
At its core, data analytics involves examining large volumes of data to discover patterns, correlations, and trends. These insights are then used to inform strategic decisions. The field encompasses a wide range of processes including:
Data Collection – Gathering data from various sources.
Data Cleaning – Ensuring accuracy by correcting or removing erroneous data.
Data Analysis – Using statistical techniques to make sense of the data.
Data Visualization – Presenting data in a graphical or interactive format.
Predictive Modeling – Anticipating future outcomes based on historical trends.
Professionals trained in these skills help businesses stay competitive and agile in a data-centric world.
Why Is Data Analytics Important Today?
The amount of data generated by organizations and individuals is growing exponentially. From mobile apps and websites to sensors and social media, we generate more data than ever before. However, raw data is meaningless unless it's analyzed and transformed into actionable insights. Here’s why Data Analytics training in Kerala is so important:
Business Intelligence: Analytics provides the foundation for critical business insights.
Competitive Advantage: Organizations that use data effectively outperform their competitors.
Cost Reduction: Identifying inefficiencies through data analysis can save companies time and money.
Customer Understanding: Data allows companies to better serve and understand their customers.
What You Will Learn in a Data Analytics Course
A well-structured Best Data Analytics training in Kerala provides learners with a complete skill set that includes both foundational and advanced techniques. Here are the core areas typically covered:
1. Statistics and Probability
These are essential for understanding data distributions, trends, and significance testing.
2. Data Management & SQL
You’ll learn how to retrieve and manipulate data from relational databases using SQL.
3. Data Visualization
Training in tools like Tableau, Power BI, or Python's Matplotlib and Seaborn helps bring your insights to life visually.
4. Python for Data Analytics
Python is one of the most widely used programming languages in data science. Courses will cover:
Pandas for data manipulation
NumPy for numerical analysis
Matplotlib/Seaborn for visualization
5. Machine Learning Basics
Some courses include basic machine learning concepts such as:
Regression and classification
Clustering
Decision trees
6. Capstone Projects
Most programs culminate in hands-on projects that apply what you've learned to real-world scenarios, such as analyzing customer churn, market trends, or healthcare data.
Who Should Enroll in a Data Analytics Training Program?
One of the strengths of the field is its accessibility to people from various academic and professional backgrounds. You don’t need to be a programmer to start, though some technical aptitude certainly helps. Data Analytics training in Kerala is suitable for:
Fresh graduates seeking job-oriented training
Working professionals looking to shift careers
Engineers and developers upskilling for tech roles
Business managers looking to make data-informed decisions
Entrepreneurs wanting to use data for better decision-making
Career Opportunities After Data Analytics Training
With demand on the rise, the job market for data professionals is flourishing. Upon completing your training, you can pursue roles like:
Data Analyst
Business Intelligence Analyst
Data Engineer
Operations Analyst
Data Scientist (with further specialization)
These roles exist across industries such as healthcare, finance, retail, logistics, education, and IT services.
The Advantage of Studying in Kerala
Kerala has positioned itself as a leading hub for IT and tech education in India. Choosing to pursue Data Analytics training in Kerala offers several benefits:
1. Quality Educational Ecosystem
Kerala is home to a wide array of technical institutions, private academies, and online education providers.
2. Strong IT Infrastructure
With IT parks in Kochi, Trivandrum, and Calicut, Kerala offers real job opportunities for tech and analytics graduates.
3. Affordable Learning
Compared to cities like Bangalore, Pune, or Hyderabad, the cost of living and learning in Kerala is much more budget-friendly.
4. Industry-Relevant Curriculum
Many local institutions partner with companies or employ instructors from industry to ensure students are learning relevant, applied skills.
Key Features to Look for in a Training Program
When selecting your program, consider these essential elements:
Experienced Trainers – Preferably with real-world data analytics experience.
Project-Based Learning – Look for programs that emphasize hands-on practice.
Updated Curriculum – Ensure that tools and techniques reflect current industry standards.
Placement Assistance – An institute that supports your transition to employment adds significant value.
Certification – Globally or nationally recognized certifications boost your resume.
Zoople Technologies: Leading the Way in Data Analytics Training in Kerala
When it comes to industry-aligned, hands-on Data Analytics training in Kerala, Zoople Technologies stands out as one of the most trusted names in the field. With a mission to bridge the skills gap between education and employment, Zoople provides comprehensive programs that combine theoretical knowledge with real-world application.
Why Choose Zoople Technologies?
Expert Mentorship: Instructors with years of industry experience in analytics, data science, and software development.
Live Projects: Learners work on real business datasets and scenarios that mimic actual workplace environments.
Modern Tools and Techniques: The curriculum includes the latest tools like Python, Tableau, SQL, and machine learning foundations.
Flexible Learning Options: Both in-classroom and online training modes available.
Career Support: Zoople offers resume writing, interview preparation, and placement drives.
Student Success Stories: Many of Zoople’s alumni have successfully transitioned into roles at leading companies across India and abroad.
By choosing Zoople Technologies, you're not just learning a subject—you’re stepping into a career with confidence.
Final Thoughts
As the digital landscape continues to evolve, the importance of data-driven decision-making becomes even more pronounced. Building skills in data analytics equips you with the tools to thrive in virtually any industry, offering high-growth opportunities and career flexibility.
Enrolling in Data Analytics training in Kerala is a smart step toward achieving these goals—and doing so with a reputable and forward-thinking institute like Zoople Technologies ensures you’re in the best hands. With its experienced faculty, real-world curriculum, and career-focused approach, Zoople is paving the way for the next generation of data professionals.
If you’re ready to turn your interest in data into a dynamic career, Zoople Technologies is your ideal launchpad.
0 notes
Text
What Is Datae Science: Tutorial, Elements, Tools, Life Cycle, Functions

Corporates right now are struggling to extract the powerful insights they should make higher business decisions . Data Science is an rising field that mixes methods from machine studying , AI and statistics with totally new technologies for handling these huge quantities of complex and rapidly-changing information. SAS is probably certainly one of the data science instruments, a closed source proprietary software program, which is specifically designed for operations. SAS is utilized by giant organizations to perform the analysis of the info. SAS tool makes use of SAS programming languages that help in performing the statistical modeling. As mentioned earlier, information science is the field that deals with algorithms, instruments, methods, and methodologies; it is essential for us to know the instruments used in information science.
visit to know more about : data science training in hyderabad Data Science is extracting knowledge from information to make predictions or develop fashions, and it is a rapidly rising field with nice potential for companies. This data science tutorial for beginners will be taught some primary knowledge science concepts, like definitions, elements, applications, and challenges. Data Science is the area of examine which includes extracting insights from huge amounts of information using numerous scientific strategies, algorithms, and processes. The term Data Science has emerged because of the evolution of mathematical statistics, information evaluation, and massive information. We use these statistical strategies to describe, visualize and hypothesize info from the data. This permits traders and businesses to regulate the place they use their resources to reap the advantages of attainable future events. Predictive analytics can be used to reduce threat and enhance operational efficiencies.Predictive analytics is a singular sort of expertise that types predictions about certain unknowns in the future. It attracts on a sequence of strategies to make these determinations, together with synthetic intelligence , information mining, machine learning, modeling, and statistics. FocusBusiness intelligence focuses on both Past and present dataData science focuses on previous data, current information, and in addition future predictions. Planning for a mannequin is performed by utilizing completely different statistical formulation and visualization instruments. SQL analysis services, R, and SAS/access are a few of the instruments used for this purpose. While Data Science is a vast subject, being an aggregate of several applied sciences and disciplines, it is attainable to acquire these skills with the best method. Both data science and business intelligence are used to perform the data evaluation of the large volumes of data of the Organization. There are some differences between Data Science which are listed below. Tableau is an information visualization software that helps in creating interactive visualizations by using graphics. Tableau has the potential to interface with databases, OLAP cubes, etc. Logistic regression plays a vital position when coping with information analytics with the assistance of R programming. You can use this Data Science tutorial to grasp numerous aspects of R programming and to discover the data on a broader vary. Each stage requires completely different proficiency, but advanced-level scientists also need to have some knowledge of machine learning. To attain the very best degree of job hierarchy, one needs to possess a specific skill set. It is easy to spot the growing significance of data science in how seamless online browsing has turn out to be with time. It is therefore essential to have readability associated to skills and concepts instrumental to the field. Hence, earlier than embarking on a career on this discipline, one ought to concentrate on the variations between data analysts, scientists, and engineers. The very first or the entry-level role on this field is that of the info analyst. They are the novices who remodel the numeric knowledge into understandable stuff. These engineers are answerable for preparing and pairing the data for further analytical procedures. Data scientists are high-level professionals who use superior techniques and tools. Data Science further has some components which aids us in addressing all these questions. It is a type of Artificial Intelligence that makes the computer systems capable of learning on their very own i.e without explicitly being programmed. With machine learning, machines can replace their own code, every time they arrive throughout a model new state of affairs. Most healthcare industries are utilizing data science to reinforce the client expertise. Data science is at present used for image recognition in speech recognition. Let us take an instance of a Social Media application like Facebook, which helps in uploading the picture on Facebook and you will begin getting suggestions to tag your folks. Modeling helps in calculating and making predictions based on totally different algorithmic equations. Data specialists ought to have solid management over machine learning aside from what they know via primary Data Science Tutorials. They then feed the information into the ML algorithm or into a statistical mannequin that works with the analytic methods. In the healthcare sector, information science is providing lots of benefits. Data science is getting used for tumor detection, drug discovery, medical image evaluation, digital medical bots, etc. How to code fundamental psychological experiments with Python Basic example of psychopy. I show how to develop an experiment that registers how much time it takes for somebody to press a key, then it saves the information as a csv file. Blog Get insights on scaling, management, and product improvement for founders and engineering managers. In the present world as of 2020, there is a rise in the level of Data Science in the present industries and technological aspect. Transportation or the transport industries are also utilizing database Technology to create self-driving vehicles. Whether it is making progressive modifications or environment friendly decision-making, data has the potential to unlock varied paths to success and skilled achievement. In this Data Science tutorial, you'll come to learn about several job roles, the abilities required for them, and the salaries provided in lieu. ➤ Data analytics allows organizations to uncover patterns and extract useful insights from uncooked data. It helps corporations understand their customers better, produce relevant content, strategize advert campaigns, develop meaningful merchandise, and in the end boost business performance. When you addContent an image on Facebook and start getting the suggestion to tag to your friends. You don't have to master Java and SQL for learning Big Data and Data Science. However, having functional information of these languages could be helpful. We provide complementary programs with our certification program which will assist you to in brushing up with Java earlier than you start out.
For more information: best institute for data science in hyderabad
360DigiTMG - Data Analytics, Data Science Course Training Hyderabad
Address - 2-56/2/19, 3rd floor,, Vijaya towers, near Meridian school,, Ayyappa Society Rd, Madhapur,, Hyderabad, Telangana 500081
099899 94319
Visit on map : https://g.page/Best-Data-Science
0 notes
Text
Grafana Metabase

If you’ve ever done a serious web app, you’ve certainly met with a requirement for its monitoring, or tracking various application and runtime metrics. Exploring recorded metrics lets you discover different patterns of app usage (e.g., low traffic during weekends and holidays), or, for example, visualize CPU, disk space and RAM usage, etc. As an example, if the RAM usage graph shows that the usage is constantly rising and returns to normal only after the application restart, there may be a memory leak. Certainly, there are many reasons for implementing application and runtime metrics for your applications.
There are several tools for application monitoring, e.g. Zabbix and others. Tools of this type focus mainly on runtime monitoring, i.e., CPU usage, available RAM, etc., but they are not very well suited for application monitoring and answering questions like how many users are currently logged in, what’s the distribution of server response times, etc.
When comparing Grafana and Metabase, you can also consider the following products. Prometheus - An open-source systems monitoring and alerting toolkit. Tableau - Tableau can help anyone see and understand their data. Connect to almost any database, drag and drop to create visualizations, and share with a click.
Here's what people are saying about Metabase. Super impressed with @metabase! We are using it internally for a dashboard and it really offers a great combination of ease of use, flexibility, and speed. Paavo Niskala (@Paavi) December 17, 2019. @metabase is the most impressive piece of software I’ve used in a long time.
���间序列,日志与设备运行数据分析选 Grafana;企业生产经营数据分析则可以选 Superset。 Metabase. Metabase 目前在 GitHub 上受欢迎程度仅次于 Superset,Metabase 也是一个完整的 BI 平台,但在设计理念上与 Superset 大不相同。. Kibana and Metabase are both open source tools. Metabase with 15.6K GitHub stars and 2.09K forks on GitHub appears to be more popular than Kibana with 12.4K GitHub stars and 4.81K GitHub forks.
In this post, I’ll show you, how to do real time runtime and application monitoring using Prometheus and Grafana. As an example, let’s consider Opendata API of ITMS2014+.
Prometheus
Our monitoring solution consists of two parts. The core of the solution is Prometheus, which is a (multi-dimensional) time series database. You can imagine it as a list of timestamped, named metrics each consisting of a set of key=value pairs representing the monitored variables. Prometheus features relatively extensive alerting options, it has its own query language and also basic means for visualising the data. For more advanced visualisation I recommend Grafana.
Prometheus, unlike most other monitoring solutions works using PULL approach. This means that each of the monitored applications exposes an HTTP endpoint exposing monitored metrics. Prometheus then periodically downloads the metrics.
Grafana
Grafana is a platform for visualizing and analyzing data. Grafana does not have its own timeseries database, it’s basically a frontend to popular data sources like Prometheus, InfluxDB, Graphite, ElasticSearch and others. Grafana allows you to create charts and dashboards and share it with others. I’ll show you that in a moment.
Publishing metrics from an application
In order for Prometheus to be able to download metrics, it is necessary to expose an HTTP endpoint from your application. When called, this HTTP endpoint should return current application metrics - we need to instrument the application. Prometheus supports two metrics encoding formats - plain text and protocol buffers. Fortunately, Prometheus provides client libraries for all major programming languages including Java, Go, Python, Ruby, Scala, C++, Erlang, Elixir, Node.js, PHP, Rust, Lisp Haskell and others.
As I wrote earlier, let’s consider ITMS2014+ Opendata API, which is an application written in Go. There is an official Prometheus Go Client Library. Embedding it is very easy and consists of only three steps.
Free microsoft office download for mac full version. The first step is to add Prometheus client library to imports:
The second step is to create an HTTP endpoint for exposing the application metrics. In this case I use Gorilla mux and Negroni HTTP middleware:
We are only interested in line 2, where we say that the /metrics endpoint will be processed by Prometheus handler, which will expose application metrics in Prometheus format. Something very similar to the following output:
In production, you would usually want some kind of access control, for example HTTP basic authentication and https:
Although we have only added three lines of code, we can now collect the application’s runtime metrics, e.g., number of active goroutines, RAM allocation, CPU usage, etc. However, we did not expose any application (domain specific) metrics.
In the third step, I’ll show you how to add custom application metrics. Let’s add some metrics that we can answer these questions:
which REST endpoints are most used by consumers?
how often?
what are the response times?
Grafana Metabase On Pc
Whenever we want to expose a metric, we need to select its type. Prometheus provides 4 types of metrics:
Counter - is a cumulative metric that represents a single numerical value that only ever goes up. A counter is typically used to count requests served, tasks completed, errors occurred, etc.
Gauge - is a metric that represents a single numerical value that can arbitrarily go up and down. Gauges are typically used for measured values like temperatures or current memory usage, but also “counts” that can go up and down, like the number of running goroutines.
Histogram - samples observations (usually things like request durations or response sizes) and counts them in configurable buckets. It also provides a sum of all observed values.
Summary - is similar to a histogram, a summary samples observations (usually things like request durations and response sizes). While it also provides a total count of observations and a sum of all observed values, it calculates configurable quantiles over a sliding time window.
In our case, we want to expose the processing time of requests for each endpoint (and their percentiles) and the number of requests per time unit. As the basis for these metrics, we’ve chosen the Histogram type. Let’s look at the code:
We’ve added a metric named http_durations_histogram_seconds and said that we wanted to expose four dimensions:
code - HTTP status code
version - Opendata API version
controller - The controller that handled the request
action - The name of the action within the controller
For the histogram type metric, you must first specify the intervals for the exposed values. In our case, the value is response duration. On line 3, we have created 36 exponentially increasing buckets, ranging from 0.0001 to 145 seconds. In case of ITMS2014+ Opendata API we can empirically say that most of the requests only last 30ms or less. The maximum value of 145 seconds is therefore large enough for our use case.
Finally, for each request, we need to record four dimensions we have defined earlier and the request duration.Here, we have two options - modify each handler to record the metrics mentioned above, or create a middleware that wraps the handler and records the metrics. Obviously, we’ve chosen the latter:
As you can see, the middleware is plugged in on line 8 and the entire middleware is roughly 20 lines long. On line 27 to 31, we fill the four dimensions and on line 32 we record the request duration in seconds.
Configuration
Since we have everything ready from the app side point of view, we just have to configure Prometheus and Grafana.
A minimum configuration for Prometheus is shown below. We are mainly interested in two settings, how often are the metrics downloaded (5s) and the metrics URL (https://opendata.itms2014.sk/metrics).
A minimal Grafana configuration:
Note: As we can see, a NON TLS port 3000 is exposed, but don’t worry there is a NGINX in front of Grafana listening on port 443, secured by Let’s Encrypt certificate.
Monitoring
Finally, we get to the point where we have everything we need. In order to create some nice charts it is necessary to:
Open a web browser and log into Grafana
Add Prometheus data source
Create dashboards
Create charts
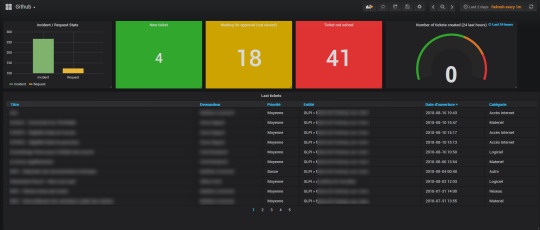
An example of how to create a chart showing the number of HTTP requests per selected interval is shown on the following figure.
Similarly, we’ve created additional charts and placed them in two dashboards as shown on the following figures.
Summary
In this post, we have shown that the application and runtime monitoring may not be difficult at all.
Prometheus client libraries allow us to easily expose metrics from your applications, whether written in Java, Go, Ruby or Python. Prometheus even allows you to expose metrics from an offline applications (behind corporate firewalls) or batch applications (scripts, etc.). In this case, PUSH access can be used. The application then pushes metrics into a push gateway. The push gateway then exposes the metrics as described in this post.
Grafana can be used to create various charts and dashboards, that can be shared. Even static snapshots can be created. This allows you to capture an interesting moments and analyze them later.
Reports and Analytics
Powerful Enterprise Grade Reporting Engine
Elegant SQL interface for people who need a little more power
Widgets for Creating Bar Chars, Pie Charts, Line Graphs
Multiple Dashboards with different personal widgets
Create, organize, and share dashboards with others
Dashboards
Open Source
Completely Open Sources
Community Contribution Available
Simple to Use even for beginners
Install on premises or in the Cloud
Free and Simple to Use
Integrations
Integration with any Data Source in SQL
PostgreSQL, MySQL, Maria DB
Oracle, MS SQL or IBM DB2
Ready Plugins Available
Metabase Vs Grafana
Altnix Advantage
Metabase Consulting Services
Altnix provides Professional services for Consulting on Metabase products. Following items are covered:
Consulting Services for Metabase business intelligence tool
Best practices and guidelines on how to adopt the Metabase business intelligence tool
Architecture Design for Metabase
Technology Roadmap for Metabase adoption at your organization
Solution Design on using Metabase business intelligence tool
Metabase Implementation and Deployment
Altnix will implement Metabase based business intelligence and Analytics solution keeping in mind the business requirements. Implementation includes the following:
Integration with different databases and data sources
Extract Transform Load (ETL) Design
Designing Queries to be used in Metabase
Widgets and Dashboards design in Metabase
Reports Design in Metabase
Development and Design Implementation
UAT and Testing Activities
Production Implementation and Go Live
Warranty Support Period Included
Metabase Customization
Grafana Metabase On Twitter
Altnix will customize your Metabase installation so that it is a better fit for your business environment.
Creating new visualizations and dashboards as per customer needs
Creating custom reports and charts as per customer needs
Adding new scripts, plug-ins, and components if needed
Third-Party Integration
Altnix will integrate Metabase business intelligence tools with other third-party tools to meet several use cases.
Ticketing systems such as LANDesk, BMC Remedy, Zendesk, and ((OTRS)) Community Edition
ITSM Tools such as ((OTRS)) Community Edition, GLPi Network Editon, ServiceNow, and HP Service Manager
Monitoring tools such as Zabbix, Nagios, OpenNMS, and Prometheus
IT Automation Tools such as StackStorm, Ansible, and Jenkins

24x7 AMC Support Services
Altnix offers 24x7 support services on an AMC or per hour basis for new or existing installations on the Metabase Business intelligence tool. Our team of experts are available round the clock and respond to you within a predefined SLA.
Case Studies
Knute Weicke
Security Head, IT
Fellowes Inc, USA
Altnix was an instrumental partner in two phases of our Security ISO needs. The first being a comprehensive developed Service/Ticketing system for our global offices. The second being that of an Asset Management tool that ties all assets into our Ticketing systems to close a gap that we had in that category. They are strong partners in working towards a viable solution for our needs
The Altnix team was very easy to work with and resolved our needs in a timely manner. Working with Altnix, allowed us to focus on our core business while they handled the technical components to help streamline our business tools. We have found a strategic partner in Altnix
Johnnie Rucker
General Manager
Encore Global Solutions, USA
White Papers
0 notes
Text
Careernuts - How to Become a Data Analyst: Career Path, Opportunities, Salary, Scope
A career as a data analyst is a great idea for those who love numbers. From degree required to salary range to top colleges, Analytics professional Surjeet Singh shares how to become a data analyst in India.

1. Role of a Data Analyst
Every business collects data, from shopping websites to media companies. This data includes logistics costs, consumer research, sales figures, websites’ visitor profiling and more. The main job of a data analyst is to fetch information from the raw data that will be of great use to their clients. Big data is a term that means a large collection of data. This is structured, analyzed and interpreted to solve business problems or interpret patterns and trends that can help a business.
I am an Analytics Professional and my technical skills include coding and analysis using various analytical tools like SAS, SQL, Python, R, and Tableau. These tools help data analysts make sense of the raw data, to help companies understand their customers’ needs and ultimately, increase profits.
Contents: Jump to Section1.
Role of a Data Analyst
1.1 Difference between Data Analyst vs Data Scientist vs Data Engineer
1.2 Is Data Analytics a Good Career2.
How to Become a Data Analyst
2.1 Courses Taken: Data Analytics Subjects
2.2 Entrance Exams
2.3 Academic Qualifications/ Options
2.4 License Required
2.5 Internship/ Work Experience Required
2.6 Cost of Tuition and Training
2.7 Competition & Big Data Scope in India
2.8 General Age to Start Professional Career for Data Analysts
2.9 Governing Bodies3.
Professional Opportunities/ Career Growth for Data Analysts
3.1 Specializations/ Sub-Professions
3.2 Companies & Institutions That Employ Data Analysts
3.3 Growth Prospects
3.4 Entrepreneurship Opportunities
3.5 Salary Range4.
Further Resources
4.1 Top Universities in India
4.2 Top Universities in World
4.3 Famous Personalities
4.4 Useful Links1.1 Difference between Data Analyst vs Data Scientist vs Data Engineer
Data professionals are of different types:
data analysts
data engineers
data scientists
data architects
database managers
database administrators

You can also call them different data science paths.
Out of these, data analysts and data scientists have somewhat similar roles. A data analyst’s main role is to structure, analyze and interpret raw data, in order to provide solutions to a company’s questions, or find trends, etc.
Data scientists have a similar role as data analysts. However, they use machine learning models or algorithms, and statistics to do so. And data engineers are the professionals who develop the software used by data scientists and analysts. They build, monitor, test and optimize the platforms or systems for data storage and analysis.
1.2 Is Data Analytics a Good Career?
Yes.
Data analytics career paths are gaining a lot of popularity and respect these days since many large corporations collect big data. So there is a lot of demand for all types of data professionals. Data analysts also considered intellectual, new tech professionals. All these factors, along with a good salary makes data analytics a good career choice.
2. How to Become a Data Analyst
2.1.1 Courses Taken at School
Science stream (PCM) with physics, chemistry, maths, computer, and English.
You need to have a background in maths in 10+2 (high school) with an interest and aptitude for statistics.
2.1.2 Courses Taken at College: Data Analytics Subjects
Here are some of the courses or subjects that are a part of B.Tech. in Computer Science (see Section 2.3.1), which can be a helpful background for a career in Data Analytics:
Data Structures
Digital Logic Design
Design And Analysis Of Algorithms
Database Management Systems
Computer Programming
Object-Oriented Programming using C++/Java/Python
Digital Electronics
Theory of Computation
Discrete Mathematical Structures.
Operating Systems
SQL, Python

2.2 Entrance Exams
Depends on the degree you go for – B.Tech is a good idea (see Section 2.3.1).
For engineering, JEE mains for IITs, Graduate Aptitude Test in Engineering (GATE) for others for undergrad college.
For B.Sc., some universities look for cut-off percentages in the 12th, and others have an internal qualifying exam or admission test.
Entrance exams for a master’s degree are as follows:
CAT, CMAT, and NMAT for MBA in India.
SNAP (for Symbiosis institutes) for MBA in India.
GMAT for MBA in the US and some other countries.
2.3.1 Academic Qualifications/ Degree Required
Graduation required, especially B.Tech. Organizations have recently been emphasizing on B.Tech and/or MBA.
As of yet, there is no undergraduate degree program for Data Analytics (by a recognized university). There are few certificate/ diploma courses by various institutes (like IIM, IIT, ISB) for graduates or working professionals.
So the best idea is to earn a bachelor’s degree (B.Tech or B.E.) in Computer Science, Information Technology or Statistics. And study applied statistics or data analysis as subjects within those, or do a certificate program.
I did B.Sc and MBA.
2.3.2 Post-Graduate Degree Requirements/ Options
MBA, Ph.D. in a science-related field.
Most large organizations that hire data professionals prefer candidates with MBA degrees. After that, a Ph.D. in a science or statistics field could be an option for further studies, although it is not required. A Ph.D. would be a great idea if you want to become a data scientist.
Some universities abroad also offer degrees like Master of Science in Analytics or Master of Science in Data Science. But it is better to get experience in data analytics before going for (or considering) these masters degrees since job experience will help you gain an understanding of the field and interdisciplinary knowledge. Sometimes, it may even be a better idea to avoid masters in analytics and go for an MBA instead, as a lot of companies prefer that. So getting work experience in the field will help you understand the employers’ demands and preferences.
2.4 License Required
No.
2.5 Internship/ Work Experience Required
Yes.
Internship depends on what degree or course you go for. A 6-month internship is a part of the B.Sc programs. For B.Tech or B.E., internships are required. Students typically join an internship in summer holidays, usually for 3 months between the 3rd and 4th years of college.
It is highly desirable to find an internship in data analytics or data science, depending on your interest or chosen career path.
For Ph.D., to enter the program, you must work in a laboratory during college/university, including summers, as well as write a senior research thesis.
2.6 Cost of Tuition and Training
For B.Tech or B.E, approximate fees at NITs is around INR 5 lacs for a 4-year course, which excludes hostel fees. Total spend should be around INR 7-8 lacs, including the hostel.
Students should note that there is a vast difference in tuition in private and government engineering colleges. Good private engineering colleges have fees of about 3 lacs per year for a 4-year course, which makes a total of about 12 lacs, excluding the hostel.
For MBA, top colleges charge anywhere between 5-8 lacs for a 2-year course, excluding hostel. Total spend will be around 10-12 lacs.
2.7 Competition & Big Data Scope in India
Highly competitive for college entrance. Less competitive for jobs.
Getting into a good college and university will account for the most of the competition you will face. The competition will depend on the ranking of college, and the better the college, the higher your chances of getting a job and better salary.
Getting into IITs and government colleges is quite tough, as you’ll be competing with the top students of the country. Try to get into a good school and a top B-school as they have the best companies visit during campus placements.
To get into the top colleges, start your preparations early for entrance exams. For B.Tech, you should start as early as in 10th grade and for MBA/MS, as early as 3rd year of a 4-year graduation or 2nd year of a 3-year graduation.
For jobs, the competition level is moderate, although it may increase in the coming years, due to the increasing popularity of this career option among young graduates. If you graduate from one of the top colleges, it should be fairly easy to land a good entry-level job either through college placement or online applications. Demand for data professionals is increasing year after year, so it seems like a secure career choice in the coming technological era.
2.8 General Age to Start Professional Career for Data Analysts
23-24 years.
Since analytics is a relatively new field, earlier the companies used to hire candidates with MBA and experience (25-30 years) for data analysis. But now freshers are also being hired.
2.9 Governing Bodies
None.
3. Professional Opportunities/ Career Growth for Data Analysts
3.1 Specializations/ Sub-Professions
Data professionals are of different types:
data analysts
data engineers
data scientists
data architects
database managers
database administrators
However, under data analytics, there are no sub-professions. Data analysts may have certain specializations, such as market data analyst, web data analyst, IoT (internet of things) data analyst.
3.2 Companies & Institutions that Employ Data Analysts
Mostly private companies (consulting/BFSI /IT firms).
Banking, financial services and insurance (BFSI) and IT firms are the top employers of data analysts. Examples include Accenture, Barclays, J.P. Morgan, IBM, etc.
Other than that, large corporations and tech companies like Google, Amazon, and Apple also hire data analysts. Consulting firms and data analysis companies like McKinsey, Boston Consulting Group (BCG), TCS, Bloomberg, etc. also employ data analysts.
3.3 Growth Prospects
It certainly depends on the hierarchy system in the organization one is working for.
Data analysts can start as Data Analyst interns. Fresh graduates can get the position of Data Analyst, and then be promoted as Senior Data Analyst after 2-4 years of experience. Other senior positions include Lead Knowledge Analyst, Knowledge Expert, Data Analytics Consultant, Head – Global Data & Analytics and Vice President – Business Data Analyst.

3.4 Entrepreneurship Opportunities
Yes.
In recent years, a number of startups have come up. Gurugram, Bengaluru, and Hyderabad are the main hubs for startups and entrepreneurial ventures for data analysts. Data analysts can start their own consulting firms to provide solutions to clients based on data visualizations & analysis.
Analytics startups can provide SaaS (software as a service). They develop machine-learning software and advanced analytical applications for big data analysis. These tools or software can provide solutions for collecting, storing, cleaning or analyzing data.
3.5 Salary Range
On an average its 4-5 lacs per annum for freshers.
A good college fresh B.Tech graduate can get anything above 6 lacs p.a., especially with a masters degree. After 1-2 years of experience, it is common for data analysts to earn 5-5.5 lacs p.a.
4. Further Resources
4.1 Top Universities in India
Few IIM institutes (like Lucknow and Ahmedabad) are the top colleges when it comes to diploma courses in Big Data/ Analytics. Additionally, IIT Hyderabad offers a diploma course in Big Data/ Analytics for working professionals. Various MBA colleges in India have starting specific big data/analytics programs.
But I would suggest to go for a normal MBA course from a good institute as it would cover things one needs in this field. And yes, good institutes can promise job interviews.

For:
B.Tech – All IITs, All NITs
MBA – All IIMs, SPJIMR, SCMHRD, NMIMS, JBIMS, XLRI
4.2 Top Universities in World
Harvard University (Master of Science in Data Science)
Massachusetts Institute of Technology (MIT Sloan) (Data Analytics Certificate)
Carnegie Mellon University (Master of Science in Information Technology with a specialization in Business Intelligence & Data Analytics)
Penn State University (Master in Data Analytics; Master of Professional Studies in Business Analytics)
Boston University (Master of Science in Computer Information systems)
Missouri University of Science and Technology (online graduate certificate in Business Analytics and Data Science)
Illinois Institute of Technology, Chicago (Master of Data Science)
Johns Hopkins University (MS in Data Science; post master’s certificate in Data Science)
UC Berkeley, California (Master of Information and Data Science)
For top universities in the world for MBA, please refer to Section 4.2 in Business Management.
4.3 Famous Personalities
Kenneth Cukier
Dean Abbott
Hilary Mason
Geoffrey Hinton
Bernard Marr
4.4 Useful Links
The Internet is full of helpful videos for Analytics field aspirants. One can check the website for SAS. Its a US-based organization which developed the initial analytic tool (SAS).
A Career in Data Analytics: Is It Right for You?
Wondering if you should take up Analytics? From the pros and cons to understanding life as an Analytics Professional, here is everything you need to know about this profession before you take it up.
0 notes
Text
Top Certificates And Certifications In Analytics, Data Science, Machine Studying And Ai

SDS Track 1 – If you've a Bachelor’s degree in computer science or any associated subject with not much less than five years of working expertise. 360DigiTMG has grown into a massive collection of programs and certifications from top sources across the world on hundreds of subjects from countless industries. Professional certifications exist across a variety of technical fields for individuals seeking to retool their expertise and get some verifiable experience. Earning one of these data science certs will help you stand out in one of the hottest careers in IT. This certification course has been created by leading researchers at the University of Washington. Consisting of each theoretical exam and sensible lectures, you'll study Prediction, Classification, Clustering and Information Retrieval among different key areas.
Several initiatives and hands-on labs are included to allow college students to apply and test the ideas taught in the courses. They are supplied with real-world data units and several exercises that require querying these knowledge units using SQL from Jupyter notebooks. Udacity has partnered with trade leaders like Tableau, Kaggle, and IBM Watson, to make sure these packages include in-demand expertise that trade recruiters search for. They additionally provide customized profession providers to the students like coaching classes, interview prep advice, resume and profile evaluation and so forth.
Data science certifications are an effective way to gain an edge because they allow you to develop expertise which are onerous to find in your desired business. They're also an approach to validate your expertise, so recruiters and hiring managers know what they’re getting on the occasion that they hire you. Taught by Amarnath Gupta, Director, Advanced Query Processing Lab; Mai Nguyen, Lead for Data Analytics and Ilkay Altintas, Chief Data Science Officer. Learn to collect, clear and analyze big information and carry out large scale information evaluation and present the information in a convincing and visual method. Become acquainted with important tools for training Data Scientists similar to Unix/Linux, git and GitHub, and RStudio. Explore statistical ideas such as likelihood, inference, and modeling and apply them in practice.
Each of them has gone through a rigorous choice process that features profile screening, technical analysis, and a coaching demo before they're certified to train for us. We additionally make positive that only these trainers with a high alumni score remain in our school. Furthermore, having some expertise with architecting AWS Big Data companies and 5 years of expertise in knowledge analytics is very beneficial. Exploratory Data Analysis and Visualization – requiring a background in programming, this data science course in hyderabad course will develop foundations in data visualization, notion of discrete and continuous variables, and much more. Algorithms for Data Science – requires primary information on programming, calculus, and algebra. This course will dive into information organization, modeling, sorting, linear programming, and far more.
It’s transforming schooling, healthcare, journey, and politics—to name only a few. Those who can work with and leverage data are seen as extraordinarily valuable, and companies both massive and small are turning to information analysts to help them secure an aggressive edge. Python is used on this course, and there are many lectures going by way of the intricacies of the assorted Data Science libraries to work via real-world, attention-grabbing issues. This is certainly one of the solely Data Science programs round that actually touches on every half of the data science process.
Advance your profession in analytics by learning Tableau and how to best use this coaching in your work. This Deep Learning course with TensorFlow certification training is developed by industry leaders and aligned with the latest finest practices. You’ll grasp deep studying concepts and models using Keras and TensorFlow frameworks and implement deep studying algorithms, getting ready for a career as Deep Learning Engineer. An information analyst certification is priced if you are planning a career in data analytics. It is important to have the proper academic background and training for what you plan on doing as an information analyst. The area of data evaluation – its finest practices, standards, and technologies – is persistently involving.
DASCA, quick for Data Science Council of America, is the foremost provider of worldwide recognized Data Science certifications. It's SDS , and PDS credentials are two of the top international data scientist certifications. The SAS Advanced Analytics Certification not only assesses a candidate’s capacity to use superior analytics methods for fixing crucial business issues but also presents the chance to be taught the most recent choices in the identical. The SAS Big Data Certification assesses a candidate for the flexibility to make use of the know-how and instruments for handling huge information. Both instructor-led coaching and self-paced e-Learning modes of studying can be found for aiding candidates in preparation for this certification examination. This Professional Certificate is open for anyone with any job and educational background.
Rockhurst’s Helzberg School of Management presents a novel method to the Data Science certificate. Students are introduced with new datasets each week and tools to analyze them, constructing predictive fashions, dynamic dashboards, and the ability to current conclusions to non-technical viewers. This certificate requires 5 credit hours of stipulations, 6 credit score hours of core programs in enterprise intelligence, applied information mining, and knowledge visualization. Students then select both the info science and business analytics observe or the enterprise intelligence track, and fill an additional 6 credit hours in that track. Lewis presents a web-based graduate certificate in Data Science that students might complete in as little as 1 yr. Applicants should have an undergraduate GPA of 3.zero and a few undergraduate work in calculus.
Individuals with prior experience can try programs that uncover how data science integrated with ML, Deep Learning and other areas to solve real-life problems. For those that are looking for Data Science programs with real-life examples, this course from Udemy is the best suited choice available for you. It’s not like other common data science courses; this course will take you on a deep dive into the core concepts of Data Science. It is not going to only provide you a full overview of the data science journey but additionally offers you the first hand expertise of the ache that Data Scientist goes by way of every day.
Machine Learning is a very broad subject and turning into an expert in this field could be very challenging. This data science training in hyderabad on Udemy provides a clear pathway into the world of machine studying so individuals can study complex principles, algorithms and coding libraries in a simple and effective method. The course supplies instruction in both Python and R programming languages, which may be very distinguishing in itself. It has around a hundred,000 5-star ratings and more than 665,000 college students enrolled, making it the preferred Udemy Data Science course.
In this course, we will meet some Data Science practitioners and we are going to get a summary of what data science is today. Whether you’re looking to begin a new profession, or change your current one, Professional Certificates on 360DigiTMG allow you to turn into job ready. Apart from pre-recorded video lectures, there are auto-graded and peer-reviewed assignments. Last half focuses on the significance of communication in Data Science presentations together with suggestions and methods to effectively current your findings. Learners can apply for various job titles after the completion of this certification corresponding to Data Scientist, Data Analyst, Systems Analyst, Business Intelligence Analyst, Data Engineer etc.

For more information
360DigiTMG - Data Analytics, Data Science Course Training Hyderabad
Address - 2-56/2/19, 3rd floor,, Vijaya towers, near Meridian school,, Ayyappa Society Rd, Madhapur,, Hyderabad, Telangana 500081
099899 94319
https://g.page/Best-Data-Science
Read more
data scientists must avoid fallacies
data science fundamental concepts for marketers
how is data science related to business
data vault modeling and its importance
data science and business intelligence
essential interests for a data scientist
data leverage a technique to penetrate saturated markets
surge in data science job vacancies amidst covid-19
data science the career of future
can artificial intelligence curb the spread of covid-19
0 notes
Text
Foundations of BI: Recap
I recently have finished content from the last week of my FBI class at Full Sail University, In completing this critical piece of my BI Master’s program, I have reflected on the following points:
• Judging a Book by its Cover: It was certainly more effort than one would assume with a title like (Foundations…), you need to be active everyday within the course material (Textbook) and assignments in order to keep pace with such a high-velocity and impactful class, • Already Paying Off: My direct Supervisor recently noticed and commented on how better prepared and more organized I was after starting courses (Particularly this one) here at Full Sail University, • For Challengers Only: You need to rise to the occasion with these courses, as they cover a large amount of ground (And quickly!), you will be learning about one aspect of BI one week, and a completely different approach and methodologies the next, • Truly Rewarding: Looking back 4-weeks ago I had never imagined to have traveled so far and made the waves I have, and am grateful I have stuck with completing, and meeting the expectations made of me.
Here are the highlights of what I learned, (Within just this course):
• Visio: Diagramming, shaping, and transforming information on a professional level, • ERP (Enterprise Resource Planning): Without it I don’t believe we would have the companies we work for today, • Purpose of BI: Is to operationalize data, and create actionable results that have a lasting impact on the organizations journey, • BI Products and Vendors: I thought I knew all of the vendors for BI out in the world today, after taking this course I have nearly 12-times the number of vendors I have a knowledge and understanding of, not to mention their panoply of products.
Lastly, from this course I believe I will be able to apply my knowledge of BI Systems and their uses, Visio for effective diagrams and presentations, and my technical knowledge of the BI vendors such as: Domo, Tableau, MS SQL Server, Oracle Crystal Reports, and others.
To increase my professional offering, and continue my journey towards mastery.
Thank you, for your commitment to my excellence.
Matthew Jones, BS • Student - BIMS • [email protected]
1 note
·
View note
Text
The Best Data Science Jobs for a Fulfilling Career
If you are a budding data scientist, or you are looking to advance your career in the domain of data science, then you might wonder about its career prospects. What is the growth trajectory? What are the most fulfilling roles and how do you go about charting your career roadmap?
The good news is that the demand for data scientist roles continues to grow, thanks to the emergence of big data, analytics and machine learning (ML). The data scientist role is certainly not new. But it is constantly evolving to suit industry demands and trends.
The modern data scientist is a new breed. An analytical expert, a problem solver and a naturally curious person. Think of it is a combination of mathematics, computer science and trend spotting. Since data scientists have the best of both – IT and business, they are highly sought-after and generously paid.
As the tech trends evolve, so do the opportunities and career paths. How do you make the most of this boom?
To leverage this opportunity, let’s look at the best data science jobs that are trending on job boards and LinkedIn:
The Data Analyst Much like a detective, a data analyst interprets data and breaks it down into information that is easily digestable and useful for stakeholders. This information has great value, asit can help stakeholders to make well informed, data-driven business decisions. Your daily responsibilities might include tasks such as :
extracting data from an SQL database
using Tableau or Excel at a specialist level
building basic visualization or reporting dashboards
And more! The technical skill-set required is diverse and covers the full spectrum of data science. You need expertise in languages such as R, Python, SQL and C.
Asthe name suggests, it is a highly analytical role. So, if logic, numbers and a figure-it-out attitude is your jam, then go for it!
The Data Engineer When enterprises reach a point where they have vast amounts of big data, they need a data engineer to make sense of it all. The data engineer sets up the infrastructure that the company will need to organize this data.
Typically, the job involves building massive pools for big data. That is, developing, constructing, testing and maintaining architectures like databases and large-scale data processing systems.
As a data engineer, you need to make sure that the architecture supports the core business needs, those of the data scientists and the stakeholders. For this role, strong software engineering skills are more important than ML and core statistics.
The Machine Learning Engineer The ML engineer has mastered the science of using data to build predictive models. These models are used for automating of processes. These processes can be anything from image classification, speech recognition, market forecasting to software testing.
There is high demand for the machine learning engineer as companies rush in to make the most of the emergent wave.
As an ML engineer, you will need to have the following core skills:
Computer programming
Probability and statistics
Data modelling and evaluation
Applying ML algorithms and libraries
System Design and Software Engineering
ML frameworks
The Generalist The Data Science Generalist is quite a popular role. Many companies hire for this opportunity to work with a team of data scientists. It is likely that the hiring company needs data science but is not a data company, or may not build data-driven products.
This role demands a combination of data analysis, production code, visualization and more. Some key skills include a working knowledge of big data tools and experience working with data sets. Currently, data science generalists dominate the job market space as there are a variety of niches that require the ‘generalist’ as opposed to the ‘specialist’ profile.
The great thing about being a data science generalist is the breadth of experience. You will get involved in various phases of data science project lifecycle at some point. This gives you great flexibility in terms of a career move, and you can always make a lateral move somewhere down the line when an opportunity comes up.
Many experts believe that it is important to develop generalist skills in combination with specialist skills as you can add more value to your role with this blend.
Last but not least, when searching for your ideal data science job, do read the descriptions thoroughly. Often there is an overlap of skills between roles and ‘data scientist’ is often used as a blanket terminology. If you are preparing for a specific role, going through the job boards will enable you to understand the skills you need to work on.
The post The Best Data Science Jobs for a Fulfilling Career appeared first on Elevano.
source https://www.elevano.com/the-best-data-science-jobs-for-a-fulfilling-career/ source https://elevanocom.tumblr.com/post/182999189331
0 notes
Text
The Best Data Science Jobs for a Fulfilling Career
If you are a budding data scientist, or you are looking to advance your career in the domain of data science, then you might wonder about its career prospects. What is the growth trajectory? What are the most fulfilling roles and how do you go about charting your career roadmap?
The good news is that the demand for data scientist roles continues to grow, thanks to the emergence of big data, analytics and machine learning (ML). The data scientist role is certainly not new. But it is constantly evolving to suit industry demands and trends.
The modern data scientist is a new breed. An analytical expert, a problem solver and a naturally curious person. Think of it is a combination of mathematics, computer science and trend spotting. Since data scientists have the best of both – IT and business, they are highly sought-after and generously paid.
As the tech trends evolve, so do the opportunities and career paths. How do you make the most of this boom?
To leverage this opportunity, let’s look at the best data science jobs that are trending on job boards and LinkedIn:
The Data Analyst Much like a detective, a data analyst interprets data and breaks it down into information that is easily digestable and useful for stakeholders. This information has great value, asit can help stakeholders to make well informed, data-driven business decisions. Your daily responsibilities might include tasks such as :
extracting data from an SQL database
using Tableau or Excel at a specialist level
building basic visualization or reporting dashboards
And more! The technical skill-set required is diverse and covers the full spectrum of data science. You need expertise in languages such as R, Python, SQL and C.
Asthe name suggests, it is a highly analytical role. So, if logic, numbers and a figure-it-out attitude is your jam, then go for it!
The Data Engineer When enterprises reach a point where they have vast amounts of big data, they need a data engineer to make sense of it all. The data engineer sets up the infrastructure that the company will need to organize this data.
Typically, the job involves building massive pools for big data. That is, developing, constructing, testing and maintaining architectures like databases and large-scale data processing systems.
As a data engineer, you need to make sure that the architecture supports the core business needs, those of the data scientists and the stakeholders. For this role, strong software engineering skills are more important than ML and core statistics.
The Machine Learning Engineer The ML engineer has mastered the science of using data to build predictive models. These models are used for automating of processes. These processes can be anything from image classification, speech recognition, market forecasting to software testing.
There is high demand for the machine learning engineer as companies rush in to make the most of the emergent wave.
As an ML engineer, you will need to have the following core skills:
Computer programming
Probability and statistics
Data modelling and evaluation
Applying ML algorithms and libraries
System Design and Software Engineering
ML frameworks
The Generalist The Data Science Generalist is quite a popular role. Many companies hire for this opportunity to work with a team of data scientists. It is likely that the hiring company needs data science but is not a data company, or may not build data-driven products.
This role demands a combination of data analysis, production code, visualization and more. Some key skills include a working knowledge of big data tools and experience working with data sets. Currently, data science generalists dominate the job market space as there are a variety of niches that require the ‘generalist’ as opposed to the ‘specialist’ profile.
The great thing about being a data science generalist is the breadth of experience. You will get involved in various phases of data science project lifecycle at some point. This gives you great flexibility in terms of a career move, and you can always make a lateral move somewhere down the line when an opportunity comes up.
Many experts believe that it is important to develop generalist skills in combination with specialist skills as you can add more value to your role with this blend.
Last but not least, when searching for your ideal data science job, do read the descriptions thoroughly. Often there is an overlap of skills between roles and ‘data scientist’ is often used as a blanket terminology. If you are preparing for a specific role, going through the job boards will enable you to understand the skills you need to work on.
The post The Best Data Science Jobs for a Fulfilling Career appeared first on Elevano.
source https://www.elevano.com/the-best-data-science-jobs-for-a-fulfilling-career/ source https://elevanocom.blogspot.com/2019/02/the-best-data-science-jobs-for.html
0 notes
Text
The Best Data Science Jobs for a Fulfilling Career
If you are a budding data scientist, or you are looking to advance your career in the domain of data science, then you might wonder about its career prospects. What is the growth trajectory? What are the most fulfilling roles and how do you go about charting your career roadmap?
The good news is that the demand for data scientist roles continues to grow, thanks to the emergence of big data, analytics and machine learning (ML). The data scientist role is certainly not new. But it is constantly evolving to suit industry demands and trends.
The modern data scientist is a new breed. An analytical expert, a problem solver and a naturally curious person. Think of it is a combination of mathematics, computer science and trend spotting. Since data scientists have the best of both – IT and business, they are highly sought-after and generously paid.
As the tech trends evolve, so do the opportunities and career paths. How do you make the most of this boom?
To leverage this opportunity, let’s look at the best data science jobs that are trending on job boards and LinkedIn:
The Data Analyst Much like a detective, a data analyst interprets data and breaks it down into information that is easily digestable and useful for stakeholders. This information has great value, asit can help stakeholders to make well informed, data-driven business decisions. Your daily responsibilities might include tasks such as :
extracting data from an SQL database
using Tableau or Excel at a specialist level
building basic visualization or reporting dashboards
And more! The technical skill-set required is diverse and covers the full spectrum of data science. You need expertise in languages such as R, Python, SQL and C.
Asthe name suggests, it is a highly analytical role. So, if logic, numbers and a figure-it-out attitude is your jam, then go for it!
The Data Engineer When enterprises reach a point where they have vast amounts of big data, they need a data engineer to make sense of it all. The data engineer sets up the infrastructure that the company will need to organize this data.
Typically, the job involves building massive pools for big data. That is, developing, constructing, testing and maintaining architectures like databases and large-scale data processing systems.
As a data engineer, you need to make sure that the architecture supports the core business needs, those of the data scientists and the stakeholders. For this role, strong software engineering skills are more important than ML and core statistics.
The Machine Learning Engineer The ML engineer has mastered the science of using data to build predictive models. These models are used for automating of processes. These processes can be anything from image classification, speech recognition, market forecasting to software testing.
There is high demand for the machine learning engineer as companies rush in to make the most of the emergent wave.
As an ML engineer, you will need to have the following core skills:
Computer programming
Probability and statistics
Data modelling and evaluation
Applying ML algorithms and libraries
System Design and Software Engineering
ML frameworks
The Generalist The Data Science Generalist is quite a popular role. Many companies hire for this opportunity to work with a team of data scientists. It is likely that the hiring company needs data science but is not a data company, or may not build data-driven products.
This role demands a combination of data analysis, production code, visualization and more. Some key skills include a working knowledge of big data tools and experience working with data sets. Currently, data science generalists dominate the job market space as there are a variety of niches that require the ‘generalist’ as opposed to the ‘specialist’ profile.
The great thing about being a data science generalist is the breadth of experience. You will get involved in various phases of data science project lifecycle at some point. This gives you great flexibility in terms of a career move, and you can always make a lateral move somewhere down the line when an opportunity comes up.
Many experts believe that it is important to develop generalist skills in combination with specialist skills as you can add more value to your role with this blend.
Last but not least, when searching for your ideal data science job, do read the descriptions thoroughly. Often there is an overlap of skills between roles and ‘data scientist’ is often used as a blanket terminology. If you are preparing for a specific role, going through the job boards will enable you to understand the skills you need to work on.
The post The Best Data Science Jobs for a Fulfilling Career appeared first on Elevano.
Via https://www.elevano.com/the-best-data-science-jobs-for-a-fulfilling-career/
source http://elevanocom.weebly.com/blog/the-best-data-science-jobs-for-a-fulfilling-career
0 notes
Link
As companies get bigger and bigger, odds are who has access and owns what information is going to get more and more fragmented — and the risk of the last person knowing how to do something, like knowing a code base, leaving the company starts to become a real existential threat.
One way to fix that is, obviously, to ensure that people are talking to each other. But since that usually won’t be the case once companies hit the thousands of employees, Adam Weinstein and his co-founders Patrick Farrell and Jason McGhee started a company called Cursor that’s designed to help make that problem a little easier internally. Cursor serves as a sort of internal search tool for information, whether that’s inside SQL queries, database metadata, existing platforms like Tableau and others. The whole goal there is to reduce the communication gap between employees to as close to zero as possible, and ensure that it’s not just a single person that knows how to get something done that’s constantly inundated with requests.
“Silicon Valley has a way of putting on rose tinted glasses,” Weinstein said. “What I found was, even in the leadership of analytic functions, everyone had this problem. There’s been such a sprawl of software in general that data and the knowledge behind it [is fragmented]. If you use Mixpanel and Google Analytics, each has some level of data protections, and the ability to cross them is increasingly a problem. It gets more and more difficult as a business grows to extract value at an aggregate level. There’s this challenge we don’t have someone who can keep track of it. If somebody was a knowledge person on each team, and they even took a vacation, that was a risk.”
The startup said today that it has raised $2 million in a financing round from Toba Capital, with participation from Ride Ventures and several angel investors, and is launching its Cursor data search and analytics hub.
Cursor more or less behaves like a search engine internally. Users can search for information, which will surface up anything from a Tableau worksheet to an actual segment of SQL. Users can then comment on the information coming up from those searches, which are tagged with metadata to help employees find that information more easily. The idea is that if someone over on one side of a production team needs something (like a segment of code), they should have some kind of intuitive way for finding it rather than having to start an email chain with dozens of people on it.
Most of this was born from ideas Weinstein had when he joined LinkedIn through its acquisition of Bright in 2014. Weinstein was working with the data analytics team, but like any good engineer, was trying to “engineer himself out of a job” by making processes like these more efficient.
“If I did this right, there’s always a way to make things happen that are faster and cheaper for things around you,” Weinstein said. “I was one of our only people that dealt with litigation [in China], dealt with M&A, cost reduction efforts, and all those things. I was the limiting reagent. I became the human knowledge manager, and I thought, there has to be a solution to manage all this, and that was the idea behind Cursor.”
Already some internal search tools are becoming pretty popular, especially when it comes to programming. While it’s not an exact comparison, Sourcegraph is doing somewhat similar work in terms of making code easily searchable and find out who is working with it. It all speaks to a movement toward trying to make all this information more easily searchable and reduce the overhead in email or Slack, and it’s certainly something larger companies are going to begin noting going forward.
0 notes
Text
The Agony and the Ecstasy of Cloud Billing
The Agony and the Ecstasy of Cloud Billing
Image
Corey Quinn Tue, 04/17/2018 - 09:40
AWS
Cloud
Cloud billing is inherently complex; it's not just you.
Back in the mists of antiquity when I started reading Linux Journal, figuring out what an infrastructure was going to cost was (although still obnoxious in some ways) straightforward. You'd sign leases with colocation providers, buy hardware that you'd depreciate on a schedule and strike a deal in blood with a bandwidth provider, and you were more or less set until something significant happened to your scale.
In today's brave new cloud world, all of that goes out the window. The public cloud providers give with one hand ("Have a full copy of any environment you want, paid by the hour!"), while taking with the other ("A single Linux instance will cost you $X per hour, $Y per GB transferred per month, and $Z for the attached storage; we simplify this pricing into what we like to call 'We Make It Up As We Go Along'").
In my day job, I'm a consultant who focuses purely on analyzing and reducing the Amazon Web Services (AWS) bill. As a result, I've seen a lot of environments doing different things: cloud-native shops spinning things up without governance, large enterprises transitioning into the public cloud with legacy applications that don't exactly support that model without some serious tweaking, and cloud migration projects that somehow lost their way severely enough that they were declared acceptable as they were, and the "multi-cloud" label was slapped on to them. Throughout all of this, some themes definitely have emerged that I find that people don't intuitively grasp at first. To wit:
It's relatively straightforward to do the basic arithmetic to figure out what a current data center would cost to put into the cloud as is—generally it's a lot! If you do a 1:1 mapping of your existing data center into the cloudy equivalents, it invariably will cost more; that's a given. The real cost savings arise when you start to take advantage of cloud capabilities—your web server farm doesn't need to have 50 instances at all times. If that's your burst load, maybe you can scale that in when traffic is low to five instances or so? Only once you fall into a pattern (and your applications support it!) of paying only for what you need when you need it do the cost savings of cloud become apparent.
One of the most misunderstood aspects of Cloud Economics is the proper calculation of Total Cost of Ownership, or TCO. If you want to do a break-even analysis on whether it makes sense to build out a storage system instead of using S3, you've got to include a lot more than just a pile of disks. You've got to factor in disaster recovery equipment and location, software to handle replication of data, staff to run the data center/replace drives, the bandwidth to get to the storage from where it's needed, the capacity planning for future growth—and the opportunity cost of building that out instead of focusing on product features.
It's easy to get lost in the byzantine world of cloud billing dimensions and lose sight of the fact that you've got staffing expenses. I've yet to see a company with more than five employees wherein the cloud expense wasn't dwarfed by payroll. Unlike the toy projects some of us do as labors of love, engineering time costs a lot of money. Retraining existing staff to embrace a cloud future takes time, and not everyone takes to this new paradigm quickly.
Accounting is going to have to weigh in on this, and if you're not prepared for that conversation, it's likely to be unpleasant. You're going from an old world where you could plan your computing expenses a few years out and be pretty close to accurate. Cloud replaces that with a host of variables to account for, including variable costs depending upon load, amortization of Reserved Instances, provider price cuts and a complete lack of transparency with regard to where the money is actually going (Dev or Prod? Which product? Which team spun that up? An engineer left the company six months ago, but their 500TB of data is still sitting there and so on).
The worst part is that all of this isn't apparent to newcomers to cloud billing, so when you trip over these edge cases, it's natural to feel as if the problem is somehow your fault. I do this for a living, and I was stymied trying to figure out what data transfer was likely to cost in AWS. I started drawing out how it's billed to customers, and ultimately came up with the "AWS Data Transfer Costs" diagram shown in Figure 1.
Figure 1. A convoluted mapping of how AWS data transfer is priced out.
If you can memorize those figures, you're better at this than I am by a landslide! It isn't straightforward, it's not simple, and it's certainly not your fault if you don't somehow intrinsically know these things.
That said, help is at hand. AWS billing is getting much more understandable, with the advent of such things as free Reserved Instance recommendations, the release of the Cost Explorer API and the rise of serverless technologies. For their part, Google's GCP and Microsoft's Azure learned from the early billing stumbles of AWS, and as a result, both have much more understandable cost structures. Additionally, there are a host of cost visibility Platform as a Service offerings out there; they all do more or less the same things as one another, but they're great for ad-hoc queries around your bill. If you'd rather build something you can control yourself, you can shove your billing information from all providers into an SQL database and run something like QuickSight or Tableau on top of it to aide visualization, as many shops do today.
In return for this ridiculous pile of complexity, you get something rather special—the ability to spin up resources on-demand, for as little time as you need them, and pay only for the things that you use. It's incredible as a learning resource alone—imagine how much simpler it would have been in the late 1990s to receive a working Linux VM instead of having to struggle with Slackware's installation for the better part of a week. The cloud takes away, but it also gives.
https://ift.tt/2qENQjt via @johanlouwers . follow me also on twitter
0 notes
Text
9 Essential Platforms for CMOs to Monitor Digital Marketing
Marketing dashboards that can help you report on and analyze your marketing efforts
Like it or not, today's CMOs are married to metrics. They have to be.
From closely tracking traffic to understanding which channels may be leaking potential leads, failure to make data-driven decisions continues to be the bane of many of today's marketers. As a result, global spending on data-based marketing continues to rise and is similarly expected to spike in 2017.
As we delve deeper into an era of marketing dominating by metrics and big data, modern CMOs can't afford not to have some serious tools on deck to summarise the impact of their digital marketing. This rings especially true to understanding any combination of the following:
Which marketing channels are worth scaling and are likewise providing a positive ROI
Where leads are dropping off within your marketing funnels
Which messages and campaigns are resonating with leads versus those which are falling flat
Fortunately, CMOs have plenty of options to ensure that their ROI is sound for any given marketing campaign. While the wealth of platforms out there can certainly be overwhelming, the following list gives a comprehensive set of services including our own RACE marketing dashboard. for any marketer looking to keep a closer eye on their numbers, regardless of niche or industry.
1. Tableau
Tableau are the market leaders in providing analytics dashboards for mid-large businesses, and they thoroughly deserve their position as market leaders. Tableau can handle data inputted from excel, Google Analytics, Salesforce, SQL server, SAP, R, AWS and more, making it a flexible and versatile platform. With drag and drop functionality it's extremely to set up useful interactive dashboards to help you review marketing KPIs.
2. Cyfe – An all-in-one dashboard to conquer the many moving pieces of your marketing activity.
Wrangling a staggering amount of data from social to sales, Cyfe offers a comprehensive dashboard for those looking to get serious about their marketing metrics.
With built-in widget integration with industry giants in ecommerce, email, SEO, funnel analytics, advertising, conversion optimization, social media and CRM (Shopify, Moz, Facebook, MailChimp and Salesforce, to name a few), just about any aspect of your quantifiable business is fair game. Beyond tracking current performance in terms of sales and traffic, by allowing you to monitor activity across platforms, Cyfe also uncovers new opportunities to scale and keeps tabs on which new opportunities are won and lost, respectively.
Representing a one-stop solution offering up data in real-time, Cyfe is a must-have for CMOs looking to hold themselves accountable for every piece of their marketing arsenal.
3. Inspeclet – Make more informed marketing decisions by breaking down user behavior.
Despite the need for today's marketers to be knee deep in analytics, it's impossible to ignore the human element of any given campaign.
Rather than becoming frustrated by the seemingly unpredictable behavior of our leads, Inspeclet offers marketers an opportunity to understand what users want versus playing a guessing game.
Through recording real-time videos of visitor sessions, marketers can track their every literal movement to figure out the in's and out's of user-experience on-site. This provides opportunities to fine-tune on-site elements and marketing messages accordingly.
Paying close attention to UX can result in huge returns in terms of click-throughs, conversions and engagement. Remember that bounced traffic and poor CTR represent more than metrics: they represent money left on the table.
4. w3Counter – Emphasizing the importance of real-time data from real-time visitors.
Just as marketers are expected to capture leads in real-time, monitoring actual events on-site as they happen can help uncover which of your pages are getting the most love.
Analyzing both where traffic is landing and spending the bulk of their time, coupled with the sources where they're coming from in the first place, w3Counter paints a picture at a glance of which pages are pulling in the most leads.
The tool keeps tabs on your most popular links and provides a regular daily email of stats including crucial metrics such as total visits and return visitors.
By further breaking down direct traffic versus search engines and referring sites, for example, marketers may acknowledge which channels should be further explored and which are likewise lacking.
5. Mixpanel – The perfect platform for monitoring mobile marketing.
The rapid rise of mobile users represents a telling tale for modern marketers: you simply can't afford to ignore traffic on-the-go.
Mixpanel offers a robust solution for those looking to monitor their mobile campaigns. More specifically, the platform offers keen insight on where users may be dropping out of the funnel of your native app or mobile campaign.
By analyzing leads from Point A to Point B, including time spent in each step of your sign-up process, sign-up success rate and which channels are the most popular for bringing in leads, marketers can plug up the holes in their mobile strategies accordingly.
6. Hotjar – How heatmaps help marketers make crucial decisions.
While understanding where your users click is obviously important, the level of detail offered by heatmaps provides an extra layer of information for marketers looking to make the most of their traffic.
From eliminating distracting page widgets to making your calls-to-action pop, heatmaps uncover the elements of a powerful landing page. Similarly, heatmaps are prime tools for A/B testing when it comes to refining the design of any page on-site.
Rather than having your traffic totally miss your CTAs, heatmaps offer an avenue for ensuring that your leads take the actions that you want them to take.
7. Brand24 – Keeping an eye on buzz for socially-driven brands.
Measuring the ROI of social media oftentimes feels like a shot in the dark; likewise, the positive returns from social mentions often go beyond dollars and cents.
For those laser-focused on press and PR, Brand24 offers a straightforward solution for monitoring the voices of your audience.
Beyond social mentions, breaking down the demographics and behavior of your audience via social helps marketers craft the messages that people want to hear. In other words, you know where your leads hang out, what's on their minds and how to speak their language accordingly.
8. GetResponse – Why automated marketing deserves a keen attention to detail.
Marketing automation has the potential to transform any given brand by putting the process of capturing leads and converting customers on autopilot. That being said, optimizing your automation strategy is crucial for brands looking to actually see positive returns.
Solutions such as GetResponse have emerged to keep a close eye on both email and e-commerce metrics to ensure that leads are traveling smoothly through your funnel.
GetResponse works to not only understand the behavior of users who've gone through your funnel from A to Z, but also engages those who haven't completed the purchasing process. The ability to reduce cart abandonment not only means more sales, but also uncovers potential weak points in your marketing campaigns.
98. Smart Insights RACE – A practical reporting dashboard that harnesses the power of Google.
Modern marketers want peace of mind as they ensure that their week-to-week activities are paying off for the long-term. Smart Insights' RACE dashboard focuses on KPIs with clear metrics that measure the effectiveness of your marketing over time, whether that means week-to-week, month-to-month or year-to-year. This example dashboard funnel covers engagement across the whole funnel and there is a more detailed channel view showing month-on-month and year-on-year changes which are essential views for a CMO which are difficult to create using custom dashboards in GA.
Through integration with Google Analytics, RACE provides actionable insight for any given marketing funnel and represents an entry level solution for any marketer. Focusing on four key metrics (Reach, Act Convert and Engage), insight gleaned from the dashboard is easy to digest and can help users understand at a glance what's working and what's not.
10. Google Analytics – The classic standard for analytics still holds its own for modern marketers.
Last but not least, Google Analytics still has its place for marketers today when it comes to making marketing decisions. After all, Google Analytics integrates with many of the aforementioned platforms as the catalyst that makes them tick.
Although Google's platform may seem bare bones versus some modern platforms, its free accessibility and analysis of overlooked yet crucial metrics such as exit pages and bounce rate are incredibly relevant to today's CMOs tracking conversions.
Even if you know Google Analytics like the back of your hand, bear in mind that Google continues to update the platform on a regular basis. For example, the recent introduction of metrics such as “quality score” and “session quality” provide marketers with additional insight in regard to their site's potential to convert leads.
The Bottom Line
Again, the explosion of data-driven marketing is sending a crystal clear message to CMOs: measure everything and measure with extraordinary care. With so many platforms out there to wrangle the many moving pieces of any given marketing strategy, the power of data is in the grasp of just about any CMO willing to take the plunge and understand their leads by the numbers.
from Blog – Smart Insights http://www.smartinsights.com/managing-digital-marketing/essential-platforms-cmos-monitor-marketing/
0 notes