#salesforce acquire tableau
Explore tagged Tumblr posts
Visit Tumblr Blog
Explore Tumblr blogs with no restrictions, modern design and the best experience.
Last Seen Tumblr Blogs


Fun Fact
25% of US internet users with an annual income of $80-100K use Tumblr.
Text
When Salesforce Acquired Tableau

Salesforce acquired Tableau in June 2019 for $15.7 billion, strengthening its data analytics and visualization capabilities to deliver deeper insights for customers."
#Salesforce Tableau Acquisition#Salesforce Acquired Tableau#Tableau Acquisition Date#Salesforce Business Intelligence
0 notes
Text
QuickSight vs Tableau: Which One Works Better for Cloud-Based Analytics?
In today’s data-driven business world, choosing the right tool for cloud-based analytics can define the efficiency and accuracy of decision-making processes. Among the top contenders in this space are Amazon QuickSight and Tableau, two leading platforms in data visualization applications. While both offer powerful tools for interpreting and presenting data, they vary significantly in features, pricing, integration capabilities, and user experience.
This article will delve deep into a comparative analysis of QuickSight vs Tableau, evaluating their capabilities in cloud environments, their support for Augmented systems, alignment with current data analysis trends, and suitability for various business needs.
Understanding Cloud-Based Analytics
Cloud-based analytics refers to using remote servers and services to analyze, process, and visualize data. It allows organizations to leverage scalability, accessibility, and reduced infrastructure costs. As businesses migrate to the cloud, choosing tools that align with these goals becomes critical.
Both QuickSight and Tableau offer cloud-based deployments, but they approach it from different perspectives—QuickSight being cloud-native and Tableau adapting cloud support over time.
Amazon QuickSight Overview
Amazon QuickSight is a fully managed data visualization application developed by Amazon Web Services (AWS). It is designed to scale automatically and is embedded with machine learning (ML) capabilities, making it suitable for interactive dashboards and report generation.
Key Features of QuickSight:
Serverless architecture with pay-per-session pricing.
Native integration with AWS services like S3, RDS, Redshift.
Built-in ML insights for anomaly detection and forecasting.
SPICE (Super-fast, Parallel, In-memory Calculation Engine) for faster data processing.
Support for Augmented systems through ML-based features.
Tableau Overview
Tableau is one of the most well-known data visualization applications, offering powerful drag-and-drop analytics and dashboard creation tools. Acquired by Salesforce, Tableau has expanded its cloud capabilities via Tableau Online and Tableau Cloud.
Key Features of Tableau:
Rich and interactive visualizations.
Connects to almost any data source.
Advanced analytics capabilities with R and Python integration.
Strong user community and resources.
Adoption of Augmented systems like Tableau Pulse and Einstein AI (through Salesforce).
Comparative Analysis: QuickSight vs Tableau
1. User Interface and Usability
QuickSight is lightweight and streamlined, designed for business users who need quick insights without technical expertise. However, it may seem less flexible compared to Tableau's highly interactive and customizable dashboards.
Tableau excels in usability for data analysts and power users. Its drag-and-drop interface is intuitive, and it allows for complex manipulations and custom visual storytelling.
Winner: Tableau (for advanced users), QuickSight (for business users and simplicity)
2. Integration and Ecosystem
QuickSight integrates seamlessly with AWS services, which is a big plus for organizations already on AWS. It supports Redshift, Athena, S3, and more, making it an ideal choice for AWS-heavy infrastructures.
Tableau, on the other hand, boasts extensive connectors to a vast range of data sources, from cloud platforms like Google Cloud and Azure to on-premise databases and flat files.
Winner: Tie – depends on your existing cloud infrastructure.
3. Performance and Scalability
QuickSight's SPICE engine allows users to perform analytics at lightning speed without impacting source systems. Since it’s serverless, scalability is handled automatically by AWS.
Tableau provides robust performance but requires configuration and optimization, especially in self-hosted environments. Tableau Online and Cloud offer better scalability but may incur higher costs.
Winner: QuickSight
4. Cost Structure
QuickSight offers a pay-per-session pricing model, which can be highly economical for organizations with intermittent users. For example, you only pay when a user views a dashboard.
Tableau follows a user-based subscription pricing model, which can become expensive for large teams or casual users.
Winner: QuickSight
5. Support for Augmented Systems
QuickSight integrates ML models and offers natural language querying through Q (QuickSight Q), allowing users to ask business questions in natural language and receive answers instantly. This is a great example of how Augmented systems are becoming more mainstream.
Tableau, through its parent company Salesforce, is integrating Augmented systems like Einstein Discovery. It provides predictions and AI-powered insights directly within dashboards.
Winner: Tableau (more mature and integrated AI/ML features through Salesforce)
6. Alignment with Data Analysis Trends
Both platforms are aligned with modern data analysis trends, including real-time data streaming, AI/ML integration, and predictive analytics.
QuickSight is riding the wave of serverless architecture and real-time analytics.
Tableau is advancing toward collaborative analytics and AI-driven insights, especially after Salesforce’s acquisition.
Tableau Pulse is a recent feature that reflects current data analysis trends, helping users get real-time alerts and updates without logging into the dashboard.
Winner: Tableau (more innovations aligned with emerging data analysis trends)
7. Collaboration and Sharing
In QuickSight, collaboration is limited to dashboard sharing and email reports. While effective, it lacks some of the deeper collaboration capabilities of Tableau.
Tableau enables shared workbooks, annotations, embedded analytics, and enterprise-level collaboration across teams, especially when integrated with Salesforce.
Winner: Tableau
8. Data Security and Compliance
Both platforms offer enterprise-grade security features:
QuickSight benefits from AWS's robust security and compliance frameworks (HIPAA, GDPR, etc.).
Tableau also supports a wide range of compliance requirements, with added security controls available through Tableau Server.
Winner: Tie
9. Customization and Extensibility
Tableau offers superior extensibility with support for Python, R, JavaScript API, and more. Developers can build custom dashboards and integrations seamlessly.
QuickSight, while customizable, offers fewer extensibility options. It focuses more on ease-of-use than flexibility.
Winner: Tableau
10. Community and Support
Tableau has one of the largest user communities, with forums, certifications, user groups, and an active marketplace.
QuickSight is newer and has a smaller but growing community, primarily centered around AWS forums and documentation.
Winner: Tableau
Use Case Comparison
Use CaseBest ToolAWS-Native WorkloadsQuickSightComplex Dashboards & VisualizationsTableauOccasional Dashboard ViewersQuickSightAdvanced Analytics and ModelingTableauTight Budget and Cost ControlQuickSightCollaborative Enterprise AnalyticsTableau
The Verdict: Which Works Better for Cloud-Based Analytics?
Choosing between QuickSight vs Tableau depends heavily on your specific business needs, existing cloud ecosystem, and user types.
Choose QuickSight if you’re already using AWS extensively, have a limited budget, and need fast, scalable, and easy-to-use data visualization applications.
Choose Tableau if you need rich customization, are heavily invested in Salesforce, or have data analysts and power users requiring advanced functionality and support for Augmented systems.
In terms of data analysis trends, Tableau is more in tune with cutting-edge features like collaborative analytics, embedded AI insights, and proactive alerts. However, QuickSight is rapidly closing this gap, especially with features like QuickSight Q and natural language queries.
Conclusion
Both QuickSight and Tableau are excellent platforms in their own right, each with its strengths and limitations. Organizations must consider their long-term data strategy, scalability requirements, team expertise, and cost constraints before choosing the best fit.
As data analysis trends evolve, tools will continue to adapt. Whether it’s through more intuitive data visualization applications, AI-driven Augmented systems, or better collaboration features, the future of analytics is undeniably in the cloud. By choosing the right tool today, businesses can set themselves up for more informed, agile, and strategic decision-making tomorrow.
0 notes
Text
Salesforce to buy Informatica in $8B deal
New Post has been published on https://thedigitalinsider.com/salesforce-to-buy-informatica-in-8b-deal/
Salesforce to buy Informatica in $8B deal

Salesforce has agreed to acquire data management firm Informatica in a deal valued at around $8 billion. This includes equity value, minus Salesforce’s existing investment in the company. Informatica shareholders will receive $25 in cash per share.
The move aims to help Salesforce build a stronger foundation for AI tools that can act on their own, often called agentic AI. Informatica’s software is known for helping businesses collect, manage, and organise large sets of data – the kind of support Salesforce needs to improve its AI systems’ work in different business applications.
The deal brings together tools for organising and cleaning data (like Master Data Management and data integration) with Salesforce’s cloud platform. The idea is to make sure any AI features running on Salesforce have access to organised and secure data.
For companies using AI in daily operations, having the right data isn’t enough. They also need to know where that data came from, how it has been changed, and whether it can be trusted. That’s where Informatica’s tools come in with benefits such as:
Transparency: Informatica can show how data flows through systems, helping companies meet audit or regulatory needs.
Context: By combining Informatica’s metadata with Salesforce’s data models, AI agents will better understand how to connect the dots in business systems.
Governance: Features like data quality controls and policy settings help make sure AI systems rely on clean and consistent data.
Salesforce CEO Marc Benioff said the acquisition supports the company’s goal of building safe and responsible AI for business use. “We’re excited to acquire Informatica … Together, we’ll supercharge Agentforce, Data Cloud, Tableau, MuleSoft, and Customer 360,” Benioff said.
Informatica CEO Amit Walia said joining Salesforce will help more businesses make better use of their data.
How this helps Salesforce’s data products
Informatica’s cloud tools will plug directly into Salesforce’s core products:
Data cloud: Informatica will help ensure data collected is trustworthy and ready to use – not just gathered in one place.
Agentforce: AI agents should be able to make smarter decisions with cleaner data and better understanding of business context.
Customer 360: Salesforce CRM tools will gain data inputs, helping sales and support teams.
MuleSoft: With Informatica’s data quality and governance tools, the data passing through MuleSoft APIs should be more reliable.
Tableau: Users of Tableau will benefit from more detailed information, as the data behind the dashboards should be better organised and easier to understand.
Steve Fisher, President and CTO at Salesforce, explained the value: “Imagine an AI agent that goes beyond simply seeing data points to understand their full context – origin, transformation, quality, and governance.”
Salesforce plans to bring Informatica’s technology into its existing systems quickly after the deal closes. This includes integrating data quality, governance, and MDM features into Agentforce and Data Cloud.
The company also said it will continue to support Informatica’s current strategy to build AI-driven data tools for use in different cloud environments.
Informatica acquisition aligns with Salesforce’s strategy
Salesforce executives described the acquisition as part of a long-term plan.
Robin Washington, President and CFO, said the company targets deals like this one when it sees a clear fit for customers and a solid financial return. “We’re laser-focused on accelerated execution,” she said, pointing to sectors like government, healthcare, and finance, where the combined tools could have most impact.
Informatica’s chairman Bruce Chizen said the deal shows how long-term investment strategies can pay off. He credited private equity backers Permira and CPP Investments for their role in guiding the company toward this outcome.
Salesforce also said it plans to invest in Informatica’s partner network and apply its own sales and marketing muscle to grow Informatica’s cloud business further.
Deal terms and next steps
The boards of both companies have approved the transaction. Shareholders representing about 63% of Informatica’s voting shares have signed off and no further votes are needed. The deal is expected to close early in Salesforce’s 2027 fiscal year, pending regulatory approval and other conditions.
Salesforce will pay for the deal using a mix of cash and new debt. The company expects the deal to add to its non-GAAP earnings, margin, and cash flow starting in the second year after closing. It does not plan to change its shareholder return plans as a result of the acquisition.
(Image from Pixabay)
See also: Oracle plans $40B Nvidia chip deal for AI facility in Texas
Want to learn more about AI and big data from industry leaders? Check out AI & Big Data Expo taking place in Amsterdam, California, and London. The comprehensive event is co-located with other leading events including Intelligent Automation Conference, BlockX, Digital Transformation Week, and Cyber Security & Cloud Expo.
Explore other upcoming enterprise technology events and webinars powered by TechForge here.
#acquisition#ADD#agent#Agentic AI#agents#ai#ai & big data expo#ai agent#AI AGENTS#AI systems#ai tools#amp#APIs#applications#Artificial Intelligence#audit#automation#Big Data#billion#boards#Building#Business#business applications#california#CEO#CFO#change#chip#Cloud#cloud platform
0 notes
Text
Best Business Intelligence Platform of 2025

As businesses continue to generate vast amounts of data, the need for robust tools to analyze and interpret that data has never been more critical. Business Intelligence (BI) platforms have become indispensable in helping companies make data-driven decisions, optimize operations, and gain competitive advantages. With the rapid pace of technological advancements, businesses are constantly searching for the best BI tools that can meet their evolving needs. If you're looking for the right BI service providers in USA to help your business leverage the power of data, it's essential to stay informed about the best platforms available in 2025.
In this blog, we will explore the top Business Intelligence platforms that are expected to dominate the market in 2025, their key features, and how they can benefit your organization. Additionally, we will highlight some important considerations when selecting the right BI tool for your business.
What is Business Intelligence?
Business Intelligence (BI) refers to the technologies, processes, and tools that businesses use to analyze and present data in a way that helps decision-makers understand trends, patterns, and insights. BI tools enable businesses to collect data from different sources, process it, and turn it into actionable insights. These insights can inform strategic decisions, improve operational efficiency, and help businesses stay ahead of competitors.
Top Business Intelligence Platforms of 2025
1. Power BI by Microsoft
Microsoft Power BI has been one of the leading BI platforms for several years, and it is expected to remain a top choice in 2025. Power BI stands out for its integration with other Microsoft products, such as Excel, Azure, and SQL Server, making it an excellent choice for businesses already using the Microsoft ecosystem. The platform allows users to create powerful reports and dashboards with ease, enabling them to explore data and gain valuable insights without needing advanced technical skills.
Key Features:
Intuitive user interface
Seamless integration with Microsoft products
Extensive data visualization options
Cloud-based and on-premises deployment options
Powerful AI capabilities for advanced analytics
2. Tableau by Salesforce
Tableau, now a part of Salesforce, is another widely used BI platform that is poised for continued success in 2025. Known for its user-friendly interface and robust data visualization capabilities, Tableau allows businesses to analyze data quickly and effectively. It offers a drag-and-drop interface that simplifies the process of creating dashboards and reports. Tableau is also highly flexible, supporting both on-premises and cloud-based deployment options.
Key Features:
Advanced data visualization tools
Easy-to-use interface with drag-and-drop functionality
Integration with Salesforce and other data sources
Real-time data analysis
Strong community and customer support
3. Qlik Sense
Qlik Sense is a self-service BI tool that provides businesses with powerful data visualization and exploration capabilities. With its in-memory data processing engine, Qlik Sense allows users to perform high-speed data analysis and derive insights from large data sets. The platform is known for its associative data model, which allows users to make connections between data points in a way that traditional BI tools cannot. Qlik Sense is also highly customizable, making it an ideal solution for organizations with unique reporting needs.
Key Features:
Associative data model for deeper insights
Advanced analytics and AI integration
Intuitive drag-and-drop interface
Scalability to handle large data sets
Cloud and on-premises deployment options
4. Looker by Google Cloud
Looker, which was acquired by Google in 2020, is another BI platform that is expected to be a major player in 2025. Looker is known for its ability to provide real-time data analytics and a unified view of business data. The platform offers a modeling layer that allows businesses to define and standardize their data across the organization. Looker is particularly useful for companies with complex data environments, as it enables data teams to create custom reports and dashboards tailored to specific business needs.
Key Features:
Real-time data analytics
Strong integration with Google Cloud services
Customizable reports and dashboards
Centralized data modeling
Scalable for large organizations
5. Domo
Domo is an all-in-one cloud-based BI platform that provides businesses with a comprehensive suite of tools for data integration, visualization, and analysis. Domo stands out for its ability to handle data from various sources, including social media, CRM systems, and financial platforms. The platform offers real-time data monitoring, allowing businesses to make quick decisions based on up-to-date information. Domo’s user-friendly interface and pre-built connectors make it easy for businesses to get started without the need for extensive IT support.
Key Features:
Real-time data monitoring
Wide range of pre-built integrations
Drag-and-drop interface for easy report creation
Cloud-based for scalability
Mobile app for on-the-go access to data
6. SAP BusinessObjects
SAP BusinessObjects is a comprehensive suite of BI tools designed for enterprise-level organizations. It provides businesses with advanced data analysis, reporting, and visualization capabilities. SAP BusinessObjects is known for its ability to handle large data sets and its integration with other SAP enterprise software. The platform is highly customizable and offers a range of deployment options, including cloud, on-premises, and hybrid environments.
Key Features:
Advanced reporting and data analysis
Integration with SAP enterprise software
High scalability for large organizations
Customizable dashboards and reports
Robust security features
7. Sisense
Sisense is a cloud-based BI platform that is designed for businesses looking to analyze large and complex data sets. The platform is known for its ability to integrate with a wide range of data sources, including both structured and unstructured data. Sisense uses AI and machine learning to help businesses uncover hidden insights and trends within their data. The platform also offers easy-to-use visualization tools and can be deployed on both cloud and on-premises environments.
Key Features:
Integration with diverse data sources
AI and machine learning for advanced analytics
Powerful data visualization tools
Cloud and on-premises deployment options
High scalability for growing organizations
If you're interested in exploring the benefits of business intelligence Services for your business, we encourage you to book an appointment with our team of experts.
Book an Appointment
Why Choose Business Intelligence Services?
Choosing the right Business Intelligence services is critical for ensuring that your data strategy aligns with your business objectives. BI service providers in the USA offer expertise in selecting, implementing, and managing BI tools that will optimize your decision-making processes. With the right platform and services, you can unlock the true potential of your data, streamline operations, and improve overall business performance.
The top BI platforms of 2025, such as Microsoft Power BI, Tableau, Qlik Sense, Looker, Domo, SAP BusinessObjects, and Sisense, all offer unique features tailored to various business needs. Whether you're a small business or a large enterprise, selecting the right BI platform and services is crucial to staying competitive in the data-driven world of 2025. Take the time to explore your options, and consider partnering with a trusted BI service provider to help you navigate the complex landscape of business intelligence.
0 notes
Text
Salesforce Shines with Strong Revenue and Promising AI Innovations
https://businessviewpointmagazine.com/wp-content/uploads/2024/12/1-Salesforce-Shines-with-Strong-Revenue-and-Promising-AI-Innovations-Source-aiplusinfo.com_.jpg
Latest News
News
Stock Market Update: Nifty 50 Movement, Trade Setup, and Top Stock Picks
News
Markets on Edge: Indian Indices Dip, Bitcoin Hits Record, and Global Trends Shape the Week Ahead
News
BlueStone Jewellery Plans ₹1,000 Crore IPO with Fresh Issue and OFS
Source: aiplusinfo.com
Revenue Growth Exceeds Expectations
Salesforce Inc., the leading customer relationship management (CRM) software provider, reported robust revenue growth for its fiscal third quarter, surpassing analysts’ projections. The company announced an 8.3% rise in sales, reaching $9.44 billion on October 31. This figure exceeded the average analyst estimate of $9.35 billion, according to the data. Salesforce’s adjusted operating margin of 33.1% also outpaced expectations, which stood at 32.2%. Following the announcement, Salesforce’s stock soared by 10% in after-hours trading, reflecting investor confidence in the company’s strategy.
The company attributed its strong financial performance to its focus on operational efficiency and innovative product launches. Despite past cost-cutting measures, including workforce reductions, Salesforce has demonstrated its ability to enhance profitability while maintaining its growth trajectory. CEO Marc Benioff highlighted the company’s optimism, particularly regarding its latest artificial intelligence (AI) initiatives, which he described as the driving force behind Salesforce’s forward momentum.
AI Strategy Takes Center Stage
Salesforce Inc’s strategic pivot toward AI-powered tools has been a major highlight of the company’s vision for the future. In October, the company launched Agentforce, a new AI-driven product designed to automate tasks such as customer support and sales development. Priced at approximately $2 per agent conversation, the product has already secured a “good number” of deals, according to Executive Vice President Mike Spencer. While these initial rollouts are yet to significantly impact the company’s bottom line, they underscore Salesforce’s growing emphasis on AI integration.
The company is doubling down on its AI strategy by planning to add 1,000 employees dedicated to selling Agentforce. This hiring push comes after nearly two years of cost-cutting initiatives aimed at improving operational efficiency under pressure from activist investors. Analysts like Tyler Radke of Citigroup have praised Agentforce for reshaping the narrative around Salesforce’s CRM offerings, describing it as a transformative addition to the company’s portfolio.
Outlook and Competitive Landscape
Salesforce Inc projects revenue of $9.9 billion to $10.1 billion for the current quarter ending in January, aligning with analyst expectations. The company anticipates a 9% growth in its remaining performance obligations, a key indicator of future revenue, slightly below the 9.2% forecast. However, not all segments of Salesforce’s business experienced uniform growth. Its acquired divisions, such as Slack, Mulesoft, and Tableau, reported slower sales growth compared to previous quarters. For instance, Mulesoft’s revenue rose by just 1%, a notable drop from the 13% growth seen in the previous quarter.
Meanwhile, the company’s marketing and e-commerce division grew by 8% in constant currency, narrowly surpassing Wall Street predictions. However, this segment faces rising competition, particularly from Shopify Inc., which claims to have attracted hundreds of Salesforce clients to its Commerce Cloud platform. Despite these challenges, Salesforce’s long-term focus on innovation, particularly in AI, positions the company as a key player in shaping the future of business software.
With a renewed focus on technology and a commitment to maintaining its leadership in the CRM market, Salesforce Inc is poised to continue its upward trajectory, driven by strong investor confidence and an evolving product strategy.
Visit Business Viewpoint Magazine for the most recent information.
#marketing#salestips#hondaindonesia#salesforceadmin#business#salesmotorhonda#dayaadiciptamotora#dealermotorhondasukabumi#ptastrainternasional#oneheart#astramotor#newhondabeat
0 notes
Text
Top 10 Digital Marketing Skills You Should Learn In 2025
1. Content Marketing
Content Creation: Ability to craft compelling blogs, articles, videos, and infographics.
SEO Writing: Knowledge of keyword research, on-page optimization, and crafting search-friendly content.
Content Strategy: Planning content that aligns with business goals and audience needs.
2. Search Engine Optimization (SEO)
Technical SEO: Understanding website structure, crawling, indexing, and site speed optimization.
Link Building: Acquiring high-quality backlinks to improve domain authority.
Analytics Tools: Proficiency in tools like Google Analytics, Ahrefs, and SEMrush.
3. Social Media Marketing
Platform Expertise: Managing campaigns on platforms like Facebook, Instagram, Twitter, LinkedIn, and TikTok.
Community Engagement: Building and maintaining active communities.
Paid Advertising: Setting up and optimizing social media ad campaigns.
4. Pay-Per-Click (PPC) and SEM
Google Ads: Creating, managing, and optimizing Google Ads campaigns.
Keyword Bidding: Selecting and bidding on high-value keywords.
Campaign Analytics: Measuring ROI and refining strategies.
5. Email Marketing
Campaign Design: Writing engaging email copy and designing templates.
Segmentation: Personalizing email campaigns based on customer data.
A/B Testing: Optimizing emails for better open and conversion rates.
6. Data Analytics
Performance Metrics: Understanding CTR, conversion rates, and customer acquisition costs.
Tools: Expertise in tools like Google Analytics, Tableau, or Power BI.
Audience Insights: Analyzing customer behavior to refine strategies.
7. Web Design and Development
User Experience (UX): Designing websites that are intuitive and user-friendly.
CMS Knowledge: Experience with WordPress, Shopify, or similar platforms.
Basic Coding: Familiarity with HTML, CSS, and JavaScript.
8. Video Marketing
Production Skills: Shooting, editing, and optimizing videos for different platforms.
YouTube Marketing: SEO for video content and running YouTube Ads.
Live Streaming: Engaging with audiences via real-time video.
9. Customer Relationship Management (CRM)
Lead Nurturing: Managing relationships through platforms like HubSpot, Salesforce, or Zoho.
Customer Insights: Tracking customer interactions to refine marketing efforts.
Retention Strategies: Using CRM data for loyalty programs and re-engagement.
10. Influencer Marketing
Outreach: Identifying and partnering with influencers in relevant niches.
Campaign Management: Coordinating deliverables and tracking performance.
ROI Analysis: Measuring the impact of influencer collaborations.
1 note
·
View note
Text
Essential Strategies for Sustainable Business Growth and Analysis
In today's fast-paced market, scaling a business requires creating a company capable of evolving and enduring over time. For businesses to grow sustainably, it’s essential to plan, innovate, and efficiently manage available resources. Ongoing monitoring of performance is critical as it ensures that decisions are based on solid data, reducing potential risks while maximizing the opportunity for success. Below, we’ll explore key growth strategies for businesses, the importance of analysis, and offer insights into how to become a business analyst.
Understanding the Fundamentals of Business Growth
Business growth refers to increasing a company’s revenue, expanding its customer base, or gaining a larger share of the market. This growth can be achieved through higher sales, strategic partnerships, or mergers and acquisitions. The benefits of growth are numerous:
Competitive Advantage: A strong market position enables businesses to outperform competitors.
Increased Profits: A larger customer base and more sales lead to improved profitability.
Innovation Opportunities: Growth allows for reinvestment into the development of new products and services.
Job Creation: Expanding businesses contribute to the economy by creating more employment opportunities.
Effective Strategies for Driving Business Growth
To successfully grow, businesses employ several strategies, often examined by business analysts:
Market Penetration: Selling more existing products to current customers through enhanced marketing efforts, special promotions, or loyalty programs.
Product Development: Introducing new or improved products to satisfy customer needs can attract new buyers while retaining existing customers.
Market Expansion: Expanding into new geographical locations or targeting new customer demographics can generate additional revenue streams.
Diversification: Offering new products or services reduces reliance on one income source, though it requires careful market research and planning to manage risks.
Mergers and Acquisitions (M&A): Merging with or acquiring other businesses can facilitate rapid growth by gaining new resources, technology, and customer bases.
Measuring Business Growth: Key Metrics and Tools
To assess the effectiveness of growth strategies, businesses use a variety of metrics:
Financial Performance Indicators: Tracking sales, profit margins, return on investment (ROI), and cash flow provides a clear picture of financial health.
Customer Metrics: Monitoring Customer Acquisition Cost (CAC), Customer Lifetime Value (CLTV), and retention rates reveals how well a company attracts and keeps its customers.
Market Analysis: Conducting a competitive analysis, tracking market share, and performing a SWOT (Strengths, Weaknesses, Opportunities, Threats) analysis helps to evaluate a company’s market position.
Operational Efficiency: Analyzing employee productivity, supply chain efficiency, and the use of technology can help uncover areas for improvement.
Customer Feedback and Surveys: Surveys and customer reviews provide valuable insights into customer satisfaction and areas for product or service enhancement.
Tools for Business Evaluation and Performance Monitoring
To effectively monitor and analyze business performance, companies rely on a range of tools:
Google Analytics: Provides data on website traffic and customer behavior.
CRM Software: Tools such as Salesforce help manage customer information and improve relationship management.
Financial Analysis Software: Platforms like QuickBooks are essential for tracking financial performance and assisting with budgeting and forecasting.
Business Intelligence Tools: Software such as Power BI or Tableau helps businesses visualize data and gain strategic insights for decision-making.
Adapting Strategies for Long-Term Growth
Sustaining business growth requires constant adaptation of strategies. Startups often focus on customer acquisition, while more mature businesses may prioritize profitability and operational optimization. By consistently reviewing and refining growth strategies, businesses can maintain competitiveness and resilience in an ever-changing market landscape.
Conclusion
Business growth and analysis are intertwined. By adopting effective growth strategies and conducting thorough performance evaluations, companies can make informed decisions that pave the way for long-term success. Understanding the principles of business growth and analysis is particularly valuable for those interested in how to become a business analyst, as this role involves helping organizations achieve informed and sustainable growth.
0 notes
Text
Top 5 Data Visualization Tools Of 2024

As kids, many of us had a love for comic books, didn’t we? Whether they featured our favorite superheroes or told tales of robots in a dystopian world, comic books were a source of great enjoyment and continue to hold that appeal for many adults today.
Maybe it was the fascinating storylines that drew us in. Perhaps it was the imaginative worlds crafted by talented artists. Or it could have been the vibrant illustrations that helped us understand the characters' appearances, emotions, and expressions. Essentially, the artistic approach made the stories, morals, and information easier to grasp, don’t you think?
This same concept is applied in the business world too! However, instead of comics, businesses use charts, graphs, tables, dashboards, and other visual formats to simplify complex information.
This is where Data Visualization Tools come into play. If your company is in need of such tools, check out our list of the top 5 Data Visualization Tools for 2024. Keep reading!
We’ve all heard the saying, "A picture is worth a thousand words."
You’ve probably experienced the truth of this statement when admiring a Renaissance painting, marveling at modern art, or enjoying the stunning portraits by photographers.
Even everyday photographs can evoke memories of joyous gatherings, vacations, special occasions, transformative experiences, or feelings of nostalgia and melancholy, right? Images have a unique power to convey information, emotions, and ideas.
The reality is that pictures can tell stories in ways that plain text simply cannot. They also have the added benefit of being visually appealing, which facilitates quicker and more effective learning. Businesses have recognized this and have started incorporating visuals into their workflows.
Data Visualization Tools empower professionals to transform quantitative data and metrics into visually engaging formats like charts, graphs, reports, dashboards, infographics, and more. These tools also help track key performance indicators (KPIs) in real-time, allowing businesses to monitor progress and adjust their strategies to meet their goals.
Last year, we explored the top 5 Data Visualization Tools of 2023. Now, let’s dive into the top 5 Data Visualization Tools of 2024!
Top 5 Data Visualization Tools of 2024
Businesses use Data Visualization Tools to convert simple, quantitative data into visually appealing formats such as charts, graphs, infographics, and other mediums, enabling them to track, monitor, and adjust goals and performance in real time.
Let’s take a look at the top 5 Data Visualization Tools of 2024, presented in no particular order.
Tool 1: Tableau from Salesforce
Salesforce, which acquired Tableau for $15.7 billion in 2019, was originally founded in 1999, while Tableau was established in 2003. Salesforce, headquartered at Salesforce Tower in San Francisco, California, employs over 70,000 people across more than 100 offices worldwide. In 2022, Salesforce was recognized as the world's largest enterprise software company, and Tableau was featured in the Top 50 Analytics Products in G2’s Best Software Awards 2024.
A new addition to our list this year, Tableau is renowned as a leader in the data science arena. According to its website, “Tableau helps people see and understand data.” The platform offers rapid analytics, boasting speeds that are 10 to 100 times faster than other solutions. Tableau simplifies data exploration from spreadsheets, databases, Hadoop, and cloud services. It also features smart dashboards, enabling users to combine multiple views for deeper insights. Tableau’s user-friendly platform includes an intuitive drag-and-drop interface.
As a Salesforce product, Tableau is enhanced by Einstein AI, which extends the platform’s functionality, streamlining processes. This includes built-in data governance, security, and compliance through a user-friendly, self-service analytics cloud platform.
Tool 2: Qlik Sense
Founded in 1993 in Lund, Sweden, Qlik now has over 2,000 employees working in 45+ global offices and is headquartered in King of Prussia, Pennsylvania, USA. With more than 40,000 customers, including NHS, Lloyd’s, PayPal, Ford, and Deloitte, Qlik was named a Leader in the 2023 Gartner Magic Quadrant for Analytics and Business Intelligence Platforms for the thirteenth consecutive year.
Making its debut on our list this year is Qlik Sense, which offers a wide array of data visualization features, including interactive visualizations, advanced AI support, smart dashboards, and more. The platform delivers instant calculation performance, even on massive datasets, providing real-time insights for numerous users and the ability to modify data records on the fly.
Qlik Sense excels in data integration and allows users to perform a variety of tasks, from visualization to analysis, all within a single platform. The platform’s “associative” data engine is a standout feature, enabling users to explore their entire database from any angle within its dashboards. This is further enhanced by Qlik’s cognitive engine, which leverages machine learning to grow with users and provide suggestions on what to explore next.
Tool 3: Visme
Founded in 2013, Visme is headquartered in Maryland, USA, with around 100 employees and 27.5 million users across 133 countries. Despite its modest size, Visme has quickly earned praise, including being listed in the Top 50 Design Products in G2’s Best Software Awards 2023.
A newcomer to our list, Visme allows users to create everything from presentations, infographics, documents, graphs, and charts, to printables, videos, and graphics. The platform offers intuitive data widgets to visualize all types of data, which can be customized to meet various data visualization needs. Visme provides straightforward solutions—users simply choose a widget, input their data, style their visuals, and they’re done!
Visme is also capable of handling larger data sets, offering over 40+ professionally designed templates for charts, graphs, and maps of all continents and regions. Beyond enhancing various types of content, Visme’s Data Visualization tool is fully customizable, allowing users to align visuals with their brand’s colors and design guidelines.
Tool 4: Microsoft Power BI
Enter the industry titan—Microsoft! Founded in 1975, Microsoft boasts a workforce of over 200,000 employees. The company, headquartered in Redmond, Washington, USA, serves a global customer base, with its flagship product, Windows, commanding more than 76% of the operating system market in 2023. Microsoft was also recognized in the Gartner Magic Quadrant for Analytics and Business Intelligence Platforms in 2023.
New to our list this year is Microsoft Power BI, an exceptional Data Visualization Tool that helps users uncover powerful insights and turn them into impactful actions. This is made possible by the platform’s ability to connect and visualize any type of data. As a leader in AI, Microsoft has integrated advanced data analysis tools and a user-friendly report creation tool into Power BI.
Microsoft Power BI allows users to create datasets from any source and consolidate them into the OneLake data hub, creating a single source of truth for data. The platform also enables users to make better decisions by integrating its data visualization capabilities into Microsoft 365 products and other applications. Additionally, Power BI allows users to embed data experiences at every customer touchpoint through its unmatched interoperability with enterprise tools.
Tool 5: Google Looker Studio
It’s hard to imagine anyone hasn’t heard of Google, the company founded in 1998 and headquartered in Mountain View, California, USA. Google owns the world’s leading search engine, which held a 92.82% market share in 2023. Google and its parent company, Alphabet Inc., own over 200 companies, including Looker, which they acquired in 2020.
Returning to our list this year is Looker Studio, a platform that empowers users to unlock the full potential of their data with interactive dashboards and stunning reports, enabling smarter business decisions. The platform offers a free and easy-to-use version, with the ability to transform data into compelling visual stories through interactive reports and dashboards. These can be shared with individuals, teams, or the public through social integrations, fostering real-time collaboration and the ability to embed reports on any webpage.
Looker Studio offers a wide selection of templates and allows users to unify their data by connecting to over 800 data sources. This is made possible through Google’s 600+ partner connectors, which enable users to connect virtually any type of data without requiring coding or additional software.
Wrapping It Up
Data Visualization Tools provide businesses with the ability to turn overwhelming amounts of textual data into bright, visually appealing formats that make tracking and monitoring business performance a much more engaging activity. Instead of sifting through endless text, users can absorb crucial metrics through the effective visual aids provided by these tools.
Keep in mind that each company has its unique data visualization needs, so be sure to choose a tool that fits your specific requirements. Happy data visualizing!
0 notes
Text
Product Analytics Software Market: Surges to US$ 12.9 Billion in 2022, Propelling Towards a Projected US$ 45.2 Billion by 2032
The market for product analytics software is expected to grow at a compound annual growth rate (CAGR) of 13.3% and reach US$ 45.2 billion by 2022. By 2022, the industry is expected to bring in $12.9 billion in revenue.
Product analytics software is in high demand across many different industries, including manufacturing, automotive, healthcare, energy & utility, government, and retail. This is because the software provides vital data that can be used to identify issues, maximise efficiency, and link consumer behaviour to long-term value. For instance, the Departments of Energy (DOE), Health and Human Services (HHS), and Veterans Affairs (VA) launched a new big data analytics initiative in 2020 to organise and distribute COVID-19 data.
The rising penetration of big data technologies, cloud computing, and other advanced technologies has prompted product analytics software providers to transform services to a whole new level. The cloud-based segment is likely to offer remunerative opportunities for the global product analytics software market.
Get a Sample Copy of Report: https://www.futuremarketinsights.com/reports/sample/rep-gb-14758
Key Takeaways from the Market Study
By offering, the software segment is expected to record a 13.2% CAGR by 2032
By deployment type, the cloud-based segment to expand at a 12.7% growth rate during the forecast period
The U.S market to garner US$ 15.7 Billion and record a 13.1% CAGR from 2022-2032
Market in China to procure US$ 3.4 Billion, expanding at a 12.8% growth rate during the assessment period
“Increasing concerns with respect to improving customer behavior management to deliver personalized recommendations of products to ensure market competitiveness, which will benefit the market in the forecast period.”
Competitive Landscape
Eminent players of the global product analytics software market include International Business Machines (IBM) Corporation, Alphabet Inc., Salesforce, Oracle Corporation, and SAP SE among others. Recent key developments among players include:
In May 2022, Salesforce introduced Tableau Cloud, which includes new innovations to boost productivity by delivering intelligent, powerful and easy-to-use analytical tools to help anyone uncover insights and confidently make data-driven decisions. An integral part of the Salesforce Customer 360, Tableau empowers customers to surface and gain actionable insights from all their trusted data, creating a single source of truth, accessible anytime, anywhere.
In December 2021, Oracle announced an agreement to acquire Federos. The acquisition extends Oracle Communications’ application portfolio by adding AI-optimized assurance, analytics, and automation solutions to manage the availability and performance of critical networks and systems, expanding its ability to deliver end-to-end network and service assurance.
In March 2022, IBM announced a first-of-its-kind partnership with Celonis, the global leader in execution management, to provide cloud-based solutions to support customers in the Asia Pacific. Celonis’ technology allows organizations to find and fix the hidden inefficiencies within their disparate system landscapes and determine, based on a real-time analysis of their data, precisely where change can be most effective.
Ask an Analyst:https://www.futuremarketinsights.com/ask-question/rep-gb-14758
More Valuable Insights
Future Market Insights, in its new offering, presents an unbiased analysis of the global product analytics software market presenting a historical analysis from 2015 to 2021 and forecast statistics for the period of 2022-2032.
The study reveals essential insights on the basis of Offering (Software, Service), by Solution(Web-Based, Mobile-Based) by Deployment Type(On-Premises, Cloud-based) by Enterprise size(Large enterprises, Small & Medium Enterprises(SMEs) by Industry (Banking, Financial Services, and Insurance (BFSI), Media & Entertainment, Manufacturing, Automotive, Healthcare, Energy & Utility, Government, Retail, Others) by End User (Designers, Manufactures, Sales Professionals, Marketing Professional, Finance & Risk Professional, Others), and Region (North America, Europe, Asia-Pacific, Middle East & Africa, and Latin America)
Key Segments Covered in the Product Analytics Software Industry Survey
By Offering:
Product Analytics Software
Product Analytics Services
Professional Product Analytics Services
Managed Product Analytics Services
By Solution:
Web-based
Mobile-based
By Deployment Type:
On-Premises
Cloud-Based
By Enterprise Size:
Large Enterprises
Small & Medium Enterprises
By Industry:
Banking, Financial Services, and Insurance (BFSI),
Media & Entertainment,
Manufacturing,
Automotive
Healthcare, Energy & Utility
Government
Retail
Other Industries
By End User:
Designers
Manufacturers
Sales Professionals
Marketing Professional
Finance & Risk Professional
Other End Users
By Region:
North America
Europe
Asia-Pacific
Middle East & Africa
Latin America
0 notes
Text
Business Analytics Course In Kochi
Who is a Business Analyst?
A Business Analyst is responsible for acquiring and documenting business requirements, analyzing data and processes, and enabling communication among stakeholders to ensure that projects and initiatives fulfill business objectives and function successfully.
Opportunity for a business analyst
Business analysts have good job possibilities in a variety of industries, where they may use their abilities to promote data-driven decision-making, process improvement, and organizational strategic success.
Industries looking for business analysts
Finance and Banking
Healthcare
Information Technology
Retail
Manufacturing
Consulting
Telecommunications
Government
Energy and Utilities
Insurance
Transportation and Logistics
E-commerce
Pharmaceuticals
Hospitality
Education
Media and Entertainment
Aerospace and Defense
Automotive
Real Estate
Non-Profit
How to Become a Business Analyst
Educational Background: Bachelor’s Degree
Join a job-oriented Business Analytics Course
Asquare Job-oriented Business Analytics Course
Asquare Technologies course structure helps all the candidates to understand Business Analytics in an easy manner with lots of practical expertise a candidate will gain at the end of our Course.
The course module starts with the below topics,
MICROSOFT EXCEL FUNDAMENTALS
We are starting the course with Fundamental Excel Concepts for a 1-week program to make sure that all the candidates get hands-on Excel basics, to begin with the analytics skills.
Microsoft Excel is a versatile and powerful tool that offers a wide range of benefits for data management, analysis, and decision-making, making it essential software for professionals in various fields.
ORACLE SQL BASICS
Once the candidates are fine with Excel Fundamentals, we will be starting with 2 weeks of Oracle SQL Fundamentals with DBMS (Database Management system) concepts to understand all the DDL, DML, and TCL Commands a developer should know.
This module will give a candidate a basic idea about a database, fundamentals on why SQL Language is important and when it should be used, and so on. If a candidate is really interested in learning more about Oracle SQL, we will be sharing some more references and finally, a small assignment will be completed by each candidate at the end of the SQL Course.
BUSINESS INTELLIGENCE WITH MICROSOFT POWER BI
Now starts the real game of Analytics with good visualization skills each candidate can showcase with a knowledge-sharing session on Business Intelligence Concepts / Data warehouse concepts. Every person willing to switch their career to Analytics should be aware of all the Warehouse concepts before starting with Microsoft Power BI or Tableau Data visualization sessions. Once the DWH Concepts are clear we will start with the basics of Power BI sessions with Excel as the data source and go ahead with more advanced Excel data, Different types of visuals, and covering all the other concepts a Power BI Developer should be clear about. DAX knowledge is important for a developer to create new measures based on the business requirements. Going forward use AI visuals, Bookmarks, slicers, security, Data refresh Dashboard creation, and so on. The Power BI Training will give a candidate a thorough hands-on experience, and interactive sessions from our experts. Once the training is over all the candidates are supposed to submit an individual project presentation on the respective business domain each candidate is interested in.
SALESFORCE TABLEAU
Once the candidate is done with the Power BI Project, we are stepping into another interesting Visualization tool Tableau which has more visualization capabilities and can handle more volume of data compared to Power BI. It is better to have more than one BI Tools knowledge for a job seeker to get a job in a quicker manner either as a Power BI developer or as a Tableau Developer. Once a candidate is good in Power BI can easily adapt to Tableau. The way a candidate completes a Power BI project a similar approach is followed at the end Tableau course to do an individual project in Tableau and a review session is conducted by our experts with a rating to evaluate each candidate.
Why Asquare Technologies?
✅ISO 9001:2015 Certified ✅Affiliated To SKILL INDIA (NSDC) ✅Training By Experienced Professionals ✅Live Interactive Sessions ✅Mentorship for soft skills improvement ✅100% Placement Assistance ✅Project work and Review from Experts ✅Mock Interview program from Industry Experts ✅Internship Program for Live Project Experience
Certifications : 1. NSDC Certificate after Successful completion of Training 2. Completion Certificate from Asquare Technologies. 3. Internship Completion Certificate.
#business analytics course in kochi#business analyst course in kochi#business analytics course#business analytics jobs#business analytics training#business analytics
0 notes
Text
Can Salesforce keep up its profitability?
For a long time, just about every company was focused on growth over everything. Then, as the economy began to turn last year, that focus shifted pretty dramatically to profitability and being more financially sound. Salesforce was no different. Salesforce had been spending big over the prior years, acquiring companies like Slack for $27.7 billion, Tableau for $15.7 billion and MuleSoft for $6.5…
View On WordPress
0 notes
Text
Data Discovery Market Growth Analysis & Global Forecast: 2028
The analysis study provides a close read of current and future trends and opportunities of the worldwide global market. It highlights key product overviews and market segments of the global market. The broad assessment of fragments provided in the report will assist you with coordinating your ventures, methodologies, and groups.
Data Discovery Market is segmented by Component (Software, Services), Organization Size (Small and Mid-Sized Businesses (SMBs), Large Enterprises), Industry Vertical (Banking, Financial Services, and Insurance (BFSI), Telecommunications and IT, Retail and E-commerce, Manufacturing, Energy and Utilities) and region (North America, Europe, Asia-Pacific, Middle East and Africa and South America)

Market Overview
The Data Discovery Market is expected to grow at a CAGR of 21.9% over the forecast period 2021 to 2028.
Data discovery is the method of identifying patterns and trends in web data through data collection and analysis. It is the initial step in leveraging web data to notify future critical business decisions with valuable guided analytics. Through the discovery process, data is gathered, merged, and interpreted to provide businesses with more precise insights regarding their customers, business, and industry.
The growing importance of data-driven decision-making, growing trends in self-service Business Intelligence (BI) tools, and insight generation from a growing number of multi-structured data sources are some of the factors that have supported long-term expansion for Data Discovery Market.
Request Sample Pages of Report: https://www.delvens.com/get-free-sample/data-discovery-market-trends-forecast-till-2028
Regional Analysis
North America dominated the global data discovery market with the largest share mainly because of developed economies such as the United States and Canada. The U.S. is a key market in the region due to the early adoption of sensitive data discovery solutions.
Competitive Landscape
Key Players
Tableau Software, LLC
Datameer, Inc.
SAP SE.
Tibco Software Inc.
Cloudera, Inc.
IBM
Microsoft
Oracle
Salesforce
SAS Institute
Google
AWS
Micro Focus
MicroStrategy
Cloudera
Securiti
DataGrail
To Grow Your Business Revenue, Make an Inquiry Before Buying at: https://www.delvens.com/Inquire-before-buying/data-discovery-market-trends-forecast-till-2028
Recent Developments
May 2020 - Tableau rolled its latest version to date, 2020.2, which includes a new data model for multiple source analysis without coding or scripting as well as a feature called Metrics, which monitors key performance indicators via mobile devices. Data modeling is designed to democratize the ability to analyze complex data sets. With the new data model, Tableau will aggregate details for the analysis required.
October 2019 - Datameer, announced funding to drive global adoption of Datameer X by the data science community and importantly to launch Neebo, a cloud-native self-service solution that will enable teams of analytics professionals and data scientists to create, discover, use, and share trusted assets in hybrid landscapes.
Reasons to Acquire
Increase your understanding of the market for identifying the best and suitable strategies and decisions on the basis of sales or revenue fluctuations in terms of volume and value, distribution chain analysis, market trends and factors
Gain authentic and granular data access for Data Discovery Market so as to understand the trends and the factors involved behind changing market situations
Qualitative and quantitative data utilization to discover arrays of future growth from the market trends of leaders to market visionaries and then recognize the significant areas to compete in the future
In-depth analysis of the changing trends of the market by visualizing the historic and forecast year growth patterns
Direct Purchase of Research Report at: https://www.delvens.com/checkout/data-discovery-market-trends-forecast-till-2028
Report Scope
Data Discovery Market is segmented into component, enterprise size, industry vertical and region.
On the basis of Component
Software
Services
On the basis of Enterprise Size
Small and mid-sized enterprises
Large enterprises
On the basis of Industry Vertical
Banking, financial services and insurance
Telecommunication and IT
Retail and E-commerce
Manufacturing
Energy and utilities
On the basis of Region
Asia Pacific
North America
Europe
South America
Middle East & Africa
Read More:
About Us:
Delvens is a strategic advisory and consulting company headquartered in New Delhi, India. The company holds expertise in providing syndicated research reports, customized research reports and consulting services. Delvens qualitative and quantitative data is highly utilized by each level from niche to major markets, serving more than 1K prominent companies by assuring to provide the information on country, regional and global business environment. We have a database for more than 45 industries in more than 115+ major countries globally.
Delvens database assists the clients by providing in-depth information in crucial business decisions. Delvens offers significant facts and figures across various industries namely Healthcare, IT & Telecom, Chemicals & Materials, Semiconductor & Electronics, Energy, Pharmaceutical, Consumer Goods & Services, Food & Beverages. Our company provides an exhaustive and comprehensive understanding of the business environment.
Contact Us:
UNIT NO. 2126, TOWER B,
21ST FLOOR ALPHATHUM
SECTOR 90 NOIDA 201305, IN
+44-20-8638-5055
0 notes
Photo

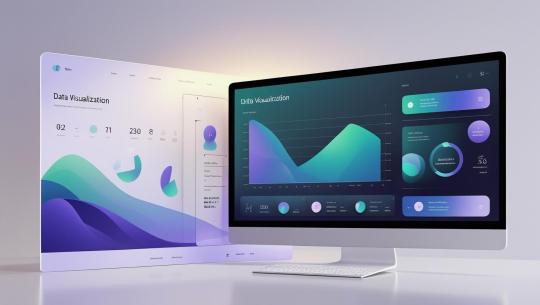
Tableau Course in Jaipur
Tableau is a powerful data visualization and business intelligence software developed by Tableau Software, which was acquired by Salesforce in 2019. Tableau allows users to connect to various data sources, visualize data, and create interactive dashboards and reports. It is widely used in industries such as finance, marketing, sales, and data analysis for gaining insights and making data-driven decisions. Learn Tableau Course in Jaipur by experts.
Here are some key features and capabilities of Tableau:
Data Connection and Integration: Tableau can connect to a wide range of data sources, including databases, spreadsheets, cloud services, and big data sources. It supports popular file formats and database systems, making it easy to access and combine data from different sources.
Data Visualization: Tableau provides a rich set of visualization tools and options to create visually appealing and interactive charts, graphs, maps, and other visual representations of data. Users can easily drag and drop data elements to create visualizations without the need for complex coding or scripting.
Interactive Dashboards: With Tableau, users can combine multiple visualizations into interactive dashboards. Dashboards allow users to create customized views, filter data, drill down into details, and perform interactive data exploration. They can be shared with others and accessed on various devices.
Data Blending and Transformation: Tableau offers features for blending and transforming data, allowing users to combine and reshape data from multiple sources. It includes built-in tools for data cleaning, filtering, aggregating, and pivoting, making it easier to prepare data for analysis and visualization.
Ad-Hoc Analysis: Tableau supports ad-hoc analysis, enabling users to explore data interactively and ask questions on the fly. Users can create calculations, apply filters, perform calculations, and apply advanced analytics functions to gain deeper insights from the data.
Collaboration and Sharing: Tableau facilitates collaboration by allowing users to publish and share their visualizations, dashboards, and reports with others. It provides options for embedding visualizations in websites, sharing via email, and integrating with enterprise systems. Users can also set permissions and access controls to manage data sharing.
Advanced Analytics: Tableau integrates with advanced analytics tools and statistical functions, allowing users to perform complex calculations, predictive modeling, and statistical analysis within the software. It also supports integration with R and Python for further data analysis and modeling.
Mobile Support: Tableau provides mobile apps for iOS and Android devices, enabling users to access and interact with Tableau visualizations on smartphones and tablets. The mobile app offers responsive design and optimized viewing experience for mobile devices.
Tableau offers different editions and licensing options, including Tableau Desktop (for authoring and creating visualizations), Tableau Server (for collaboration and sharing within an organization), and Tableau Online (a cloud-based version of Tableau Server).
#Tableau course
#Tableau Training
#Tableau Course fees
#Best Institute for Tableau Course
0 notes
Text
Tech news roundup: Cisco Live, Samsung A-series, and Salesforce acquires Tableau
Tech news roundup: Cisco Live, Samsung A-series, and Salesforce acquires Tableau
This week’s TechRepublic and ZDNet news stories include a look at the current state of 5G deployment, the severity of fake emails, and Cisco’s quest for multi-cloud connectivity.
Tech news roundup: Cisco Live, Samsung A-series, and Salesforce acquires Tableau This week’s TechRepublic and ZDNet news stories include a look at the current state of 5G…
View On WordPress
1 note
·
View note
Text
Salesforce 打算買 Tableau
Saleforce 打算要買下 Tableau…
兩邊簽了協議並且都發了新聞���出來,分別是 Salesforce 的:「Salesforce Signs Definitive Agreement to Acquire Tableau」,以及 Tableau 的:「Salesforce Signs Definitive Agreement to Acquire Tableau」。
這兩家都是掛在 NYSE 的公司,而這次的併購會直接以股票交易 (Tableau 的 1 股換 Salesforce 的 1.103 股,看起來是基於這三天股價計算):
SAN FRANCISCO, Calif. and SEATTLE, Wash. — June 10, 2019 — Salesforce (NYSE:CRM), the global leader in CRM, and Tableau…
View On WordPress
0 notes
Text
Strategies for Success in Product Analytics
The market for product analytics software is anticipated to reach US$ 45.2 billion by 2022, growing at a 13.3% CAGR during the same period. In 2022, it’s anticipated that the sector would bring in $12.9 billion.
Product analytics software is in higher demand across a variety of industries, including manufacturing, automotive, healthcare, energy & utility, government, and retail, since it provides essential information to optimise performance, diagnose issues, and link customer activity with long-term value. For instance, the Departments of Energy (DOE), Health and Human Services (HHS), and Veterans Affairs (VA) launched a new big data analytics programme to coordinate and share COVID-19 information in 2020.
The rising penetration of big data technologies, cloud computing, and other advanced technologies has prompted product analytics software providers to transform services to a whole new level. The cloud-based segment is likely to offer remunerative opportunities for the global product analytics software market.
Get a Sample Copy of Report @ https://www.futuremarketinsights.com/reports/sample/rep-gb-14758
Key Takeaways from the Market Study
By offering, the software segment is expected to record a 13.2% CAGR by 2032
By deployment type, the cloud-based segment to expand at a 12.7% growth rate during the forecast period
The U.S market to garner US$ 15.7 Billion and record a 13.1% CAGR from 2022-2032
Market in China to procure US$ 3.4 Billion, expanding at a 12.8% growth rate during the assessment period
“Increasing concerns with respect to improving customer behavior management to deliver personalized recommendations of products to ensure market competitiveness, which will benefit the market in the forecast period.”
Ask for Customization @ https://www.futuremarketinsights.com/customization-available/rep-gb-14758
Competitive Landscape
Eminent players of the global product analytics software market include International Business Machines (IBM) Corporation, Alphabet Inc., Salesforce, Oracle Corporation, and SAP SE among others. Recent key developments among players include:
In May 2022, Salesforce introduced Tableau Cloud, which includes new innovations to boost productivity by delivering intelligent, powerful and easy-to-use analytical tools to help anyone uncover insights and confidently make data-driven decisions. An integral part of the Salesforce Customer 360, Tableau empowers customers to surface and gain actionable insights from all their trusted data, creating a single source of truth, accessible anytime, anywhere.
In December 2021, Oracle announced an agreement to acquire Federos. The acquisition extends Oracle Communications’ application portfolio by adding AI-optimized assurance, analytics, and automation solutions to manage the availability and performance of critical networks and systems, expanding its ability to deliver end-to-end network and service assurance.
In March 2022, IBM announced a first-of-its-kind partnership with Celonis, the global leader in execution management, to provide cloud-based solutions to support customers in the Asia Pacific. Celonis’ technology allows organizations to find and fix the hidden inefficiencies within their disparate system landscapes and determine, based on a real-time analysis of their data, precisely where change can be most effective.
Ask an Analyst @https://www.futuremarketinsights.com/ask-question/rep-gb-14758
More Valuable Insights
Future Market Insights, in its new offering, presents an unbiased analysis of the global product analytics software market presenting a historical analysis from 2015 to 2021 and forecast statistics for the period of 2022-2032.
The study reveals essential insights on the basis of Offering (Software, Service), by Solution(Web-Based, Mobile-Based) by Deployment Type(On-Premises, Cloud-based) by Enterprise size(Large enterprises, Small & Medium Enterprises(SMEs) by Industry (Banking, Financial Services, and Insurance (BFSI), Media & Entertainment, Manufacturing, Automotive, Healthcare, Energy & Utility, Government, Retail, Others) by End User (Designers, Manufactures, Sales Professionals, Marketing Professional, Finance & Risk Professional, Others), and Region (North America, Europe, Asia-Pacific, Middle East & Africa, and Latin America)
Explore wide-ranging Coverage of FMI’s ICT Market Insights Landscape:
Customer Experience Platforms Market: The customer experience platforms market revenue totaled ~US$ 7,753.9 Mn in 2021, according to Future Market Insights (FMI).
Display Controllers Market: The display controllers market revenue totaled ~US$ 27,417.6 Mn in 2021. The display controllers market is projected to reach ~US$ 45,670.5 Mn by 2027, growing at a CAGR of 8.9% for 2022 – 27.
Gigabit Wi-Fi Access Point Market: The global gigabit Wi-Fi access point market is projected to grow at 32.3% CAGR over the forecast period (2022-2027).
Automatic Identification System Market: The global automatic identification system market is poised to top US$ 248.3 Mn in 2022.
Middle East & Africa Data Storage Market: The global automatic identification system market is poised to top US$ 248.3 Mn in 2022.
1 note
·
View note