#wpf 3d surface chart
Explore tagged Tumblr posts
Visit Tumblr Blog
Explore Tumblr blogs with no restrictions, modern design and the best experience.
Last Seen Tumblr Blogs


Fun Fact
Users from the US are the majority of Tumblr visitors.
Text
Arction The Ultimate performance enhancer
Original Source: https://arctionltd.blogspot.com/2021/03/arction-ultimate-performance-enhancer.html
Are you looking for something to help you figure out massive amount of data in a simplified manner and in a blink of an eye? Look no more because Arction Ltd. is here with its LightningChart controls. Arction Ltd has been at the top of its game in manufacturing high-performance charting components for the visualization of huge data sets since 2007 and their strive for excellence continues even 10 years down the line. The company is known for specializing in the building high performance data visualization softwares. Arction Ltd has provided its expert solutions to many government as well as renowned private organizations like Samsung, Toyota, Nokia, U.S Airforce etc.
Product Overview
Though the company provides many products and services, its star product is the LightningChart. LightningChart.Net is the GPU accelerated 2D & 3D visualization SDK which contains over 100 interactive charts with functionalities that is needed for developing applications across diverse fields like: engineering, medicine, trading, financing, space and many more.
LightningChart .NET is the fastest data visualization SDK for WPF, WinForms and UWP and its GPU accelerated charting library helps in visualizing huge amount of data in lightning speed. The lightning charting library is available for Windows Forms, .Net, web and provide the most advanced charting solutions in the industry.
LightningChart offers:
There are many excellent features which are provided by the LightningChart controls. This includes 3D Charts, Polar View, Volume Rendering, XY charts, Signal Tools, Smith Charts, Maps and Trading charts.

Let’s look at what these charts have to offer:
The 3D Chart has 3D scene settings with multiple light sources.
The series types that it offers are waterfall, rectangle planes, polygon, surface mesh and grid, mesh models, point-line, pie and bar charts. 3D models can be imported in .obj format
It can render and visualize huge surface sizes depending on the memory and space available
The Volume Rendering provides automatic and manual sampling rate for all channels.
For each channel it gives Separate Linear Transfer function It has three options available for Volume Rendering Ray function It provides modification of Voxel range which is dynamic in nature According to the voxel brightness of the channels it allocates volume thresholding accordingly
The Trading Charts includes trading data courses, technical indicators like Moving averages, Bollinger Band, RSI, MACD etc. along with drawing tools that includes Trend and regression lines, regression channels, Fibonacci arcs, fans and retracements, free-hand-annotations etc. All these features are in built in the application and the data can be loaded from rest API via file, internet, or setting by code.
Maps feature gives hundreds of world maps, continent maps and maps of specific areas.
It also provides on-line maps like street maps of specific areas. It gives multi terrain view including land, lakes, rivers, roads, cities etc. ESRI shape file data can be used to import maps.
The Signal Tools includes: SignalGenrator which is a signal generator component that combines various different waveforms into a single output SignalReader which generates real-time data signal files in many formats AudioInput and AudioOutput SpectrumCalculator which uses FFT algorithm to convert data between time domain and frequency domain
The Smith View gives series types like point-line and in normalized and absolute scales. The Polar View provides palette-colored point-line series, sectors and markers along with unlimited multiple amplitude and angle axes.
We all know that even when complex datasets are visualized in a simple and concise manner, gathering insights from them become a piece of cake. In the large ocean of data visualization tools provided by many companies, LightningChart controls by Arction Ltd stands out for obvious reasons. With advanced rendering technology and high-performance charting libraries for .NET and JavaScript, it makes its mark with outstanding execution performance. It further makes sure of utilizing memory and CPU resources efficiently while providing advanced data visualizations across platforms like web, mobile and desktop. Not only is their product amazing but also they give excellent customer service because of which they are trusted by industry leaders.
Moreover, it’s cost effective and will provide you the best value for your money. Their products and services are entirely customer centric and their commitment to their stakeholders is something to be reckoned with.
0 notes
Photo
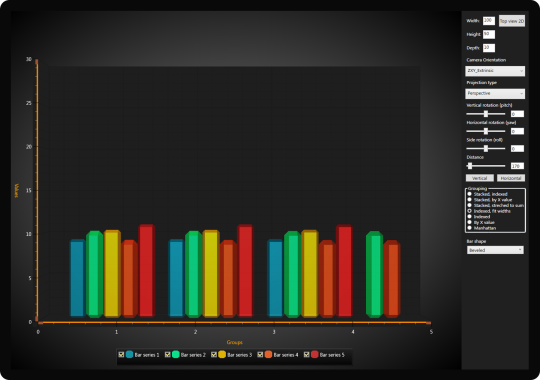
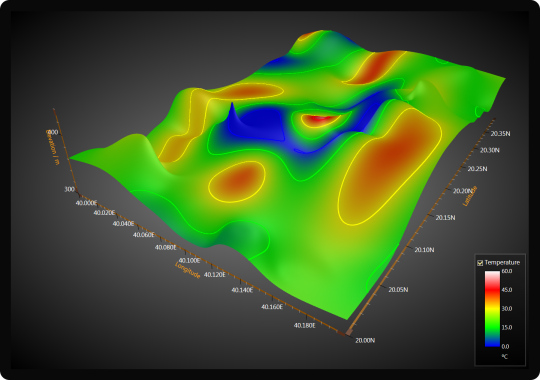
One of the most influential components of present charting system is wpf 3d surface chart. Creating different surface in 3d space is the basic purpose of it and the types of surfaces include point, bar, line, bubble, spline and many more.
#wpf 3d surface chart#wpf chart#wpf charts#wpf charting#wpf chart control#wpf charting control#fast wpf chart#fastest wpf chart#best wpf chart#best wpf charts#wpf graph control#wpf graph#wpf chart example#wpf chart examples#wpf chart library
1 note
·
View note
Text
Creating Charts Through C# using WPF
lot of people want their application to include various graphic elements that enhance the overall look and functionality of the application. This is mostly because of the reason that graphical elements do make the application much better and interesting. They have the ability to provide better assistance through the application and fulfill the requirements of the client. The major thing that is responsible for creating graphical elements in the application is WPF(windows presentation foundation). It works with a lot of programming languages to provide better graphical elements that help in displaying the information in a better way. The majority of the people use C# charts WPF to provide better chart data through the application.
About c# and charts via WPF
C# is basically a computer programming language that enables the user to create various applications and many more things through the coding of c#. It has various libraries that have different methods, which are further used while developing an application. Hence, an amazing bunch of features are provided by the c# language. There was a time when it was one of the most trending programming languages out there. Later it was replaced by different programming languages but it is still considered as one of the best programming languages of its time.
WPF (windows presentation foundation) is one of the best ways through which a person can add graphics to the application. It consists of various library elements or methods that further helps in creating a better application. It uses charts and many other graphic elements that make the application work well. The charts in WPF are majorly used to add the data in the form of a chart that can be either a bar chart or pie chart. It is the choice of the developer or the requirement of the client according to which a certain chart is added to the application or software.
Types of chart in WPF
The following are the list of various charts that are provided by the WPF:-
1. Mountain chart
2. Bar chart
3. Line chart
4. Plot chart
5. Bubble chart
6. Polygon chart
7. Column chart
8. 3D surface chart
9. Scatter chart
10. Polar chart
11. Smith chart
12. OHLC chart
These charts can be made through the WPF and can be embedded with c# programming language. Thus, it is quite amazing how this thing goes hand in hand and brings great outcomes as a well-designed application.
Working between c# and WPF
The c# and WPF both can work with another to provide a better application that has much better functionality. This is majorly done during the development process of the application. It is while writing the code when the WPF is linked to the C#. All the library functions, methods, and elements can be utilized in the c# language to create a much better application that works according to the need of the client.
0 notes
Text
C# Charts WPF Can Take Your Project To The Next Level
Original Source: https://arctionltd.blogspot.com/2020/03/c-charts-wpf-can-take-your-project-to.html
What is a Chart?
A chart is a visual representation of data. Gone are the days where one would have to physically input every piece of information that they want to feed into their chart. With the current technology available, one can easily input large amounts of information to make visually appealing charts quickly – and yet have fast runtime rendering.
What Are The Aspects That Must Be Kept In Mind Before Choosing The Right Platform For Your Charts?
Many aspects must be considered before choosing the right toolkit for your visually appealing chart that you are planning to make! Some of the most important factors to be considered are as follows:
Visual appeal: The type of chart that you are planning to use can make a big difference in the type of toolkit that you are planning to utilize. For instance, the end finish of a Bar Graph may be much more sophisticated and polished in certain types of toolkits as opposed to certain others. However, with C# Charts WPF, you can be assured that your charts come out looking posh and finished every single time.
Features: the chart toolkit must provide the visualization you are expecting, or to be easily created with the API. Heatmaps, 3D surfaces etc. are industry expectations today.
Configurability: the charts must have great set of configuration attributes (properties) to adjust the behaviour and the looks of the charts.
Performance: most chart toolkits have enough power for simple business-related power, but more advanced scientific, engineering or financial applications typically need a performance-oriented chart toolkit.
Getting a C# toolkit
Recommeded way is to Download a C# charts toolkit from C# Charts manufacturer web site, and install it. Then you will find charts in the Toolbox of Visual Studio. Alternatively you may want to use Nuget and browse the preferred C# Charts there, but note the examples and documentation are not typically available without going accessing them from manufacturer’s web site.
Why Chart?
Charting is ideal as it allows the creator to render and input a large amount of information in the form of visual representations. Especially for those projects that require the immediate attention of the reader, this is an ideal and present solution. It has been proven that visually attractive projects and pages are more likely to receive positive attention compared to those which uses large amounts of verbose data.
0 notes