
Weekly Reports of What I Did During my Time in AERO 307.
Don't wanna be here? Send us removal request.
Statistics
We looked inside some of the posts by yevbelous-blog and here's what we found interesting.
Average Info
Notes Per Post
14
Likes Per Post
3
Reblog Per Post
0
Reply Per Post
11
Time Between Posts
6 days
Number of Posts By Type
Text
10
Last Seen Tumblr Blogs


Fun Fact
Mobile Tumblr US users spend an average of 4.04 minutes per session on the app.
Text
Week 10
The week started off with an entire 3 hours devoted to water tunnel testing of surfboard fins (Monday). Looking back at our flow visualization gathered from the previous week, we noticed that some of the videos were blurry and out of focus. The reason for this was because our camera decided to be “helpful” and auto-focused, which meant that it focused on the front glass of the test section, and everything behind the front glass of the test section was nice and blurry for us (the fin, the dye, everything important). All of the top views were stellar though (go GoPro!), so we were able to keep all of the footage from our dynamic tests, but had to redo the testing with the dye. Fortunately, we were able to get a lot of practice with controlling and optimizing the dye output, as well as properly securing the fin onto its mount. Therefore, the process would be much more efficient and smooth. We filled up the water tunnel, secured the fin on its stand into the water, pressurized the dye containers, and set up our camera configuration for testing at the start of lab. The process took about 40 minutes, but we were then ready to test. We ran through multiple tests for the generic fin and the lost coast fin. We had two kinds of tests, one had dye shot over the base of the fin, while the other had dye shot towards the tip of the fin. These tests were conducted for the fin at a 0° AoA and a 45° AoA. An additional set of tests were conducted for the fins while they were being turned, to see how the flow behaves when being forced by each fin. Lastly, we tested an actual, real fin that Tynan had provided us with to verify that our 3D printed fins behaved accurately as a real fin would. Once all of these tests were finished, we drained the water tunnel and cleaned up the area around the water tunnel. We closed up the water tunnel, tarped it, and secured the tarp so that it wouldn’t fly away. The testing and cleaning up took about an hour and 40 minutes, leaving us with 30 minutes of class for Monday. Matt and I shared the video files with each other and we made a plan for what we would do to prepare for our presentation. Matt would edit the dynamic test videos, and Will would set up the presentation and all the background slides for our presentation. I took all of the video footage that included any testing with dye and would edit both the side and top views of our data. I spent about 4 hours on Monday night, and then an additional 4 hours on Tuesday (2 hours in my supersonics class, and 2 hours in structures) getting all the files completed. In total I had 48 videos created. These were then compressed into 12 videos that displayed comparisons (4 sections per video). On Tuesday evening, we put all of our data together into the presentation and finished the presentation. All of Wednesday was devoted to group presentations and I feel like we did really well! Also Tynan was a sweetheart and brought donuts for everyone! (That’s TA goals right there).
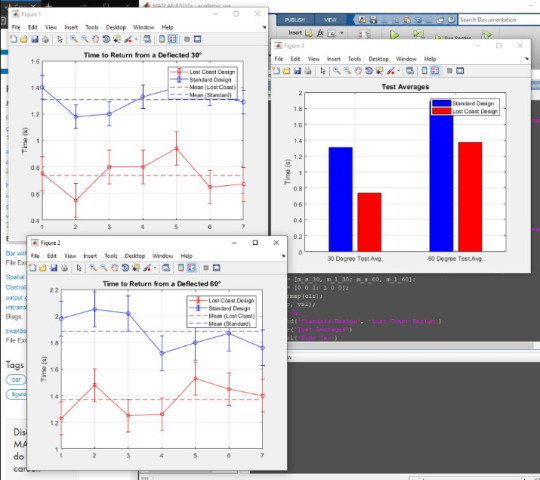
Matlab generated data of the dynamic testing. The Lost Coast fin turned quicker and easier than a generic fin did.
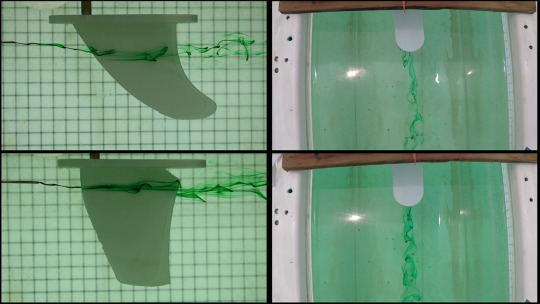
Final video edit of the generic fin vs the Lost Coast fin. (Sorry I tried to upload the .gif of it, but Tumblr wouldn’t allow me to because the file was too big).
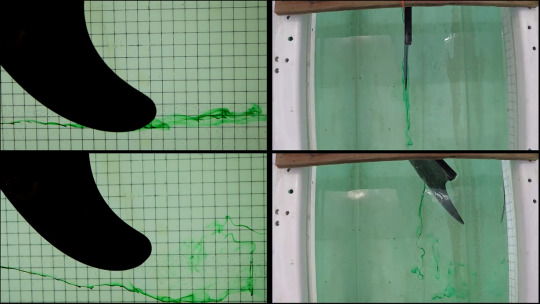
Final video edit of the real fin to compare to our 3D printed fins. (Again, Tumblr wouldn’t allow me to post the .gif because the file size was too large).
Looking back on this quarter of AERO 307, there were definitely some ups and downs, but I did end up learning more about aerodynamics (success). Coming into this quarter, I had no idea how to use XFOIL, work with the sting in the wind tunnel, and I knew almost nothing about water tunnel testing. I have been able to learn how to competently use XFOIL now. I am also very familiar with a lot of the tools that we have in the air tunnel and how to use them. Additionally, four weeks of water tunnel testing has given me enough experience to understand how to work with dye in a tunnel as well as what I am looking for in the flow visualization. For example, I had no understanding of what a wake was coming off of a wing, as well as why recirculation occurred near different bodies, but I feel like I can now somewhat defend myself if I were to be placed into an argument about said topics. Some things that may still confuse me about aerodynamics would be phenomena from compressible flow and why things happen the way they do when examining supersonic and hypersonic flow. I understand and know what happens for compressible flow properties, but it is hard to understand the theory behind it all. Then again, this is not a topic that was covered much in AERO 307, but I feel like I understood the topics we went over in 307. The highlight of this quarter has been working with the Lost Coast Fin Company (pretty much Tynan) and doing water tunnel tests on different kinds of fins. It was awesome that my group and I were able to compose our experiment ourselves and not have to follow exact guidelines. It was really cool being able to see how flow acts over surfboard fins and the differences between each fin. The lowlight of this quarter was one day when Kendrick and I were doing a water tunnel test over a Boeing 777, and our test didn't go well at all. Afterwards, there was some miscommunication about cleaning up and we didn't do our job properly when leaving the water tunnel. That was disappointing for myself (and for Doig), but it was definitely something to learn from and grow from. I believe that my future in Aerospace Engineering might be centered around controls. I really enjoyed the topics that have been covered in both of the controls classes that I have taken so far and I plan on taking the advanced controls class with Dr. Mehiel. If controls does not end up being something that I am into then I would most likely choose aerodynamics as my next choice! Thank you Dr. Doig and Tynan for all your help throughout this quarter!
2 notes
·
View notes
Text
Week 9
Monday was Memorial Day, and this meant no school, which also meant no class that day. I spent the weekend and Monday messaging Will and Matt, creating a plan for how we would do our fin water tunnel testing on Wednesday and creating a stand that would hold the fin.

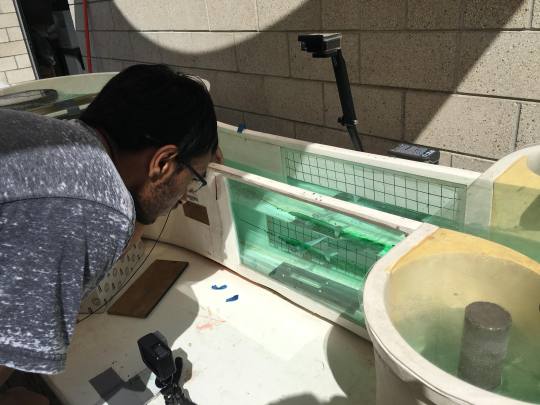
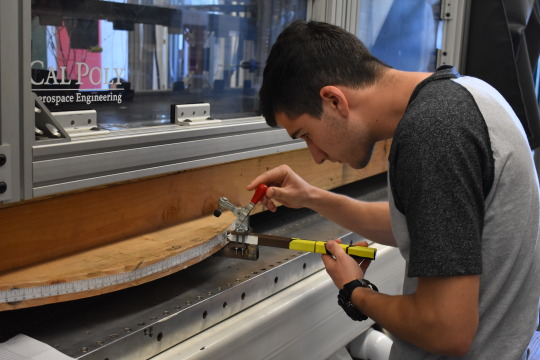
Wednesday was devoted for testing. Matt, Will, and I met in the tunnel at the start of class. Will and Matt were able to come a bit before class started to put together the stand for the fin. Unfortunately, I was at work right up until 11:45, so I couldn’t get to lab right until the start time at 12. When I got there, Will was finishing up the stand. He took a bearing out of a fidget spinner and attached it to a dowel. That bearing was then connected to a sheet of wood on the outer diameter, and the dowel itself on the inner diameter. One end of the dowel would then be used for adjusting the rotation of the fin, while the other end was connected into the fin itself. Matt brought his camera for recording and both of the 3D printed fins that he had printed for us last week. I came with 2 GoPros, a bunch of stands for the GoPros, and a positive attitude. :D We spent the first hour and a half just getting everything set up, and dealing with minor consequences that came up. Initially, the outlets that we were using as a power source for the water tunnel were not producing enough voltage to power the tunnel, so we had to look around for an extension cord and a capable power outlet. Afterwards, setting up the position of the cameras became a hassle because the GoPro stand that I was planning on using for the top view had broken and I spent time trying to find a different stand to get the job done. Then we changed the graph paper background to a more defined, nicer-looking one, and set up some light sources from the back. We finally got everything ready to run and began pumping the dye with pressure and the pressure pump handle broke off, and we spent about 20 minutes fixing it. After all of this, we were finally ready to run and began testing. Our first series of tests were dynamic tests which did not include ejecting any dye into the tunnel. We obtained a plethora of data of how both fins react when yawed at a certain angle and let go to reach their equilibrium positions. Once the dynamic tests were done, we began our static testing. This included outputting dye through the test section to go over the fin. We tested the dye at the tip and the base of each fin at a static position. Afterwards, we tested the dye at each fin while the fins would turn in a yaw direction, to simulate a surfer shreddin’ the gnar. We finished our testing and decided that we would come in again to spend all of Monday of next week for more tests to do more specific visualization for Lost Coast Fins. Lastly, we cleaned up the tunnel, packed everything away, and concluded our session on Wednesday.
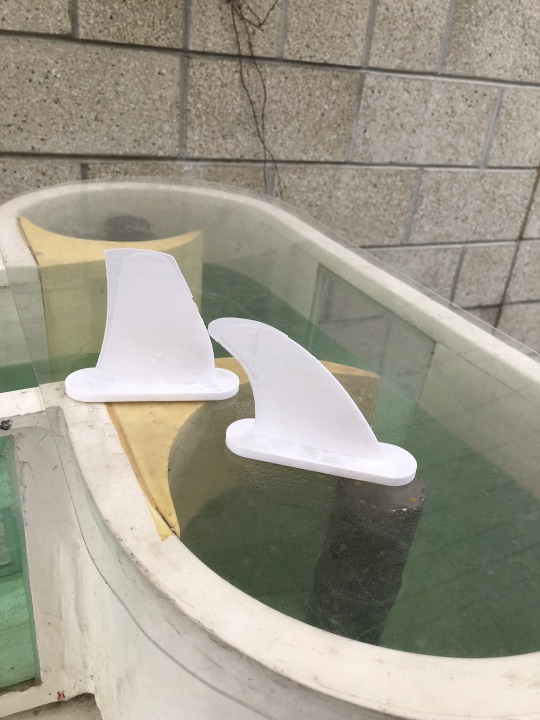
3D printed fins brought by Matt. Left Coast design on the left. Generic fin on the right.
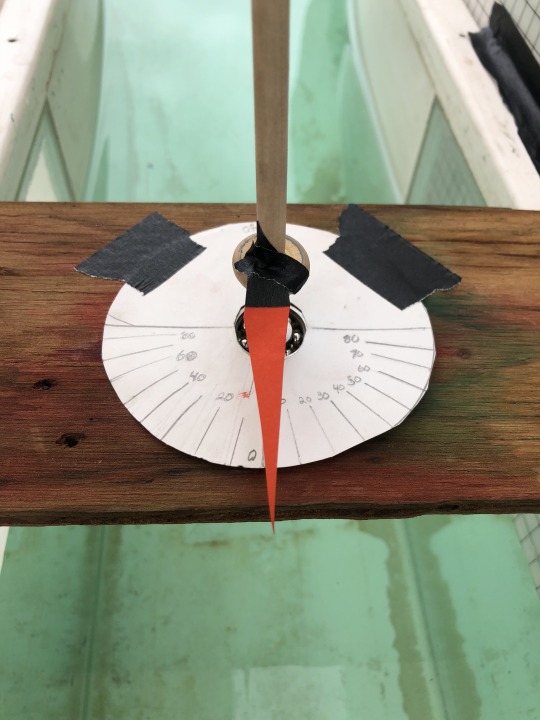
Cutting edge technology for angle measurements to the highest precision. (The thinner the dial, the more accurate the accuracy).
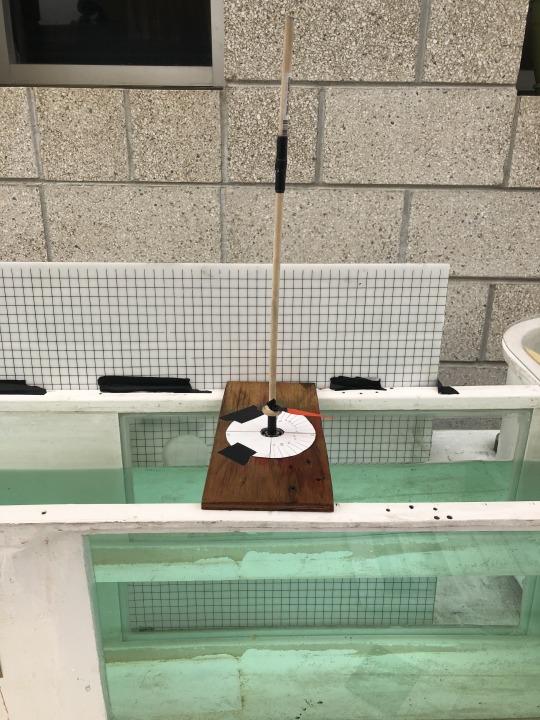
Full view of the fin stand for experimentation.

The broken pressure pump: The rod that connected the handle to the pressure valve had fallen off. We fixed it though.
0 notes
Text
Week 8
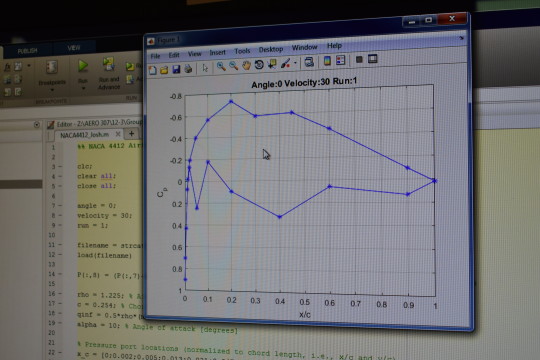
On Monday of week 8, the class got together in the aero lounge (322) with Tynan and were given a free period to get together and work on our mini projects and reports. Over the weekend I was brushing up on my skills with XFOIL so that I can run our experimental data and use that as a source for comparisons. I spent my time on Monday working with XFOIL and outputting plots and values for the lift coefficient, drag coefficient, and lift/drag ratio for all of our tests. This included two different NACA 4412 wings at the following angles of attack: -5, 0, 5, 10, 13, 14, 15, 16, 17. I spent about an hour and a half and generated 18 plots (9 for each wing) from XFOIL and then extracted the lift and drag coefficient and lift/drag ratios from the plots into a table. Once all of this was done, I looked over all of the XFOIL data and realized that I had done something wrong. The drag coefficient was negative and extremely tiny for each wing throughout all of the alphas. I realized that this was probably because I hadn’t added in viscous effects as a parameter and hadn’t smoothened out the airfoil panels in XFOIL. Therefore, I spent the next hour redoing all of the XFOIL simulations and outputting correct data now. Finally, I took all this data and put it into our report. And that concluded the class session on Monday.
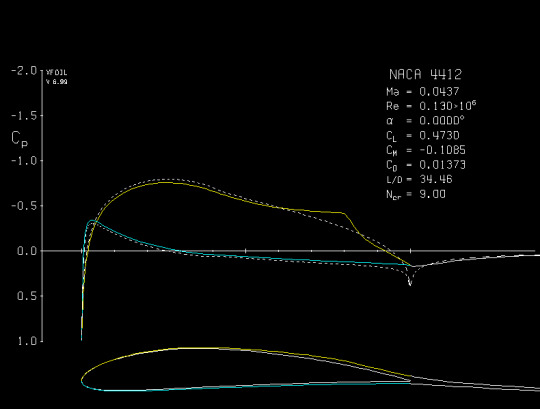
An example of the data produced from XFOIL. This plot was for the blue NACA 4412 wing at an angle of attack of 0 degrees.
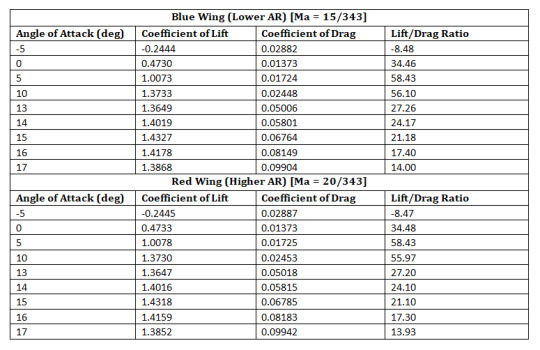
Created table to organize all of the XFOIL data to use in our report.
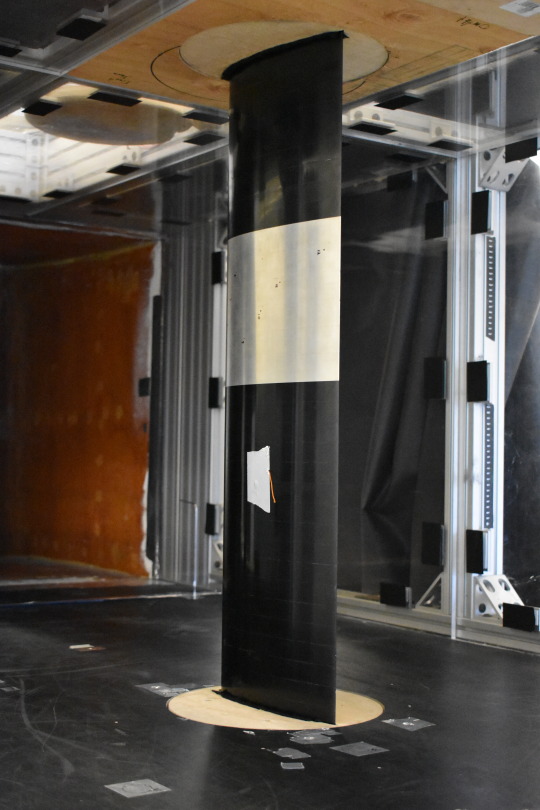
On Wednesday, we met in the aero lounge again with the class. Will, Matt, and I got together to work on our project with Lost Coast’s Surf Fins. We were given CAD files of a general fin and a Lost Coast fin. We spent the class time editing the CAD files and scaling them to dimensions that would work for our water tunnel testing. This meant having them be at a height of 4 inches with the rest of the dimensions being to scale. We attached a block to the fins to simulate the fins being attached to a surfboard and got the CAD files ready to 3D print. After that, we brainstormed on how we should make our mount to hold the fins, and we decided to have a hole in the fin in which a dowel can be inserted. The dowel would allow us to rotate the fin in a yaw direction in the water to simulate a surfer turning in the water. Lastly, we all agreed on having all of Wednesday as a day to test and made sure that we would have the mount put together over the weekend.
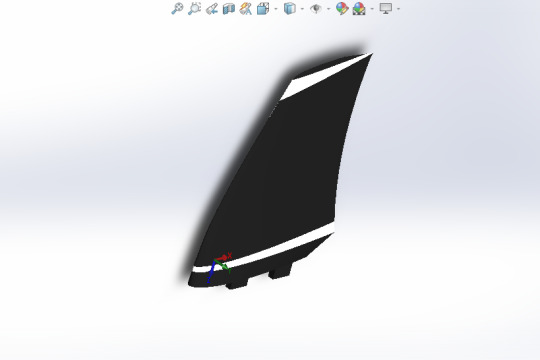
3D model of a Lost Coast Fin shown in Solidworks.

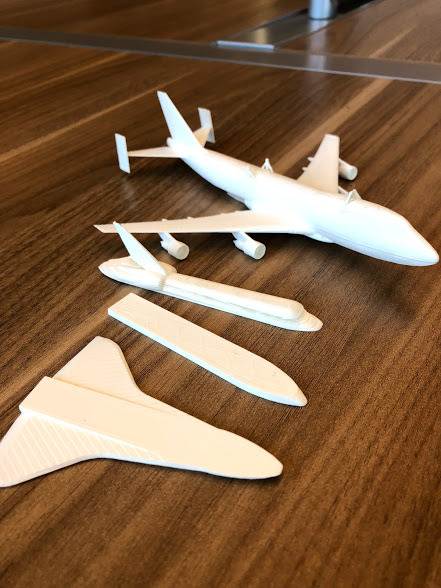
3D print of a Lost Coast fin (in the back) and a common fin (in the front) for comparison. These will be used in our water tunnel tests next week!
1 note
·
View note
Text
Week 7
Everyone in our class except for the guys testing in the tunnel met up in 322 on Monday. My group and I had tested the week before so we had a full 3 hours to work on our report and decompress a little, because there are no immediate due dates for projects yet. Ben and Derick spent the time putting together part of the report and the code to organize our collected data, while Bennett and I were trying to accomplish the task of using XFoil. We pretty much did this for the entirety of the class period of Monday. It was a very chill class time.
On Wednesday, we met up in 322 again with Tynan and the whole class. Tynan assigned each of us to our groups for our last project. I was placed in a group with Matt and Will to help with Tynan’s Lost Coast Surf project. This project is to examine surfboard fins and extract scientific data about them using the water tunnel. We spent this class period creating a test plan for our project and doing research on different kinds of fins and the background to each one. We plan to test a standard fin in the water tunnel and gain qualitative data that can display the vortices, drag, and wake generated by the fin. Our goal is to be able to test a standard surfboard fin for these qualities, and then also 3D print a Lost Coast fin to test for the same qualities. We also plan to have some dynamic tests in which we hold a fin at an angle to the flow and then release the fin to time the amount of time it takes to reach its “equilibrium” state. Using this data we can potentially compare which fin has more drag and is more suitable for different types of surfing. We plan to bring multiple GoPros and cameras to record different shots of the test in the water tunnel. Next week we will need to build a stand to hold the fins during the test. Additionally, we hope to be able to create the Lost Coast fin to use in our tests. Hopefully we can get this all done next week so that we can devote all of week 9 to testing.
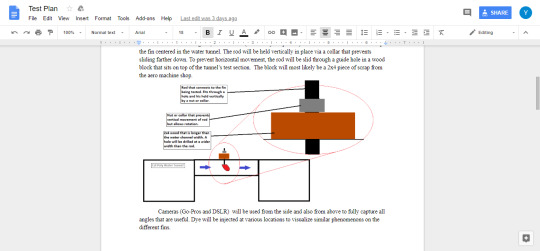
Potential set up of the water tunnel for our testing. (Taken from our Test Plan document).
1 note
·
View note
Text
Week 6
Monday of week 6 was devoted to our presentations. We spent the full class time having each group present to our peers. Dr. Doig and Tynan were both there, it was a good time. Kendrick and I matched with our dress attire for some style points. We were also assigned our groups for the next experiment last week, and now we were to come up with a test plan for our testing which would happen on Wednesday.

Hitting those style points for the presentation with Kendrick.
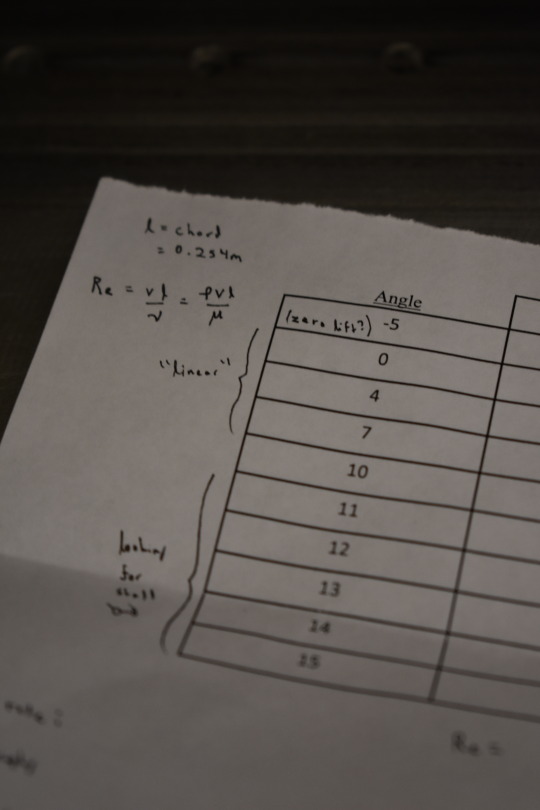
My new group consisted of myself, Derick, Bennett, and Ben. On Wednesday, we all met in 322 and spent the first hour and a half deciding on what we would test for in our experiment. In this lab, we had two different NACA 4412 wings with different aspect ratios. Our goal was to test both wings for the same dynamic conditions, and compare the data for each wing. We decided that we would run each wing at two different velocities that equated to a Reynolds Number of 130,000. This would be a velocity of 20 m/s for the wing with the shorter chord, and 15.1 m/s for the wing with the longer chord. We planned to test each wing, as well as the unloaded sting itself, at varying angles of attack (degrees): -5, 0, 5, 10, 11, 12, 13, 14, 15. After this, we wrote a code so that we can export the raw data straight into MATLab and output Cd vs alpha, Cl vs alpha, and L/D plots vs alpha plots. At 1:30 we went down to the lab to run our experiment. Ben, Bennett, and Derick all took different roles in the computer lab section of the wind tunnel, while I stayed outside of the tunnel, keeping an eye on the sting, watching the doors for safety, and changing the wings when needed. As stated before, there were two wings we were testing; one blue and one red. The blue wing had a larger chord length (6.1 in) but a smaller aspect ratio (~115 square in). The red wing had a shorter chord length (4.625 in) but a larger aspect ratio (~119 square in). We initially ran the tunnel at both velocities for the unloaded sting. I then attached the red wing and we ran the experiment on this wing at a velocity of 20 m/s. After collecting all of the data for the red wing, I switched out the wing and loaded the blue wing, for which we collected data at a velocity of 15.1 m/s. The experiment ran very smoothly, and we were able to finish rather quickly. At the end of the experiment, we realized that the forces on the sting weren’t re-zeroed before our tests. To account for this, we re-attached each wing on, and calculated the weight of each wing so that we could add this into our calculations when doing our report.
Setting up in the tunnel before running our tests. Ben working the MATLab codes, Derrick and Bennett switching off between running the tunnel and sting, and myself being on the other end of the tunnel. Tynan is also pictured keeping us supervised and getting stuff done on his laptop.
First run of the unloaded sting.
Run of the red wing at a high angle of attack.
Run of the blue wing at a high angle of attack. Bennett is also taking a picture of myself taking a picture of this setup.
1 note
·
View note
Text
Week 5
Week 5 of AERO 307 has been one of the easier, and less stressful weeks. My NACA 4412 report (from the first and second labs) was due on Monday. I had some awesome groupmates though and we had it all done and submitted the day before, so we didn’t have to worry about it on Monday. I spent this whole week working through the data that Kendrick and I gathered from the water tunnel testing, and then putting it together for our flow visualization presentation. Monday was devoted to going through tons of footage that was recorded on multiple GoPros, and editing the footage to find and use what was applicable to our flow viz objective. While I was doing this, Kendrick was setting up the template for our PowerPoint, and beginning to write up multiple slides for the presentation.By the end of the class time on Monday, I had all of the footage edited, and most of it was exported. The initial files were pretty big, since we were recording at 240 frames per second to get some awesome slo-mo footage. Because of this, it took more time to input and edit all of the video files. That was why I had to devote all of that class period for editing videos, and some additional time afterwards.
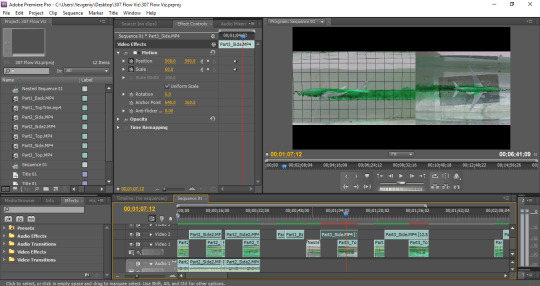
Adobe Premiere Pro was used to edit the video content.
Pretty awesome capture of the vortices produced by the wing.
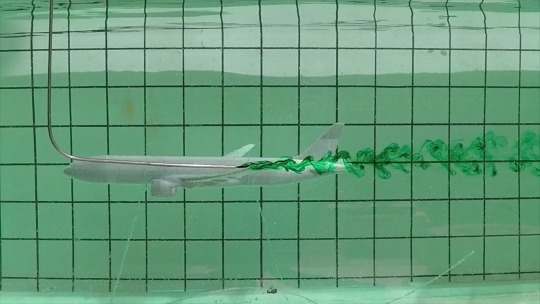
On Wednesday, Kendrick and I spent the class time working on the PowerPoint for the presentation. I had finished and exported all of the video footage that we would be analyzing. This footage included the flow (dye) over the airplane’s fuselage, wing, engine, wingtip, and vertical stabilizer, at a 0 degree and 15 degree angle of attack. We used the angles 0 degrees and 15 degrees so that we can compare how the flow is for a Boeing 777 while cruising and when stalling. When putting together our presentation, we found out that we can’t directly embed and save a video into a slide; the video has to somehow be called to a different source. This wasn’t ideal, and I didn’t want to have to keep opening a bunch of different web browsers so that we can include everything in our presentation. Therefore, I spent a majority of the class time getting all of the .mp4 files converted to GIF’s that were high quality. Once the GIF’s were all created, I continued to work on the slides with Kendrick for the remainder of the time. When analyzing our data, we focused on how the dye showed the wake off of the airplane, the flow separation that happens at higher angles of attack, von Kármán vortex streets, and how the dye outlined the pressure distribution of the fluid on the model. We would talk about all of this during out presentation. By the end of class on Wednesday, all of our gathered data had been edited to nicer video files and analyzed for our presentation. Most of our presentation was completed as well, and we would meet over the weekend to finish it up and get ourselves ready for presenting.
Capture of the flow separating over the wing at a 15 degree angle of attack.
Our presentation coming together.
0 notes
Text
Week 4
Week 4 of AERO 307 started off in the Wind Tunnel on Monday. I spent the first hour and a half of class with Kendrick, as well as another group that would use the water tunnel, figuring out how to use the water tunnel. We basically just filled it up, turned it on, and practiced shooting some dye in the water. We then practiced draining the tunnel to get rid of all the stained water. After figuring out how to use the water tunnel, Kendrick and I left to go to the Innovation Sandbox to see how our 3D printed models were doing, and how far along they were with being printed. We had planned to have both a Boeing 777 and a Boeing 747 SCA with a Space Shuttle attached to test. The 747 had finished printing when we arrived, but there was a problem with it. Some of the layers and smaller details on the airplane weren’t printed well and were falling off. The 777 had just started printing and would be done on the next day. We decided that we’d probably test only the 777, since the 747 didn’t turn out well, and we wouldn’t want to risk it being glued and then falling apart in the water. After this, we left to go back to the aero lounge, 322, and I spent the last hour of class gluing together the 747 with the shuttle, and working on the report for the 4412 lab that would be due next Monday.
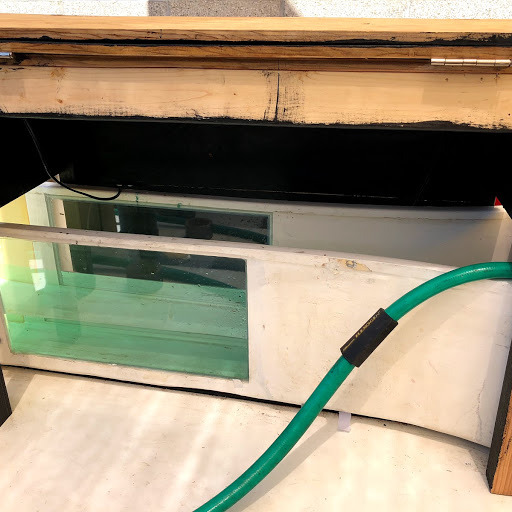
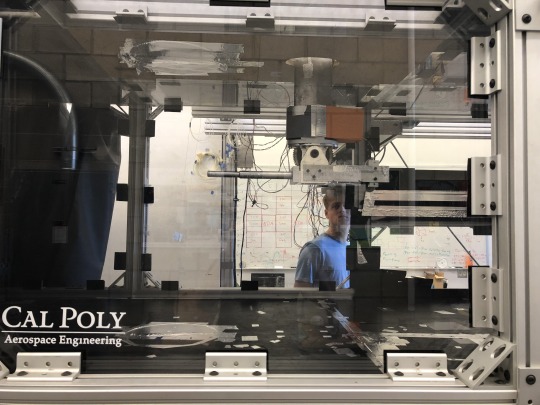
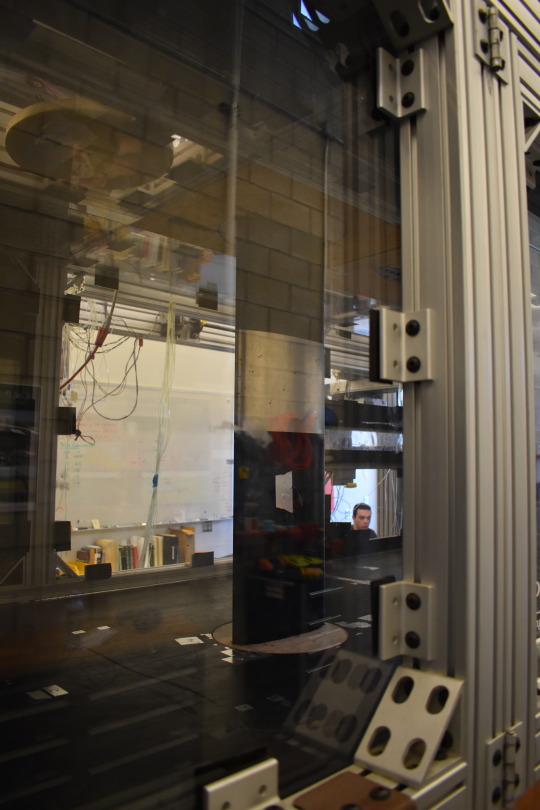
Side view of the Water Tunnel where the test section is located. The hose is currently attached to fill the water up.
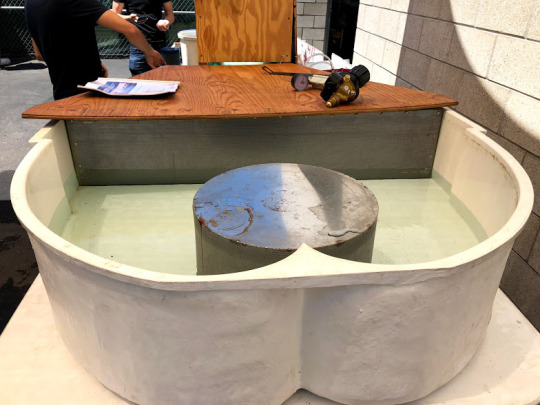
Front of the water tunnel where the water is pushed from.
The pieces of the 747 and space shuttle that were printed but didn’t stay together.
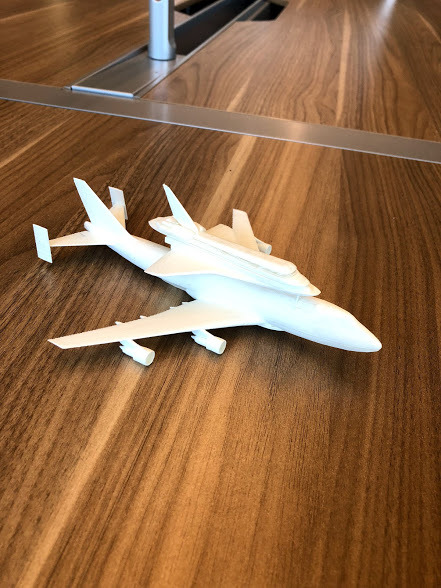
The 3D print once glued back together. (And I’m keeping this model!)
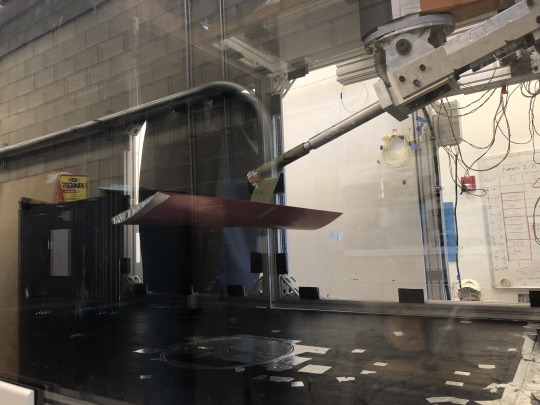
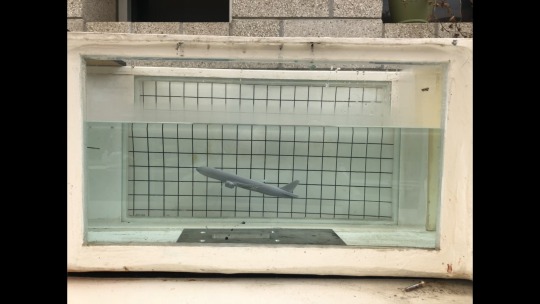
On Wednesday we met up at the water tunnel again with our printed Boeing 777 and GoPro gear for recording. Apparently there was a mess up on the wind tunnel reservation page and we were doubled booked with another group (we found this out outside of lab time), so we let them go ahead first and we’d take the second half of class after them. Therefore, during the first hour and a half of lab, we had extra time to prepare for the test. We first spent about an hour adding a nicer, smoother finish to the airplane model and putting together a base for it to be supported while being in the water. Kendrick sanded the airplane and deburred its edges for most of the time, while I drilled different pieces of wood and used various wires to try to build a base for the model. After a lot of trial and error, I ended up grabbing some fishing line and tying that around the plane. I then tested the model in the water and realized that it floats, so I tied it down to a scrap piece of aluminum that was laying around. I did some calculations for where the string should be placed and how long each string should be so that we could place the airplane at 2 different angles of attack. I was pretty skeptical when creating this base but it all worked extremely well. About halfway into the lab time, the group before us was finishing up and started draining the water tunnel. At this point, I started setting up my GoPros and adjusting them so that they would be at good locations and angles for the run. About 2 hours into the lab time, we were finally starting to test (it took extremely long to drain and then refill the water tunnel). For this first test, we had the airplane at a 0 degree angle of attack. The water speed was at 4 in/s, and 3 cameras were set up to gather footage: one in the water behind the model, one above the model, and one taking a side view shot. We ran our first test and accidentally were releasing more dye than we had hoped to, so the visualization that was being seen coming off of the wing wasn’t that great (the dye was too concentrated), and the water ended up changing colors really fast. Now there was only 30 minutes of class left and our gathered data was pretty bad. The next group that would test had showed up at this time too (pretty early), and we decided that this day was kind of a failure, and that we’d have to redo our test on Thursday in the morning (Tynan came in clutch with allowing us into the tunnel for lab early!!!). We began draining the tunnel and spent the rest of the time draining the water tunnel and getting it back to being ready for the next group. Towards the end of draining the tunnel, the next group told me they could take over it now, so we handed the tunnel off to them and packed up for the day. We came in the next day at 9:20 AM and re-ran our experiment. It went extremely well! We got some awesome data for a 0 degree angle of attack and a 15 degree angle of attack. We spent about an hour and a half in the tunnel that morning, and then drained the water and cleaned up.
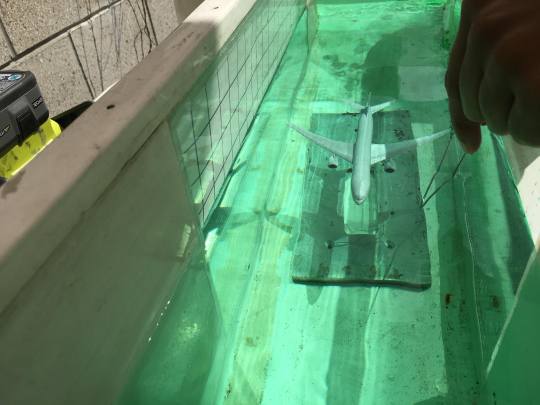
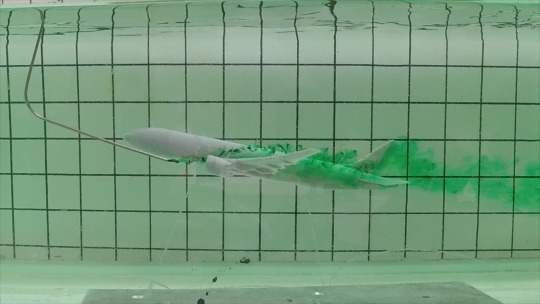
Top view of the Boeing 777 model in the test section with ink being outputted.
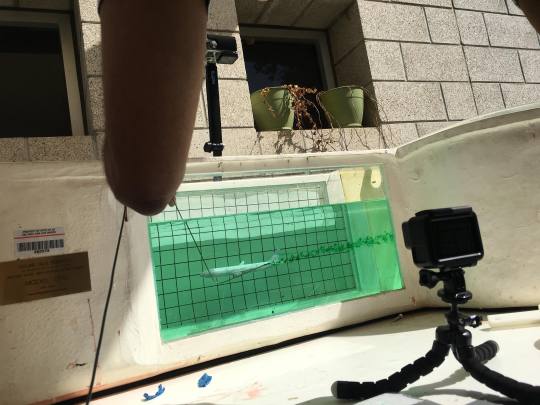
Side view of the model inside the water tunnel. Two of the GoPros can be seen here, one providing a top view, and one providing a side view.
Kendrick controlling the dye output and where it is being placed on each part of the airplane for the visualization.
Side view of the model being set up at 15 degrees angle of attack. (Used a phone level app to double check that it was, and it was surprisingly accurate.)
3 notes
·
View notes
Text
Week 3
On Monday, our group met in 322. We had an hour and a half to finalize our plan for the test on that day before actually experimenting. We had talked about our plan a little bit over the weekend, but we finalized everything on Monday. We had planned to test the infinite wing at 3 different angles of attack (-5, 0, and 10 degrees), for 2 velocities (15 m/s and 30 m/s). Today we would be testing the air pressures behind the wing, to get qualitative data of the wake created by the wing using a traverse. Tynan and Kyle had tested the traverse earlier last week and sent us data about it. Using their data, we figured that we would test the traverse over a set of 30 points, evenly distributed on each side of the wing. Each data point would be taken from a distribution of 25 pressure points. We wrote a MatLAB code to easily collect the data from the wind tunnel and have a live output onto a graph of a plot of the pressure coefficient over the span of the wing. We assigned roles for each of us, and planned to switch positions between tests so that everyone would have a chance at each position. These positions included: LabVIEW operator and traverse operator (since they were on the same computer), MatLAB operator who continuously looked through the data and instantly plotted our points, Wind Tunnel opeed operator and computer support, and the safety person to be on the other side of the wind tunnel and make sure everything was going smoothly while the test was being run.
Once we got into the lab, everyone began to get situated in their positions to begin testing. Testing started off pretty smoothly initially. We did run into a problem after finishing the first set of data points (this was for a 0 angle of attack). We realized that the set of distances that we were measuring across the wing didn’t fully capture the wake off of the wing. Therefore, we decided to add in an additional 20 points to get a fully defined graph. After this hiccup, we adjusted our distances for the rest of the angles of attack and everything ran very smoothly. We gathered enough data to produce pressure coefficient plots (showing the wake off of the wing) for 5 different instances. These were from a velocity of 15 m/s at -5, 0, and 10 degree angles of attack, as well as a velocity of 30 m/s at -5 and 0 degree angles of attack. Unfortunately, we did not have enough time to collect data for our 6th plot, which would have been 30 m/s at 10 degrees. However, our data came out looked as good as we had hoped it would be, so we are satisfied with what we had collected on Monday. This concluded the Monday session of AERO 307.
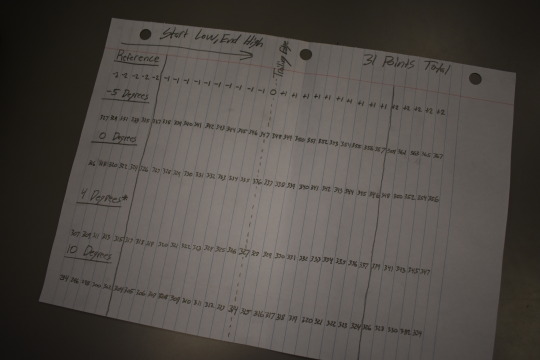
Our plan for the locations that we will move the traverse to, so that we could measure our distances for each pressure point.

Josh and Damien aligning the traverse to the trailing edge of the wing as our center point of testing.
Myself, Josh, and Damien getting the traverse set up and making sure it is aligned as we had planned.
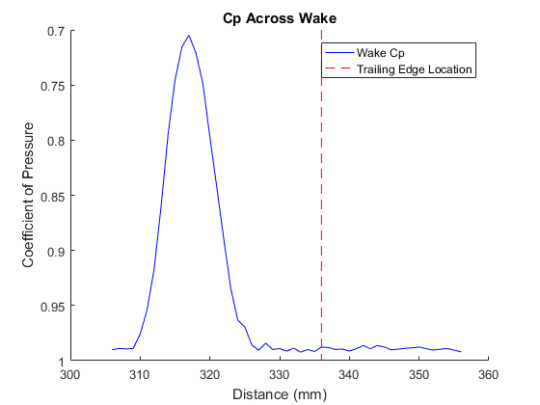
An example of the type of plots we produced from our data. This is what the MatLAB operator was overviewing and outputting at the time of our experiment. This plot is for a velocity of 15 m/s, with the wing at a 0 degree angle of attack.
On Wednesday, I showed up to room 322 to start the class session. I had talked to Kendrick Dlima the day before, and we partnered up for the flow visualization project. Tynan and Kyle were both in 322 with us on this day, and they helped us with our ideas for the flow viz challenge. They also clarified any questions we had for the project. Kendrick and I decided that we will work with the water tunnel for the flow viz. Our plan was to 3D print two airplane models: a Boeing 777, and a Boeing 747 SCA with the space shuttle attached to it. Kendrick has a friend who works in the Sandbox, and he agreed to help us with printing both of those models out in time for us to test (go Alex from the Sandbox!).
We then spent the rest of the class time planning on what we wanted to get out of this experiment and how we would achieve those results. Our goal was to use dye in the water tunnel and see the wake effects off of the wings and tail for both of the models. We hope to be able to create 2 fixtures to hold the models in place in the water; one would hold the plane at 0 degree AoA and the other would set the plane to ~10 degree AoA. I have 3 GoPros at home that I plan to bring (I know, overkill), to set at different positions in the water tunnel for multiple views. We created our test plan for the flow viz using the rest of the time in class, and submitted it before class ended.
1 note
·
View note
Text
Week 2
Our group met in 322 on Monday at noon for the first half of the lab period before going to the wind tunnel for testing. We spent the first hour and a half going over what our roles would be in lab, adjusting them so that we would all get a chance to try each position throughout the experiment. We created a spreadsheet so that we can mark off every test point (each angle per velocity) throughout each run. We basically did all that we could so that the lab time would be as organized and efficient as possible. Josh had written up a code and we made some edits to it so that during lab, we could instantly output our lift and drag, as well as our coefficients of pressure. The person who would be working the MATLAB script would take the data that the person on LabVIEW had outputted and would basically just input the appropriate velocity and angle, and all of the information would output and save to a file. (It was very organized, if I may say so again. That was a great idea on Damien’s part.) At 1:30, we headed over to the wind tunnel to begin testing. Again, our experiment was aimed to find the stall angle for a NACA 4412 airfoil. We used the infinite wing provided for our class, and planned to test a series of angles for 2 different velocities, hopefully 3 if time permitted. The angles (in degrees) were: -5, 0, 4, 7, 10, 11, 12, 13, 14,15. The velocities (in m/s) were: 15, 22, 30. When we came into the wind tunnel, Matt and I had to re-tape some of the wiring for the probes inside of the tunnel since they were flapping around for the last test group when turned up to a high velocity. We also re-taped some of the connections between the floor layering to keep the test section smooth and minimize the boundary layer before the air hits the wing. While we were doing this, Damien and Josh set up in the tech room, getting the MATLAB script up and LabVIEW all set up. We ran the first test at 15 m/s for all 10 of the angles very smoothly. Matt took pictures and watched the areas outside the wind tunnel for safety, I adjusted the angles of attack for the wing, Damien handled the LabVIEW and turned on the appropriate wind tunnel speed, and Josh worked with the MATLAB script. We would then change roles and re-run the same experiment for the other velocity. We gathered sets of 100 pressure points per port for each angle of attack, and finished all our experimental data gathering extremely quickly. Therefore, we were able to run the test for the third velocity of 22 m/s, and we still had enough time to re-run all of the tests for all 3 velocities again. The lab time ended up being extremely organized and we were able to gather a lot more data than we had planned for, which was awesome. The following are pictures, showing everything I had just explained (All of our team members are pictured except for Matt. Not because he didn’t do any work, but because he was our Camera Man.) :
The infinite wing mounted in the test section of the Low Speed Wind Tunnel.
Myself taping the wiring of the pressure probe that was dangling around during the previous team’s test.

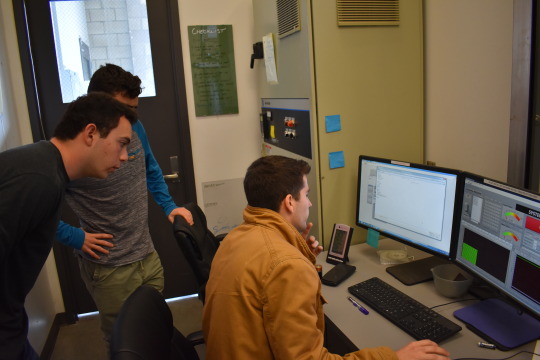
Damien and Josh getting set up with LabVIEW and MATLAB; Tynan helping Damien with LabVIEW.
Our spreadsheet to keep track of what we will test and what we have already tested.

The LabVIEW system (right), with all the files we were outputting (left).
An example of the Cp plots that were instantly outputted. The user just had to define which angle, velocity, and run were being tested, and the appropriate data was outputted.
Adjusting the angle of attack of the airfoil. The wing was directly mounted with this pole on a circle that had the appropriate angles written out.
A view of the wing from outside of the tunnel, during testing.
On Wednesday, Kyle came into our class at the start of the section and gave us a lecture on the traverse and answered any questions we had about it so that we can be ready for our next lab. This went on for about half an hour, and then we went back into our groups to do our work. We spent the rest of the time working on outputting our data from Monday in an organized way and then analyzing what we had. Damien and Matt worked on Xfoil, while Josh and I split up the work for MATLAB. Josh and I were working on generating Cl, Cd, and Cp plots. He focused on getting plots for the Cl and Cd of the 4412 airfoil for each velocity we had tested, while I focused on getting Cp plots over the airfoil generated with errorbars. We spent the next two hours of the time working on this code and had gotten most of it done (there were still some little things left that needed to be added in. The coding took much longer than expected. We did end up having 126,000 points of data in the end, so we needed to get an organized system in place for handling all of it). We took our work home to finish, and we will collaborate over the weekend to have our report completed.
3 notes
·
View notes
Text
Week 1
In this week of 307, we arrived to the Low Speed Wind Tunnel on Monday and Tynan explained the safety and rules for the wind tunnel, the plans for the experiments we will pursuit, and the expectations of this quarter. We were divided into our groups and then had the rest of the class period to collaborate on our test plan and prep for the experiment. Being in group 4, we weren’t going to run the experiment until week 2, so we used the remainder of the week to write up our test plan, and to try to get as much of the preparatory work done for the report. Once in room 322, Damien and I measured the dimensions of the infinite wing and wrote them down. Our whole group then collaborated on what our goals would be in the upcoming experiment. We chose to experiment for the angle of attack at which stall would occur on the NACA 4412 wing. We also plan to obtain pressure measurements of the wing at each different port so that we can compare our data on X-Foil to the published experimental data in the Theory of Wing Sections. We plan to collect data at the following angles of attack (degrees): -5, 0, 10, 11, 12, 13, 14, 15. This would be tested at two different velocities (hopefully three velocities if time permits). We divided our roles for when we are in the experiment, and I am in charge of controlling the wind tunnel speed, as well as being a potential backup on LabView Data Collection, since I will be right next to the person on the computer while controlling speeds. After figuring out our plans for the experiment, we wrote up the test plan for the experiment (Damien took the lead with writing it up while the rest of us gave additional input into the write-up). We finished the day off with completing the test plan and dividing up additional work that would help us for our final report once we get our experimental data. Josh would work on inputting the given pressure data for a Cp plot over the chord, Damien and Matthew would work on plotting everything on XFoil, and I would work on creating an additional Cp plot from a custom Matlab code I created earlier with the panel method. On Wednesday we arrived in room 322 and shared our work. Our test plan was completely finished and we emailed it to Tynan. Josh and I compared our results from the Matlab plots that each of us had generated. Our plots looked very similar so that was reassuring. Damien and Matthew had their XFoil all set up, they just decided not to run it yet until we had accurate measurements of the air properties at our testing sight. We spent the rest of the class time working on the lab write up. We formatted the whole document and added in whatever information we were able to without having any experimental data yet. At the end of the period, we talked with Dr. Doig about our progress and plans for when we experiment on Monday.
2 notes
·
View notes