#3d scatter plot excel
Explore tagged Tumblr posts
Visit Tumblr Blog
Explore Tumblr blogs with no restrictions, modern design and the best experience.
Last Seen Tumblr Blogs


Fun Fact
25% of US internet users with an annual income of $80-100K use Tumblr.
Text
Rune Factory Tides of Destiny (extended thoughts)
@saficswrites asked me to go a little more in depth and I've actually been planning on talking more in depth anyway, so this is a good opportunity! I'm also going to throw in some of the resources I used while playing because there's a lot of great ones but they're kind of scattered.
So I will start by saying that I started on the series with RF4 back when it originally came out for 3DS and I played the heck out of it. Like, tried taming every single monster in the game levels of played the heck out of it. I've since played all of RF1, RF2, most of RF3 and RF5, and now RFToD. I chose to go back and play 1, 2, 3, and ToD after RF5 was announced. The only one I haven't touched is Frontier.
And yeah, Tides of Destiny does have some quirks and I can see why some people don't love it as a Rune Factory game. Just starting with some of the criticisms (because they lead into one of the things I actually really like about the game): The farming is very pared down and it's entirely reliant on the monsters you tame. Basically you just plant generic seeds and the monsters you put on the seasonal island determine what they grow into. Different monsters can grow different things.
That is somewhat annoying because you can't see what the monsters are called or what they plant before you tame them, the game doesn't really give you a clear list of everything you can plant, and you only get to tame 30 total so you're going to be doing a lot of swapping. It is possible to get everything with some planning tho (I borrowed the monster setups from this GameFaqs thread).
That said, I personally kind of prefer this? Micromanaging the farming has always been my least favorite aspect of the Rune Factory games. In Tides of Destiny you don't have to worry about that. There's no watering, no harvesting, no spreadsheets keeping track of exactly what seeds you need to buy, and the crops grow so fast (most are done in 1-2 days when you have your monster friendship maxed out) that you don't really feel the randomness. I'm in summer of year 2 and I've already got a storage full of full stacks of basically every crop in the game. That means you can focus 100% on the exploration, dungeons, making friends, etc.
And the exploration is. My god. I love it. It's basically if you threw Rune Factory and Legend of Zelda Wind Waker into a blender. For reference, Wind Waker is one of my favorite Zelda games ever so that colors my impressions of the game. The exploration is 100% riding around through the ocean on a giant golem, fighting giant monsters, and digging up islands and salvage points. The quests usually point you toward specific islands to unlock and there's no point where I felt like I needed an external tool to explore, but if you want help someone made an excellent, detailed map of the stuff you can find in the ocean. You also eventually unlock a fast travel and there is a way to speed up getting from point A to point B, so I never felt like wandering through the ocean was too intrusive.
I also really, really, really like the characters. Each one has a little required "friendship event" you need to watch to unlock their next friendship level, and each of the main island inhabitants has at least 6. All the friendship events are connected to a little character arc which is completed with level 6. The bachelor/ettes get an additional 3 event arc if you unlock their love events as well, though you can't access that until after the main plot is over (and gender locked unfortunately). And there's actually a reason to get them up to the max (level 6) before the endgame, since you get a benefit in the final boss battle.
IMO they're all just really likable, funny characters. Some of the events actually made me laugh out loud, and I was usually smiling the whole time any of the them were talking!
I also really like they way they handled the main characters (Aden and Sonja). The plot of the game is that Sonja gets trapped in her childhood friend Aden's body, and the story is about figuring out how to separate them again. You can play as Sonja once they're separated at the end of the main plot, but you do have to do the entirety of the main story as Aden. Initially I was kind of miffed about this, since I vastly prefer playing as female characters in games, but I actually really like how they did it. For two reasons.
One, I just really like Aden as a protagonist. I was expecting him to be kind of the goody two-shoes amnesiac like a lot of Rune Factory protags are, but no. He's sassy as hell. There was at least one point where one of the characters (I think Joe) is like "hey buddy ol' pal" and Aden is just like "Yeah we're not friends sorry you thought that tho."
Two, initially I was thinking that the whole "my best friend is living in my head" thing was going to be some secret they kept. Like Sonja was going to be there, but she was going to be quiet most of the time or not really interact with the world. But no. The first thing that happens is the obligatory RF starter girl (Odette) finds Aden, and the first thing out of his mouth is "Sonja is stuck in my head, isn't that weird?" and EVERYONE just goes with it. I love it. They really lean into the wackiness/silliness of it all. Sonja is very present in the dialogue and the plot. On her birthday characters wish Aden happy birthday to pass it along. The writing frequently plays around with the dynamic of them being stuck together (such as the two of them arguing over how Aden is going to take a bath), and they frequently swap off in dialogue and give different perspectives. They each kind of have their own relationship with the various characters around town. Most of the friendship events feature both of them in some way. It's also really nice how they'll talk to each other throughout gameplay. They'll say good morning to each other, Sonja will warn you when your health is getting low or what time it is, etc.
Despite playing as Aden (physically) I really feel like you're actually playing as both of them to some degree, and I really like that. It actually feels kind of lonely once they split at the end of the main plot and you don't get Sonja's little quips in your head anymore.
I think those are the big things. There's also lots of little things I enjoyed. I love the aesthetic of the world, and the gameplay systems relating to RP management and stuff are much more refined than the older games. I'd say the only mane difference between it and RF4 is that swinging your weapons still costs RP. The crafting is a little annoying until you get the hang of it (you can craft anything up to 20 levels higher than your current level, so it doesn't suck to grind too badly). There's a bizarre amount of spelling errors, which isn't super intrusive but it is kind of funny lol.
On the negative side, the story is pretty short. You can easily beat it in less than one in game year if you're rushing. I'm also not a huge fan of the main story needing to be 100% completed before you can do marriage and the like, since the game is basically done at that point. I don't think there's much post-game other than the goals you make up for yourself. I do think playing as Sonja was a bit of an afterthought. She has like a quarter of the romance options Aden has and there's some odd mistakes I've noticed playing as her (like trying to knock on Sierra's door while she's asleep will have Sonja saying a line about how the bath is closed ???) but it doesn't bother me too much so far.
Those are pretty minor negatives though. I still had (and am having) so much fun with the game!
I also heavily used this website as a guide. The only thing is that I wish they had pictures of the monsters because I think they have slightly different names from the rest of the series, and it can be confusing cuz some monsters have different colorations and therefore do completely different things.
23 notes
·
View notes
Text
Python Libraries to Learn Before Tackling Data Analysis
To tackle data analysis effectively in Python, it's crucial to become familiar with several libraries that streamline the process of data manipulation, exploration, and visualization. Here's a breakdown of the essential libraries:
1. NumPy
- Purpose: Numerical computing.
- Why Learn It: NumPy provides support for large multi-dimensional arrays and matrices, along with a collection of mathematical functions to operate on these arrays efficiently.
- Key Features:
- Fast array processing.
- Mathematical operations on arrays (e.g., sum, mean, standard deviation).
- Linear algebra operations.
2. Pandas
- Purpose: Data manipulation and analysis.
- Why Learn It: Pandas offers data structures like DataFrames, making it easier to handle and analyze structured data.
- Key Features:
- Reading/writing data from CSV, Excel, SQL databases, and more.
- Handling missing data.
- Powerful group-by operations.
- Data filtering and transformation.
3. Matplotlib
- Purpose: Data visualization.
- Why Learn It: Matplotlib is one of the most widely used plotting libraries in Python, allowing for a wide range of static, animated, and interactive plots.
- Key Features:
- Line plots, bar charts, histograms, scatter plots.
- Customizable charts (labels, colors, legends).
- Integration with Pandas for quick plotting.
4. Seaborn
- Purpose: Statistical data visualization.
- Why Learn It: Built on top of Matplotlib, Seaborn simplifies the creation of attractive and informative statistical graphics.
- Key Features:
- High-level interface for drawing attractive statistical graphics.
- Easier to use for complex visualizations like heatmaps, pair plots, etc.
- Visualizations based on categorical data.
5. SciPy
- Purpose: Scientific and technical computing.
- Why Learn It: SciPy builds on NumPy and provides additional functionality for complex mathematical operations and scientific computing.
- Key Features:
- Optimized algorithms for numerical integration, optimization, and more.
- Statistics, signal processing, and linear algebra modules.
6. Scikit-learn
- Purpose: Machine learning and statistical modeling.
- Why Learn It: Scikit-learn provides simple and efficient tools for data mining, analysis, and machine learning.
- Key Features:
- Classification, regression, and clustering algorithms.
- Dimensionality reduction, model selection, and preprocessing utilities.
7. Statsmodels
- Purpose: Statistical analysis.
- Why Learn It: Statsmodels allows users to explore data, estimate statistical models, and perform tests.
- Key Features:
- Linear regression, logistic regression, time series analysis.
- Statistical tests and models for descriptive statistics.
8. Plotly
- Purpose: Interactive data visualization.
- Why Learn It: Plotly allows for the creation of interactive and web-based visualizations, making it ideal for dashboards and presentations.
- Key Features:
- Interactive plots like scatter, line, bar, and 3D plots.
- Easy integration with web frameworks.
- Dashboards and web applications with Dash.
9. TensorFlow/PyTorch (Optional)
- Purpose: Machine learning and deep learning.
- Why Learn It: If your data analysis involves machine learning, these libraries will help in building, training, and deploying deep learning models.
- Key Features:
- Tensor processing and automatic differentiation.
- Building neural networks.
10. Dask (Optional)
- Purpose: Parallel computing for data analysis.
- Why Learn It: Dask enables scalable data manipulation by parallelizing Pandas operations, making it ideal for big datasets.
- Key Features:
- Works with NumPy, Pandas, and Scikit-learn.
- Handles large data and parallel computations easily.
Focusing on NumPy, Pandas, Matplotlib, and Seaborn will set a strong foundation for basic data analysis.
9 notes
·
View notes
Text
What are the top Python libraries for data science in 2025? Get Best Data Analyst Certification Course by SLA Consultants India
Python's extensive ecosystem of libraries has been instrumental in advancing data science, offering tools for data manipulation, visualization, machine learning, and more. As of 2025, several Python libraries have emerged as top choices for data scientists:
1. NumPy
NumPy remains foundational for numerical computations in Python. It provides support for large, multi-dimensional arrays and matrices, along with a collection of mathematical functions to operate on them. Its efficiency and performance make it indispensable for data analysis tasks. Data Analyst Course in Delhi
2. Pandas
Pandas is essential for data manipulation and analysis. It offers data structures like DataFrames, which allow for efficient handling and analysis of structured data. With tools for reading and writing data between in-memory structures and various formats, Pandas simplifies data preprocessing and cleaning.
3. Matplotlib
For data visualization, Matplotlib is a versatile library that enables the creation of static, animated, and interactive plots. It supports various plot types, including line plots, scatter plots, and histograms, making it a staple for presenting data insights.
4. Seaborn
Built on top of Matplotlib, Seaborn provides a high-level interface for drawing attractive statistical graphics. It simplifies complex visualization tasks and integrates seamlessly with Pandas data structures, enhancing the aesthetic appeal and interpretability of plots. Data Analyst Training Course in Delhi
5. Plotly
Plotly is renowned for creating interactive and web-ready plots. It offers a wide range of chart types, including 3D plots and contour plots, and is particularly useful for dashboards and interactive data applications.
6. Scikit-Learn
Scikit-Learn is a comprehensive library for machine learning, providing simple and efficient tools for data mining and data analysis. It supports various machine learning tasks, including classification, regression, clustering, and dimensionality reduction, and is built on NumPy, SciPy, and Matplotlib. Data Analyst Training Institute in Delhi
7. Dask
Dask is a parallel computing library that scales Python code from multi-core local machines to large distributed clusters. It integrates seamlessly with libraries like NumPy and Pandas, enabling scalable and efficient computation on large datasets.
8. PyMC
PyMC is a probabilistic programming library for Bayesian statistical modeling and probabilistic machine learning. It utilizes advanced Markov chain Monte Carlo and variational fitting algorithms, making it suitable for complex statistical modeling.
9. TensorFlow and PyTorch
Both TensorFlow and PyTorch are leading libraries for deep learning. They offer robust tools for building and training neural networks and have extensive communities supporting their development and application in various domains, from image recognition to natural language processing. Online Data Analyst Course in Delhi
10. NLTK and SpaCy
For natural language processing (NLP), NLTK and SpaCy are prominent libraries. NLTK provides a wide range of tools for text processing, while SpaCy is designed for industrial-strength NLP, offering fast and efficient tools for tasks like tokenization, parsing, and entity recognition.
These libraries collectively empower data scientists to efficiently process, analyze, and visualize data, facilitating the extraction of meaningful insights and the development of predictive models.
Data Analyst Training Course Modules Module 1 - Basic and Advanced Excel With Dashboard and Excel Analytics Module 2 - VBA / Macros - Automation Reporting, User Form and Dashboard Module 3 - SQL and MS Access - Data Manipulation, Queries, Scripts and Server Connection - MIS and Data Analytics Module 4 - MS Power BI | Tableau Both BI & Data Visualization Module 5 - Free Python Data Science | Alteryx/ R Programing Module 6 - Python Data Science and Machine Learning - 100% Free in Offer - by IIT/NIT Alumni Trainer
Regarding the "Best Data Analyst Certification Course by SLA Consultants India," I couldn't find specific information on such a course in the provided search results. For the most accurate and up-to-date details, I recommend visiting SLA Consultants India's official website or contacting them directly to inquire about their data analyst certification offerings. For more details Call: +91-8700575874 or Email: [email protected]
0 notes
Text
Top Tips for Excelling in Hyperspectral Image Processing Assignments with MATLAB
When faced with hyperspectral image processing assignments, it's crucial to harness the full potential of MATLAB to achieve accurate and efficient results. To excel in these assignments, understanding and applying specific techniques and strategies will not only enhance your results but also streamline your workflow. By leveraging MATLAB effectively, you can ensure that you meet the high standards expected in your coursework. So, let’s dive into some top tips to help you do your image processing assignment with confidence and skill.
1. Master the Basics of Hyperspectral Imaging
Before delving into complex processing tasks, ensure you have a solid grasp of hyperspectral imaging fundamentals. Understand what hyperspectral images are, how they differ from traditional images, and the principles behind spectral data collection. Familiarizing yourself with the concepts of spectral bands, data cubes, and the significance of spectral signatures will provide a strong foundation for your assignments.
2. Utilize MATLAB’s Hyperspectral Imaging Toolbox
MATLAB offers a specialized Hyperspectral Imaging Toolbox designed to facilitate the analysis and processing of hyperspectral data. Explore this toolbox thoroughly to make use of its built-in functions and tools that can simplify your assignment tasks. Whether you’re performing dimensionality reduction or classification, leveraging these resources will save you time and effort.
3. Implement Dimensionality Reduction Techniques
Hyperspectral images often contain a vast amount of data, which can be overwhelming to process. Implement dimensionality reduction techniques, such as Principal Component Analysis (PCA) or Independent Component Analysis (ICA), to reduce the complexity of your data while retaining essential information. This step is crucial for improving processing efficiency and focusing on significant spectral features.
4. Focus on Accurate Calibration and Preprocessing
Proper calibration and preprocessing of hyperspectral data are vital for achieving accurate results. Ensure that you correct any radiometric and atmospheric distortions present in your data. Techniques such as noise reduction, normalization, and background subtraction can significantly enhance the quality of your input data and, consequently, the outcomes of your processing tasks.
5. Experiment with Various Classification Algorithms
Hyperspectral image classification is a key aspect of processing assignments. Experiment with different classification algorithms, such as Support Vector Machines (SVM), Random Forest, or Neural Networks, to find the most effective method for your specific dataset. MATLAB provides a range of classifiers, so utilize them to evaluate and compare the performance of each algorithm.
6. Leverage MATLAB’s Visualization Capabilities
Visualization is an essential part of hyperspectral image processing. Use MATLAB’s powerful visualization tools to analyze your data and interpret results. Techniques like scatter plots, 3D surface plots, and false-color images can help you gain insights into the spectral characteristics and spatial patterns of your hyperspectral data.
7. Validate Your Results Thoroughly
Ensure the accuracy and reliability of your results by validating your processing outcomes. Use ground truth data or benchmark datasets to compare your results and evaluate their correctness. Thorough validation will not only help in achieving precise results but also in building a robust analysis framework for future assignments.
8. Seek Assistance When Needed
Don’t hesitate to seek help if you encounter challenges with your hyperspectral image processing assignment. Whether it's guidance on complex algorithms or troubleshooting issues, leveraging image processing assignment help services can be beneficial. These resources can offer valuable support and insights to enhance your understanding and performance.
Conclusion
Excelling in hyperspectral image processing assignments with MATLAB involves mastering fundamental concepts, utilizing specialized tools, and applying effective processing techniques. By following these tips, you can approach your assignments with greater confidence and efficiency. Remember, the key to success is a combination of solid preparation, strategic implementation, and seeking help when necessary. With these strategies in place, you’ll be well-equipped to tackle your hyperspectral image processing challenges and achieve outstanding results.
Reference: Hyperspectral Imaging with MATLAB: Techniques & Applications (matlabassignmentexperts.com)
#education#assignment help#matlab assignment help#help with assignments#students#university#image processing assignment help
0 notes
Text
Exploring the Techniques of Data Visualization

Large data sets need in-depth analytics and processing power to manage. This is where data visualization is helpful. Data visualization services have advanced rapidly in recent years, anticipated to alter the business environment shortly.
Data visualization utilizes visual elements such as charts, graphs, and maps to facilitate the observation and comprehension of trends, outliers, and patterns in data. It helps determine which variables to include or discard in the analysis.
This blog on data visualization techniques will provide detailed insights into the techniques and benefits.
What is Data Visualization?
Data visualization is a captivating form of visual art that captures our attention and effectively conveys a message. When we look at a chart, we can easily identify trends and outliers. Visualizing data allows us to quickly internalize information. It's essentially storytelling with a purpose. If you've ever struggled to identify a trend in a large spreadsheet of data, you understand the power of visualization.
Data visualization is a powerful method to explore data and present results effectively. Its primary use is in the pre-processing stage of the data mining process. It supports the data-cleaning process by identifying incorrect and missing values.
Techniques of Data Visualization
Representing visual data requires various techniques that must be followed to achieve this process. Let's explore some of these techniques to make this process simpler and easier.
1. Temporal
Temporal data visualization offers the advantage of familiarity, as we are already accustomed to using such visuals, particularly in educational and professional settings where charts are commonly used for explanations. Linear and one-dimensional data visualizations play a crucial role in temporal data visualization. Examples of temporal data visualizations include linear graphs, polar area diagrams, scatter plots, time series sequences, and timelines.
2. Multidimensional
Multidimensional data visualizations, as their name implies, involve multiple dimensions, typically requiring at least two variables for a 3D data visualization. These visualizations often feature vibrant and striking graphics due to the numerous concurrent layers and datasets. They excel at condensing large amounts of information into key points. Examples of multidimensional data visualizations include histograms, scatter plots, pie charts, Venn diagrams, and stacked bar graphs.
3. Geospatial
Geospatial or spatial data visualizations involve overlaying different data points on familiar maps to connect them to specific geographic locations. Examples of geospatial data visualizations include Cartograms, Heat maps, Flow maps, and Density maps.
4. Network
Users of network data visualization can demonstrate connections between different data sets. Within this network, communication takes place via intricate connections linking one data set to another. Visualizations such as alluvial diagram charts, parallel coordinate plots, node-link diagram charts, word cloud plots, network diagram charts, non-ribbon chord diagram plots, and matrix charts are commonly used to illustrate the relationships between data sets.
5. Hierarchical
When information needs to be organized into clusters, hierarchical data visualizations are very helpful. However, creating these graphs is more complex compared to other forms of visualization. Hierarchical data visualizations can show a company's or organization's data and object hierarchy. Examples of hierarchical data visualizations include ring charts, sunburst diagrams, and tree diagrams.
Wrapping Up
Data visualization solutions are an essential step in data processing techniques. In the new era, data visualization is making its debut. With the introduction of next-generation technologies and the development of apparent frameworks, it is moving from art to science, opening up new opportunities.
Using the above guide, you can use data visualizations for processing your business data or use the help of data visualization consulting services. A leading data visualization company excels at this situation and can help you to implement this approach. There is a plethora of legacy modernization services available to modernize your business applications. To make data-driven decisions, choose top-quality data visualization services to create a data visual model.
0 notes
Text
3D Scatter Plot
How to Sell and Design Custom Sketches
Online money making choices typically require you to have some form of web site, and have some sort of skill in advertising and on-line enterprise to begin with. However, what if I instructed you that there was a technique to generate profits on-line utilizing your existing arts and crafts skills? For those who're involved, read on, as a result of we're going to check out Etsy, and how you can use your current arts and crafts abilities to realize money on-line. What Is Etsy? Etsy, and different websites like it, is a web-based portal that permits members of the positioning to list their original arts and crafts creations on the positioning, add a worth and shipping costs, and promote them to individuals around the globe. It is a little bit like eBay, besides that everything on it's handmade by the people who use the positioning. What Can You Promote On Etsy? Almost anything that's handmade. Individuals promote every little thing from full sized oil paintings handy beaded jewellery, hand knitted baby clothes and handmade candles. From leatherwork to portray, sculpting to sketching, if it's arts and crafts, you may promote it on the positioning. How Do You Make Cash? In contrast to some websites, Etsy does not take a fee off your sale. As a substitute, they permit customers to put up their arts and crafts on the site, in their own 'store' for a small fee per posting. You advertise your products, put a worth on them and embody transport prices, and you get publicity to the 1000's of people that use the site. It is like an internet craft market, with much more visitors! Is It a Good 3D Scatter Plot Concept? You probably have a pastime that you already do, and that you'd wish to become profitable on-line with, then Etsy is a great thought! It can provide you a lot more publicity to much more individuals, and will even lead to you being able to pursue your pastime full time, quite than solely on weekends and at night time! As you'll be able to see, in terms of getting cash online, and on-line business, it's not solely the technically gifted and the enterprise minded that can profit. Everybody, even people who prefer to work with their hands, can earn cash on-line, and either start or expand on an present money making concept. Sketches are nothing however free hand drawings that consists of many overlapping traces. Generally sketches are useful to record something for later use. Sketches will assist artist to increase his imagination power and give him a chance to develop one thing worthwhile within the subject of artwork. Attributable to advanced software, nowadays on-line sketches are also potential. This is very terrific that folks can specific their thoughts by creating sketches utilizing these software tools. Top-of-the-line digital packages for this type of art is Adobe Photoshop. In early days individuals have been utilizing MS paint software program, however it has very less options compared to Adobe Photoshop. You have to have laptop if you wish to create digital sketches. It's a very distinctive technique to create all the sketches amazingly using latest software and hardware on the pc. It also gives a better picture quality then you've ever anticipated. It makes very simple for the artists who needs to create pictures for commercial function like product posters, guide covers, video games and many more. Also the most effective characteristic of digital painting is that you may send it to anybody by way of electronic mail. Let me tell you one thing essential in regards to the adobe photoshop software. This software is the most advanced software program ever researched for portray, pictures and doodles. It offers high quality photographs and provides effective print quality. It is very straightforward to create sketches utilizing adobe photoshop. In case you are going through issue to create sketches utilizing mouse, then you will get digital pads or cordless pen to make it smoother. The cordless pen will act like a mouse and it transfers image on the computer drawn by the artist. From this software program even photographers can develop some special results in their images and may give them an attractive look. This is the superb revolution launched on the planet of painting and sketches. When you have just began attempting at hand on sketching, it's best to learn the valuable suggestions given right here. These will aid you in sketch making. It is best to first perceive that sketching cannot be learnt in a day. It's an artwork. To change into proficient in this field, it is advisable to work onerous and apply quite a bit. The more you follow, the simpler it is going to be to attract. Sketching is a free hand drawing made with pencil on paper. For making good sketches, you must have correct supplies like sketch pencils and paper. The standard of provides can affect the top results. Sketchers maintain pencils in different kinds like tripod grip, overhand grip and underhand grip. Nonetheless, there isn't a best model. You need to choose the type that you are most snug with. You should begin practising with simple figures like straight traces, curves, circles, ellipses, squares and triangles. Although, most individuals suppose that it is simple to draw such figures and they don't have to work exhausting, but it's not so. Many people cannot even draw easy figures with free hand. Mastering simple figures will enable you to to regulate your hand movement, which is step one to drawing a superb sketch. When you turn out to be proficient in drawing geometric figures, it's best to start drawing figures of landscapes, properties, and pets. Gradually transfer to the type of sketches that you just need to draw. For example, if you want to get into style designing, it is best to begin making free hand drawings of mannequins draped in numerous outfits. Equally, if you wish to grow to be a panorama artist, it's best to spend quality time in natural settings capturing its magnificence in your sketchbook. If you wish to become a cartoonist, it is best to draw caricatures of people and scenes. Proportion is a critical part of drawing good sketches. For instance, in case you are making a portrait, it's good to have a correct thought of distance between eyes, measurement of eyes and size of nostril. Even a mere change within the angle of face modifications these proportions. Due to this fact, a sketcher should be able to properly estimate the measurements. While making a sketch, it is best to first focus only on the outline. At all times work on detailing afterwards. Shading helps to offer a three-dimensional look to a drawing. It also helps a person to visualize whether the thing is shut or far away, whether or not it is stationary or moving, what is the texture of the thing, what time of day it is and so forth. Therefore, it is best to pay particular consideration to shading. Learn different styles of texturing. Put money into good quality comfortable pencils of different grades for shading your sketches. Throughout the initial learning course of, do not be too crucial of what you might have sketched. Study out of your mistakes and enhance with each drawing. Final however not the least, get training from an expert. You possibly can join a drawing class or study some expertise and tricks from a non-public tutor. You can too take the help of online drawing tutorials for studying easy methods to sketch. It's no secret that we're going by means of some significantly trying financial instances. Recession, melancholy, double dip recession, regardless of the consultants and analysts are calling it for the time being, instances are difficult and the unemployment price is one of the worst within the historical past of our nation. Whereas one of the things which I do is train folks how you can make cash with developing a website by affiliate internet marketing and advertising, admittedly it takes some time to develop a worthwhile web site which you'll be able to stay off of. Due to this fact at present we will talk about what to do once you're determined and canopy the way to make money on-line quickly. Extra importantly it will only discuss the right way to generate income quick online without cost particularly. Micro Job Sites Offering your companies is kind of possibly the quickest method to generate profits on-line quickly. Micro job websites like Fiverr.com are how a lot of people make a guaranteed fast buck by promoting their companies to interested purchasers. These are web sites which you'll be able to go to and earn money from just about anything which you'll think of. Take your abilities and promote them on these websites and involved clients will contact you about doing your advertised job for them. You receives a commission instantly for doing what you're keen on or have a ability for whether that is writing articles/content material, doing work in Photoshop for someone, doing a drawing or sketch, doing voiceover work; actually anything you can think of. GigHour, Gigbucks, Fittytown pay out at much larger tiers than Fiverr so think about how much whatever you're promoting is price and get to it. I've put together an entire resource on how you can earn money with Fiverr to face out from the crowd, discover clients, and get paid; this data might be utilized to any micro job web site, as well. Craigslist Craigslist is still an incredible place for locating quick one off jobs which pay in addition to full time employment. A number of years ago after I was simply starting in affiliate marketing and didn't know a lot to something about what labored and what did not work and was consequently nonetheless struggling to assist myself, I took to Craigslist and located a couple of jobs which stored me going in the quick term while I bought my footing. One job had me writing descriptions for a whole lot of economic products on an financial website stuffed with affiliate presents (which I did not even notice until later). I used to be paid $one thousand for only a few days of labor. Check out the "And so forth." part, half time section, or search "telecommuting" in your city or any variety of massive cities for gigs which you are able to do from your own dwelling. Just make certain to exercise your due diligence to just remember to're working with a good one that won't stiff you on fee. You must get a contract worked out to determine the parameters of your exchange with your contractual employer when it's a relatively massive sum of money like $1000. There are plenty of free contract sites on the market which you'll grab free documentation from and might easily edit on your functions. eBay eBay is an effective place to earn money online shortly by itemizing and promoting off your potential valuables to involved events for a fast payday. You can also check out what is promoting on eBay then pop in to your local thrift stores and pawn shops to search out these gadgets then resell them on eBay at a better charge for a pleasant profit. On-line Advertising and marketing Okay so I stated in opening that online/internet online affiliate marketing takes time to essentially take off. That doesn't imply that you would be able to't earn money on-line quickly by it, as properly. You will get a site registered for $7.49 with my GoDaddy Dot Com Low cost and hosting for $2.ninety nine a month via my GoDaddy Dot Com Discount, then you may get a website arrange in 10 minutes. Make that website into mini web site to advertise the perfect affiliate product in your area of interest by looking out OfferVault, ClickBank, Fee Junction, PayDotCom, LinkShare, ShareASale, and many others.. Then ship some traffic to that site and make some money in the brief time period whereas growing that mini site right into a content site within the background. You may also get a free weblog on WordPress.com but the issue with that is that it is not yours and also you're really benefiting and developing someone else's enterprise rather than your personal which isn't a good idea. Create Your Own Product Creating your personal product isn't as tough as you'd think. I'll have a complete useful resource devoted to educating methods to create your own online product and promoting it to make some huge cash. Affiliate marketing is one thing, but when you develop your individual product and monitor down your personal associates, that's when the actual money begins to return in and that is how the net entrepreneurs making 7 figures a yr make most of their money. At the very least you can make an info product inside a distinct segment which you may have experience and knowledge in. Individuals like digital merchandise as a result of it is an immediate obtain and informational products have traditionally all the time offered very effectively online, therefore the popularity of Clickbank. Get Artistic Go to your native mom and pop stores and ask them if they've a website for their enterprise and if not then offer to construct them a web site for a few hundred dollars. If the reply is no then start the haggling recreation. As I present in my movies on easy methods to set up a web site free of charge step-by-step once more and methods to use WordPress, you can set up a totally practical and attractive website in 10 minutes with no need any expertise. The point is to be inventive. There are lots of providers which you'll be able to supply which appear out of your reach however are easy to execute and there are lots of people who find themselves either lazy or daunted at something like the idea of establishing a web site. A creative thoughts plus advertising and marketing equals success in this case. When You're Determined Bear in mind When you're actually up towards the wall, be sure to contact agency like the Salvation Army, meals banks, or metropolis human service departments to ensure that you keep the lights on and meals on the table.
#3D Scatter Plot#3d scatter plot online#3d scatter plot matplotlib#3d scatter plot r#3d scatter plot excel#plotly 3d scatter r#plotly 3d scatter python#plotly 3d surface#plotly 3d surface r
0 notes
Text
A Step-by-Step Guide to an Online Excel Training Course
Excel is a powerful tool that can help you to streamline data and processes, making it easier to analyze and present information. This step-by-step guide to an online Excel training course can help you to quickly become proficient in the use of Excel. By the end of the course, you'll be able to create complex formulas, format and analyze data, and use data to create charts and graphs. You'll also learn how to make use of Excel's many features, such as pivot tables and macros. With this comprehensive guide, you'll be able to quickly develop the skills needed to become an Excel expert.
Introduction to Excel Basics
Excel is a powerful spreadsheet application that allows users to store, manipulate, analyze, and visualize data. It is an essential tool for anyone who works with data, from financial analysts, to statisticians, to scientists. Excel offers a wealth of features and functions which, when used correctly, can help you work with data more efficiently and effectively. This tutorial will provide an introduction to the basics of Excel, including how to navigate the user interface, enter and edit data, create formulas and functions, manipulate data and charts, automate tasks with macros, and analyze data with pivot tables.
Navigating the Excel User Interface
The Excel user interface consists of several key components. At the top of the window you’ll find the Ribbon, which contains all of the tools and commands you need to work with your data. The Ribbon is organized into tabs, each of which contains a set of related commands. Below the Ribbon is the Formula Bar, which displays the content of the currently selected cell and allows you to enter and edit data. To the right of the Formula Bar is the Worksheet Area, which displays your data in a grid of rows and columns. Finally, at the bottom of the window you’ll find the Status Bar, which displays information about the currently selected cell.
Working with Formulas and Functions
Formulas and functions are the building blocks of Excel, and allow you to perform calculations on your data. A formula is a combination of values, cell references, and operators that tells Excel how to calculate a value. A function is a predefined formula that performs a specific calculation, such as SUM or AVERAGE. Formulas and functions can be used to perform simple calculations, such as adding up a column of numbers, or more complex calculations, such as calculating a loan payment based on the loan amount, interest rate, and loan term.
Manipulating Data and Charts
Excel offers a variety of ways to manipulate, analyze, and visualize your data. You can sort and filter your data to find the information you need, and use conditional formatting to highlight important information. You can also create charts and graphs to visualize your data in a more meaningful way. Excel offers a wide range of chart types, from simple line graphs to complex 3D scatter plots, so you can choose the type of chart that best suits your data.
Automating Tasks with Macros
Macros are a powerful feature in Excel that allow you to automate tedious or repetitive tasks. A macro is a set of instructions that tells Excel to perform a series of actions, such as opening a file, copying data from one sheet to another, or formatting a range of cells. Macros can save you time and make your work in Excel more efficient.
Analyzing Data with Pivot Tables
Pivot tables are a powerful tool in Excel that allow you to quickly and easily summarize, analyze, and explore large datasets. A pivot table is a dynamic table that displays the sum, average, or count of data stored in another table. You can use pivot tables to quickly summarize data and create reports, such as sales reports, budgets, or expense reports.
Troubleshooting Tips and Tricks
Excel can be a tricky program to use, and sometimes it can be difficult to figure out why your formulas or functions are not working correctly. Fortunately, there are a few troubleshooting tips and tricks that can help you figure out the source of the problem. For example, you can use the F9 key to evaluate formulas step-by-step, or use the Trace Precedents and Trace Dependents tools to identify which cells are related to a particular formula. With the right troubleshooting tips and tricks, you can quickly identify and solve problems in Excel.
Conclusion
Overall, the A Step-by-Step Guide to an Online Excel Training Course is a great resource for anyone wanting to learn how to use Excel. It provides a comprehensive overview of the basics of Excel and how to use it effectively. It also offers plenty of practice activities to help reinforce the concepts that are taught. With its step-by-step approach to learning, this course is sure to help anyone become an Excel pro in no time.
0 notes
Text
Xlstat versions with 3d scatter

#Xlstat versions with 3d scatter license key#
#Xlstat versions with 3d scatter activation key#
#Xlstat versions with 3d scatter full crack#
#Xlstat versions with 3d scatter software#
STATIS: This technique is well-suited for forecast mapping, conventional analysis, and free-choice analyses.
Multifactor Analysis: This type of analysis examines a frequency graph, such as the one used to count animals.
Scatter plot: Create your graphics and choose the group’s color.
Non-linear regression is employed in various sectors, including pharmacology, through novel interfaces and other built-in models.
Additionally, parameter checks may be performed using decimal weights.
Additional screening and grouping options for more customized performance.
Impact Diagnosis: Calculate DFBetas, the distance to Mahalanobis, and other impact statistics.
Validate the variance’s normality and homogeneity assumptions.
Linear regression or ANOVA across millions of data points is used to choose the findings.
However, new choices for sorting (using the BEA or FPC methods) and selecting (using R2) variables are now available, and a more ergonomic approach to graphically seeing connection matrices. The computations are the same quality as those produced by the most remarkable scientific tools. XLStat Crack freeload also includes a tool for evaluating your energy series, regression using incomplete least squares, regression using main components, and classic regression. Specifically, XLStat has a feature for showing results in many dimensions, enabling you to inspect the data and identify trends visually.
#Xlstat versions with 3d scatter software#
XLStat Crack Version is dependent on Excel for data storage and display, but computations are performed using independent software components.
#Xlstat versions with 3d scatter full crack#
XLStat Full Crack + Licence Key 2022 Update Version It will complete all computations flawlessly, allowing you to focus on your numerical task. Its high-quality output minimizes the possibility of mistake s and omissions.
#Xlstat versions with 3d scatter activation key#
It is the analyzing program that analyses statistical data following 220 statistical canons.Īdditionally, XLStat Activation Key Free will provide more detailed findings, and you may apply statistical criteria to the subject values effectively with XLStat crack. It allows them to do various risk analysis functions. The “quality” option also enables customers to enhance the product’s quality. For example, the “Psy” function can analyze human behavior and psychological data. Additionally, it is capable of converting such data to scientific knowledge. XLStat freeload With Crack has a tool for data about the environment. It has a Biomed feature created exclusively for biomedical and medical workers. The outcomes help them to make informed business judgments.
#Xlstat versions with 3d scatter license key#
XLStat License Key assists markets in determining customer habits, trends, and so on. With this contribution, you have access to modeling and research tools. XLStat Software enables you to access all features from the same menu as the Excel ribbon. XLStat Latest Plus Licence Keygen freeload Excel’s resources have been exploited to manipulate data. Alternatively, you may purchase an extended version with unrestricted access to all toolbar features. Later, you can utilize the free version, which has fewer features. The primary objective of the XLStat Free add-on is to keep users informed about the current development in the world of Customer Tests Strategy. This data analysis program integrates seamlessly with Microsoft Excel. XLStat Download provides various extremely efficient quantitative and multivariable data analysis products for individuals and enterprises. It is a simple-to-use tool for manipulating statistical data. It integrates easily with Microsoft Excel as a contribution tool, simplifying statistical analysis. As a result, this add-in is straightforward to use and adapt. The Excel interface is more familiar to the average person. It has been on the market for over a year and offers over 200 features. XLStat Crack is a statistical analysis and visualization add-in explicitly designed for Excel users. XLStat 2022.2.1 Build 1321 Crack + Full License Key freeload
0 notes
Text
What is a 3D Scatter Plot Chart in Excel?
What is a 3D Scatter Plot Chart in Excel?
A 3D scatter plot chart is a two-dimensional chart in Excel that displays multiple series of data on the same chart. The data points are represented as individual dots and are plotted according to their x and y values. The x-axis represents time, while the y axis represents the value of the data point. When you create a 3D scatter plot chart, Excel creates a line for each series of data points and plots them on one graph. The lines can be plotted in three directions: across, down, or up (x-axis). The up and down lines represent positive and negative values, respectively. A 3D scatter plot chart is a type of chart that displays the relationship between two variables in three dimensions. It is called a scatter plot because it uses points to represent data. The x-axis represents one variable, while the y-axis represents another, and the z-axis represents the third variable. A 3D scatter plot chart allows you to see how two variables change across different levels of a third variable. This type of chart is useful for comparing how two variables are affected by different levels of one other factor. In this tutorial, we'll explain how to create a 3D scatter plot chart in Excel with step-by-step instructions and screenshots.

Where to Find the 3D Scatter Plot in Excel? A scatter plot is a type of graph used to visualize the relationship between two variables. It can be used to visualize trends and detect outliers. The more data you have, the better you can tell if there are any patterns in your data. A 3D scatter plot adds depth to your scatter plot by allowing you to visualize both independent variables on the x-axis and dependent variables on the y-axis as well as their relationship in a third dimension (z-axis). A scatter plot chart is one of the most common types of charts used in business intelligence reports. It displays data points by plotting them on a graph and connecting them with lines or curves. This type of chart is useful for identifying relationships between two variables. For example, say you want to see whether there is a relationship between age and height; a scatter plot would allow you to do so quickly and easily by displaying those two variables as numbers on axes next to each other. In order to create a scatterplot, you need to know how to use the Scatter Chart and 3D Scatter Chart functions in your Excel. The 3D scatter plot is a special kind of scatter chart. It allows you to present data in 3D space by using colour and size of markers, etc. There are two ways to create a scatterplot in Excel: 1) The first way is to use the Scatter Chart function; 2) The second way is to use the 3D Scatter Chart function; In order to create a 3D scatter plot in Excel, we will first need to understand how these functions work. How to Create 3D Scatter Plot in Excel? In this tutorial, we will learn how to create 3D scatter plot in Excel. The scatter plot is a chart that plots the values of two variables against each other. You can also display the third variable by adding it as an additional axis. Steps: 1. Select the data set that you want to plot on the chart. 2. Go to Insert tab > Charts group > select Scatter chart from the drop-down menu or click on the Insert button from Charts group, then select Scatter chart from the Insert dialog box. 3. In the Chart Tools Design tab > Layout group > select the 3D Format option under the Chart Layouts section and then choose any colour of your choice as the background colour for the chart (optional). 4. Now drag and drop one of the X-axis labels into the Values box under the Axes section so that it shows up on X-axis like “Years” in our example (optional). 5. Drag and drop one of the Y-axis labels into Legend Entries box under the Legend section so that it shows up on Y-axis like “Sales” in our example (optional). We have come to the end of our first post. We hope it helped you. You can read this article on the subject or you can read this article we found for you from another site. Read the full article
0 notes
Text
Blueprint Maker Free For Mac

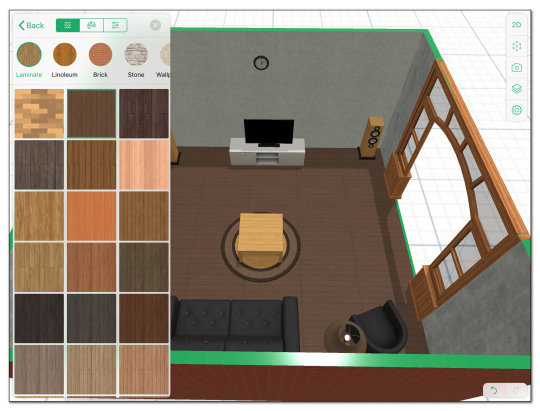
This is the best free graphic design software for animators, illustrators and designers. It can be used for 3D animation, figure posing and rendering. The software represents a combination of various graphic design platforms, solutions and additions, such as Hexagon, Genesis 8 and Daz Studio. Try A Simple FloorPlan Maker For Free. Planner5D is a unique program for online 2D and 3D visual designs. To start with your plan, go to the website, click on the 'Create new project' tab and begin! The floor plan creator suggests choosing one of two ways to work.
The CM-10-100 crew makerExcel spreadsheet allows you to assign 10 employees to 100 daily jobs and is ideal for businesses that need to create job-specific work crews that may vary in composition from day-to-day.
File Name:CM-10-100.zip
Author:Shift Schedules
License:Shareware ($299.00)
File Size:996 Kb
Runs on:Cross Platform
Creates PDF files from Printable file as DOC,XLS etc and all Images formates. PDF Cube Pro is a tool to create PDF files from all printable files and all images.It can covert PDF to Image, it can Merge and split pdf, Batch Encrypt and Decrypt PDF files, Print PDF file in Batch Process.
File Name:pdf-cube-pro.zip
Author:PDF Cube
License:Shareware ($39.95)
File Size:8.77 Mb
Runs on:WinXP, Win2003, Win2000, Win Vista
Excel Timesheet and Excel Timesheet Template Spreadsheet Maker -- Do you want a fast, quick and easy way to create a timesheet in Microsoft Excel, to keep track of your work. ...
File Name:exceltimesheetmakereval.exe
Author:Comodo Solutions Ltd
License:Shareware ($)
File Size:1.96 Mb
Runs on:WinXP, Win2003, Win2000, Win Vista, Windows 7
The main purpose of 'python2xlw' is to create an Excel-compatible file which can be sent to users via the web as an excel application. The motivation is mainly to support the display of XY Scatter plots and tabular numerical data(eg engineering. ...
File Name:python2xlw_0.1.zip
Author:python2xlw
License:Freeware (Free)
File Size:22 Kb
Runs on:Windows; Mac; Linux
Belltech Label Maker Pro is a label designer software to design and print address labels, ID cards, letterheads, flyers, postcards, envelopes and more from databases like Microsoft Access, Excel, csv or text files. Add linked images, label counter.
File Name:labelm.exe
Author:Belltech Systems
License:Shareware ($49.00)
File Size:5.58 Mb
Runs on:Win98, WinME, WinNT 4.x, WinXP, Windows2000, Windows2003
Belltech Label Maker Pro is a label designer software to design and print address labels, ID cards, letterheads, flyers, postcards, envelopes and more from databases like Microsoft Access, Excel, csv or text files. Add linked images, label counter.
File Name:labelm.exe
Author:Belltech Systems
License:Shareware ($49.00)
File Size:5.41 Mb
Runs on:Win98, WinME, WinNT 4.x, WinXP, Windows2000, Windows2003, Windows Tablet PC Edition 2005, Windows Media Center
Barcode Maker is an advanced application to efficiently create professional barcode labels in 26 supported barcode symbologies as UPC, EAN, ISBN, code 39 etc. Barcode Maker allows to edit barcode datasheet and import data from MS-Excel or Text file.
File Name:Setup.exe
Author:Barcode Maker
License:Shareware ($44.90)
File Size:7.74 Mb
Runs on:Win95, Win98, WinME, WinNT 3.x, WinNT 4.x, Windows2000, WinXP, Windows2003, Windows Vista
Calendar Maker to create editable and printable calendars in Excel -- Do you need to create a monthly or yearly calendar, that you can easily print out? Calendar Maker to create editable and printable calendars in Excel -- Do you need to create a monthly or yearly calendar, that you can easily print out? Use this calendar template software to immediately create calendars for whatever year you need. And, try out this software for free.
File Name:calendarcreatorexceleval.exe
Author:Comodo Solutions Ltd
License:Shareware ($)
File Size:1.98 Mb
Runs on:WinXP, Win2003, Win2000, Win Vista, Windows 7
WinCalendar is a Calendar Maker & Free Desktop Calendar that also integrates with both Microsoft Word & Excel. It supports importing of Google Calendar & Outlook Calendar Data. Can be used as a Google / Outlook Calendar converter (to Excel /. ...
File Name:SetupWinCalendarV4.exe
Author:Sapro Systems
License:Demo ($32.00)
File Size:6.74 Mb
Runs on:WinXP, WinVista, WinVista x64, Win7 x32, Win7 x64, Win2000, WinServer, Windows Vista, Windows 8
ID Flow Photo ID Badge Maker Software is the industry leading solution for secure ID card production, include 1D and 2D barcodes, magnetic stripe, biometrics, watermarks, photos and more. Print to plastic PVC cards or paper badges.
File Name:IDFlowDemo.exe
Author:Jolly Technologies
License:Demo ($599.99)
File Size:32 Mb
Runs on:WinXP, Windows2000, Windows2003, Windows Vista
Excel to XPS Converter does convert Excel to XPS, Excel to XPS, Word to TIFF, Word to JPG, Word to JPEG, DOC to TIFF, DOC to JPG, DOC to JPEG, PDF to TIFF, PDF to JPG, PDF to JPEG, DWG to TIFF,DWG to JPG,DWG to JPEG,DXF to TIFF,Word to PDF. ...
File Name:docprint_pro_setup.exe
Author:verypdf.com Inc
License:Shareware ($79.00)
File Size:12.97 Mb
Runs on:WinXP, Windows2000, Windows2003
Barcode Maker is an advanced and efficient barcode application with user friendly interface to generate proffessional barcode labels. Barcode Maker offers most usable barcode fonts as UPC, Code 39, EAN, ISBN, Code 128 etc. with various image formats.
File Name:Setup.exe
Author:Barcode Maker
License:Shareware ($44.90)
File Size:7.74 Mb
Runs on:Win95, Win98, WinME, WinNT 3.x, WinNT 4.x, Windows2000, WinXP, Windows2003, Windows Vista
Related:Blueprint Maker Excel - House Blueprint Maker - Blueprint Maker Free - Blueprint Maker Microsoft - Chrome Blueprint Maker


Create A Blueprint Free
Blueprint Maker Free For Mac Computers
Pages : 1 | 2 | 3>
0 notes
Text
Business Analytics On-line Certificate Course In India
ExcelR Data Scientist Course. The consequence is that enterprise managers employ technical options without having a good suggestion of how Data science can truly add worth to their businesses. To preside over a profitable implementation of data science within the organization the managers will need to have a good understanding of the basics, and it's quite inconceivable to get a really feel of Data science without getting one’s palms dirty. This course is an entirely arms-on approach to Data science where participants could be working with Data units to generate insights for companies. The goal of this course is to introduce participants to the world of Data science and who have not received a foothold into the strategies. ExcelR Solutions is the great place if you want to get on the earth of Data science and massive data with the help of industry and tutorial consultants. Hands-on training, theoretical data and the projects that I did, are actually serving to me whereas working in the industry.
The whole program is a extremely really helpful for any skilled who intends to land as a profitable Big Data Developer. The Data you've gained from engaged on initiatives, movies, quizzes, arms-on assessments and case studies provides you a aggressive edge. The sensible experience here at ExcelR Solutions shall be worth and different than that of different training Institutes in Thane. Practical Data of Big Data can be experienced via our digital software program of Big Data get put in in your machine. We follow evaluation and project based mostly method to make your studying maximized. For every of the module there might be a number of Assessment/Problem Statements.
This course serves as an introduction to the interdisciplinary and rising field of Data science. Students will learn to combine instruments and techniques from statistics, laptop science, Data visualization and the social sciences to unravel problems utilizing Data. Whether you are from commerce background or from science faculty, you'll be able to turn out to be specialist in Data analytics. Professionals similar to business analyst want to get growth in career. Any developer or programmer in software, whatever the programming language they have command in. Improve different expertise whereas studying Data Science- It isn't just technical.
ExcelR Data Scientist Course. This program calls for consistent work and time commitment over the entire period of 6 months. Cluster Analysis In this lesson, you'll find out about cluster analysis which creates clusters or teams primarily based on the values of variables. Multiple Regression In this lesson, you'll study Multiple Variable Statistics, which is the commonest software of Multiple Regression with the assistance of an inbuilt database. Multiple Variable Statistics In this chapter, some comparatively advanced subjects corresponding to multiple regression, cluster evaluation and principal component & factor evaluation have been lined in detail. These subjects are very important specifically multiple regression which is used very extensively in analysis papers and industry to establish the relationship between variables. 3D Scatter Plots In this lesson, you will be taught to plot a grouped Data with the assistance of 3D Scatter Plot.
By keeping an eye on the collected data and presently incoming Data you can even have a serving to hand in solving cases which are relatable to real-life incidents. If you hate working at an workplace you may also work as a marketing consultant Data Scientist.
It empowers the organizations with Data enabled accurate selections. Basics ideas of Statistics, R programming & Python have also been mentioned. Advanced topics involving AI, Machine Learning & Deep Learning have also been defined with arms-on live case research from the trade. Full credit to the college for his excellent subject clarification & steerage. Another level worth mentioning right here is that by the point of course completion we had been supplied assistance in not simply resume preparation but in addition in scheduling the interviews. We might be conducting both Regular Weekday and Weekend coaching periods and you may select whichever session based on your convenience. The course timings on this Data Science coaching program are additionally very versatile for each brisker and working professionals.
More Details-
Business Name- ExcelR- Data Science, Data Analytics, Business Analytics Course Training Mumbai
Address- 304, 3rd Floor, Pratibha Building. Three Petrol pump, Opposite Manas Tower, Lal Bahadur Shastri Rd, Pakhdi, Thane West, Thane, Maharashtra 400602
Contact- +91 9108238354
Email- [email protected]
Opening Hours- Monday to Friday 7AM to 10 PM Saturday & Sunday 10 AM 9 PM
Address Link- https://g.page/ExcelRDataScienceMumbai?share
0 notes
Text
300+ TOP SAP LUMIRA Interview Questions and Answers
SAP LUMIRA Interview Questions for freshers and experienced :-
1. Why do we use SAP Lumira as BI tool? It allows you to predict future outcomes and forecast as per changing market situations. You can create data visualizations and stories from multiple data sources. It helps you to adapt data to organizational needs to create stories with visualizations. You can share the visualizations on different platforms like SAP HANA, BO Explorer, Business Objects BI Platform, etc. 2. Why do we use custom calculations in data set? You can create custom calculations in Lumira data Visualization which are not available in data set or at database level. Example You have a “Salary” column in the data set, you can add a new calculated column with name “Bonus” and can apply a calculation on Salary to get the value of this column. 3. What is the use of different tabs in Lumira? Prepare This is used to import data set in SAP Lumira. Data cleansing is done and converted into the appropriate measures or attributes for the reports. You can add new custom calculations here. Visualize This tab is used to add graphs and charts on the data that has been imported and organized in Prepare tab. You can add different attributes and measures to Label axis. Compose This is used to create stories and presentation, including background colors, titles, pictures, and text. Share This tab is used to publish your visualizations to different platforms or with different set of users in BI Repository. 4. How do you connect SAP Lumira to HANA Modeling views? You can connect to SAP HANA Modeling views in SAP Lumira. You have 2 options - Connect to SAP HANA Download from SAP HANA 5. What is the difference between two options to connection to HANA Modeling views? By selecting option - “connect to SAP HANA”. This will allow you to access data in read mode and you can visualize data in charts. Download from SAP HANA This options allows you to copy the data locally and you can edit and manipulate the data to visualize in the charts. 6. Can we add hidden columns from an excel spreadsheets to Lumira dataset? Yes, on Advance option to select custom range. You can also include hidden rows and columns. 7. When you acquire a data set, it comes under which of the tab to perform data cleansing and editing? Prepare This is used to import data set in SAP Lumira. Data cleansing is done and converted into the appropriate measures or attributes for the reports. 8. How can you acquire data from an InfoProvider in Lumira dataset? Add new dataset --> connect to SAP Business Warehouse 9. When you use query with SQL option to acquire data set, you can see few of the connections in red and green. What is the meaning? To use SQL query to create dataset, go to file --> New Click on Query with SQL option to download a dataset and click on Next. JDBC drivers has to be installed for database middleware for using SQL query. The access driver is .jar files you can download from vendor site and copy to driver folder in application path. Select SQL query, all queries in green presents drivers are installed properly for middleware. Select database middleware for target database and click on Next. 10. What are the different connection parameters that can be configured while using Query with SQL as data source? Connection Pool Mode: To keep connection active Pool timeout: Time duration to keep connection active in minutes. Array Fetch Size: to determine number of rows to fetch from target database. Array Bind Size: Larger bind array, more number of rows will be fetched. Login Timeout: Time before a connection attempts a timeout. JDBC Driver Properties

SAP LUMIRA Interview Questions 11. What are the different panels in Prepare tab for data cleansing and applying filters? Dimension and Measure Panel It contains list of all dimensions and measures acquired in data set. Number in front of each object represents its data type. You can use different tools in this panel to edit the data objects and to add hierarchies. Dataset Selector You can select between multiple datasets or you can also acquire a new dataset using this option. Filter Bar This represents filter applied to any dimension in dataset. To add a filter click on the icon in front of dataset and click on Filter. 12. What is chart canvas? This is used to create or modify a visualization. You can directly drag attributes and measures to chart canvas or can add to chart builder. You can add various tools like Sorted by Dimensions Add or Edit a ranking by measures Clear Chart Fit chart to frame Reprompt Refresh Settings Maximize Undo Redo 13. What are the different chart canvas properties that you can set in Lumira? Chart Canvas Layout Chart Style Template Font Zoom, etc. 14. Where do you define properties for Chart Canvas? Go to File --> Preferences --> Charts Here you can define various properties for chart canvas. 15. What is the use of compose tab? You can create different stories in SAP Lumira in presentation style document using visualization, graphics and other customizations that has been applied to dataset. Once you go to compose tab you get multiple options to select an Infographic, Board or a Report. 16. What are the different chart types in SAP Lumira? Bar Chart Column Chart Radar Chart Pie Chart Donut Chart Tree Scatter Plot Bubble Chart Network Chart And many more 17. Which chart types are best suited to show correlation between different values? Scatter Plot Bubble Chart Network Chart Numeric Point Tree 18. What is the use of Geography charts in SAP Lumira? What are different chart types under this category? It is used to present map of country or globe present in the analysis. Common chart types are - Geo Bubble Chart Geo Choropleth Chart Geo Pie Chart Geo Map 19. What is Conditional formatting? It is used to mention critical data points in a chart by different values meeting certain condition. Multiple conditional formatting rules can be applied on measures or dimensions. 20. Which chart types support conditional formatting in SAP Lumira? Conditional formatting can be applied on - Bar and Column charts (except 3D column charts) Pie chart Donut chart Scatter chart Bubble chart Cross tab 21. Can you add multiple data sets in SAP Lumira? Yes, you can select between multiple datasets or you can also acquire a new dataset using this option. 22. What is the use of filters? Filters are used to limit the data in Lumira Visualizations. You can pass various filter conditions to restrict data comes in visualizations and stories. 23. Can we add filters in charts under Visualize tab? Yes, you can apply filter on a chart in Visualize tab. Click on Add filter and select aa dimension or a measure to add a filter to the chart. 24. What is the use of display formatting option in Prepare tab? You can set the below formatting for an attribute or dimension - Select a Value format Choose a Display format Prefix or suffix 25. Can we convert data types in SAP Lumira for dataset? You can also convert data type into another. In Prepare tab --> Go to column heading --> Options 26. What is the use of hierarchies? Hierarchies are used to display data at different granularity level and you can drill up/down at different levels for better understanding of relationship between objects. 27. What is geography hierarchy? How we can create geography hierarchy in dataset? When data is acquired, application looks for dimension containing location and present with an icon. Click on option icon in front of a dimension --> Create a Geographic hierarchy --> By Names (this option is available only for string dimensions). New window will open with name Geographical data --> select the dimension to map to hierarchy and click on Confirm. 28. What is the meaning of Green, yellow and red while acquiring data for a hierarchy? Locations mapped exactly are marked with green. Locations with more than one possible match (for example, if more than one city named London was found) are marked with yellow. Locations not found in the geographic database are marked with Red. 29. How do use hierarchies in the charts added to chart canvas in SAP Lumira? When hierarchies are defined on dataset, you can use drill up or drill down option to move to next level. 30. What is a custom hierarchy? You can create hierarchies using any available combination of dimensions in acquired dataset. 31. How do you create custom hierarchies in SAP Lumira? How do you define level in a custom hierarchy? Let us say you want to create a custom hierarchy on Category ? Product Select Category --> Options --> Create a Custom hierarchy New window will open. Enter the name of hierarchy and select the other dimensions to add to next levels and click on Create. Arrows can be used to change the level. 32. How you can open multiple dataset in a single Lumira document? It allows you to open multiple datasets in a single document and you can add dataset to a document. Go to Data pane at the top --> Add new Dataset 33. You have added multiple data sets in SAP Lumira. How do you perform merging of datasets? You can also merge two dataset by using Join operator. Go to Data pane at the top --> Combine --> Merge 34. To perform a merge on multiple datasets, what are the conditions to perform a merge? To merge : They should have same key column. Column with same data type can be merged. All columns will be merged. 35. What is the use of Merge type option in SAP Lumira? Merge type defines the type of join. You can select from different join types – Inner join, outer join, etc. 36. What is the different between combine and Append datasets in Lumira? Merge is used to apply different joins on datasets. You can use Union operator to append two datasets. 37. How do you append datasets in Lumira? To append datasets in Lumira, go to Data --> Combine --> Append To use append, both tables should contain same number of columns and compatible data types. Only compatible data types can be appended. 38. You have acquired datasets with different number of columns and different data types, when you perform append on these datasets what will happen? When you perform an append and both source and target dimensions are different, message appears-Union cannot happen. 39. If you want to see how data is spread over multiple axis in a single chart, which option you can use in Lumira? You can also add measures as a dimension in SAP Lumira. To do this add two or more measures as dimensions in the chart. This can be used to check how data is spread over multiple axis in a single chart. 40. How do you use measures as dimensions in SAP Lumira charts? Go to Settings and click on use Measures as dimensions option. Once you select this option, measures are displayed as new measure dimension in Dimension panel. 41. Is it possible to ass custom charts in SAP Lumira? You can use SAP Lumira software development kit SDK. You can add custom charts in SAP Lumira using VizPacker and these charts will be added to list of available charts in canvas. 42. How do you create stories in SAP Lumira in left, right, top and bottom slide show formats in compose tab? To create a slide show, go to Compose ? Board ? Create. You can select different types of charts Left, Right, Bottom, Top, etc. 43. Is it possible to create customize stories in SAP Lumira? How you can add company logos, custom images to Lumira presentations? You can also create customize stories in SAP Lumira. To create customize stories, you can add different types of pages in a story. To add a page click on Add Page and select a page you want to add to story. Drag the Visualization from left panel to the story. You can also add images from local machine. Go to Pictures and click on + sign. 44. To see the available built in images to add to Lumira presentations, where you can add these to stories? There are inbuilt images that can be used in a story. Go to Pictogram on left side and it will show you all the available pictograms that can be used in a story. 45. What are the different formats you can export your data sets in SAP Lumira? You can save dataset as .csv or. xls file. To do this go to Share tab and select the dataset from left panel. Go to File ? Export As 46. Is it possible to print the visualizations? How can we print the visluazations in SAP Lumira? Yes, To Print a Visualization, go to Share tab ? Select Visualizations and you will get an option to Print Visualization at the top. 47. When you publish a dataset to SAP HANA, all the visualizations that are created on dataset are also published? Select the dataset to be published. Once you select the dataset you will see the options to publish dataset to HANA. Only dataset is published to HANA server and not visualizations. 48. Can you send visualization in email to other users? What are the different export sizes that can be used? Yes, you can export a visualization to a printer or can also send in an email to a user. Go to options in a Visualization and click on Send by mail. Choose an Export Size- Small, Medium, Large 49. What are the different data sources you can use in Lumira to acquire dataset? You can use below data sources in SAP Lumira Excel file as a data source Working with CSV files Clipboard Connecting SAP HANA views Universe as a data source Using Query with SQL Using SAP BW InfoProvider as data source 50. How do use Universes as data source to acquire dataset in SAP Lumira? Universes that are created with .unx extension using Information Design Tool/.unv files created in UDT and published to BI repository can be used as data source in SAP Lumira. Go to File -->New --> Click on Universe option to connect and to download a dataset. SAP LUMIRA Questions and Answers Pdf Download Read the full article
1 note
·
View note
Text
Rune Factory 4 Special Review — It’s Always Been Special To Me
February 25, 2020 1:30 PM EST
Rune Factory 4 maintains its full and outstanding spark, charm, and polish for the Switch audience. The new content isn’t substantial, but the old content remains exceptional. This is absolutely worth your time.
Ahhh, Selphia. I missed you. It’s good to be home again.
I played the ever-loving hell out of Rune Factory 4 back on the 3DS, so getting the chance to revisit the Switch version was a welcome task. Even with this prior history, however, I’m amazed at how effortlessly it drew me in. The hardest part of writing this review has genuinely been dragging myself away from the game long enough to do so. Odds are that once I’m done here, I’ll be right back to it. Let that stand as a ringing endorsement of the game if nothing else.
youtube
“The hardest part of writing this review has genuinely been dragging myself away from the game long enough to do so. “
For those just tuning in, Rune Factory is a farming life sim that began as a fantasy spinoff of the Harvest Moon series (and which changed its name to Story of Seasons following disputes with Natsume over the title). It sought to spice up the more relaxed series by introducing magic, monsters, and other such elements to the mix. Rune Factory 4 was the latest in that subseries, and it added the most features, opportunities, and mechanical depth to date.
The game opens with a brief introduction of the player character (you choose the name and gender but no other customization at first) on an airship. They’re on a mission, but we don’t learn what that is because they’re promptly attacked by stowaway soldiers. Moments later, it’s revealed that they’ve come down with a case of amnesia — a Rune Factory staple — and promptly get punted off the airship.
You crash land on top of a dragon named Ventuswill, who assumes you’re the prince that’s due to arrive in town. It’s quickly clear that that’s not the case when the actual prince Arthur shows up, but that doesn’t stop him from foisting his responsibilities on you to focus on other tasks. With your sudden royalty established, you’re set up to live in the town of Selphia until your memory returns.
Though it comes across as something of an excuse plot at first, there’s a lot more going on here. As you play more, new characters will be introduced to Selphia, and new plot threads are uncovered. It’s nothing groundbreaking, but it’s present, and it’ll take you through several interesting arcs over the course of the game.
With that in mind, Rune Factory 4 never forces such a thing on you. Like the series it originates from, it’s a farming life sim first and foremost. Your day-to-day activities will involve you restoring and managing the farm in Selphia, growing crops, and taming monsters. Beyond that, you can wander the town and interact with the many characters. The real meat of the story is in the dialogue of this colourful cast. Even the most bizarre or bland of them quickly proves to have a lot of personality, and I found myself happy to chat with and befriend them as the days passed.
No good life sim is complete without the ability to take those friendships one step further, however. To that end, there are 12 romanceable characters among the cast: six bachelors and six bachelorettes. There aren’t any same-sex options, however, so keep that in mind if that’s something you’re looking for. And no, the dragon Ventuswill is not dateable. As you befriend your chosen waifu/husbando, you’ll get the option to profess your love, go on dates, and eventually marry and have a child. Margaret is best girl, don’t @ me.
“There are 12 romanceable characters among the cast: six bachelors and six bachelorettes. There aren’t any same-sex options, however.”
For many, this is likely the thing they’ll aspire towards in Rune Factory 4. With all that said, relationships take time to develop, so you’ll be off partaking in the rest of the game’s activities in the meantime. Beyond farming and interacting with Selphia’s denizens, you’ll be able to roam around the game’s world, fighting/taming monsters and plumbing the depths of dungeons. There’s a hell of a lot to find in these places, and lots of materials to gather from defeated enemies or resource points scattered around.
Once you’ve got your haul back to Selphia, you can choose to sell it off or stockpile it for use in the crafting system. You can make all sorts of weapons and equipment, as well as farming implements or medicines. There’s also a ton of cooking recipes as well, many of which offer consumable buffs that will be crucial in clearing some of the harder content. You can also level up your equipment by fusing various materials to them for added effects, so there’s a use for damn near everything you find.
Leveling up also extends back to your farming, too. Better farm tools make your chores quicker, which means you can expand your operations to more fields in less time. Improving the quality of soil and seeds means the crops you grow also improve, having stronger effects and higher value. You can grow crops into giant versions of themselves, have an orchard of replenishing fruit trees, or even grow a dungeon to clear out. Everything you do ties back into farming, and in return it allows you to excel at these other activities.
One of the best features of Rune Factory 4 is the skills system. Much like an Elder Scrolls game, your character will pick up a huge array of skills that can all be individually leveled up. Your various weapons, magic elements, and crafting types all fall into these, but even basic or esoteric stuff like Eating, Sleeping, and Bathing all have a skill. Increasing these will gradually increase your base stats as well, so no matter what you choose to do, you’re making progress and becoming more capable.
Because of this, the wealth of content on offer in Rune Factory 4 never becomes too overbearing. You don’t have to rush the plot, or maximize your farming early, or any other such thing. It’s up to you to determine what you want to do on each given day. There’s a lot more to do than another game of its ilk, but the leisurely sense of playing at your own pace remains.
It’d be fair to say that Rune Factory 4 is very much greater than the sum of its parts. Part of the reason it can flood the player with content is because most of the pieces are fairly simple. There’s depth to juggling all the various moving parts and maximizing your stats, sure. But taken on its own, each mechanic is fairly straightforward.
Combat is an action-RPG affair that sees you mostly mashing your attack button with your weapon of choice. You have the ability to dash as a soft dodge, and this can combo into a different attack, but beyond this, it’s very basic. You also can equip magic abilities to supplement this, but you’ll rarely be doing anything truly complex. Dungeons are long sequences of small rooms with very light puzzles and a mix of enemies on offer. Even on the higher difficulties, it mostly comes down to moving at the right times and having higher stats or more healing than the opponent.
Again, though, this all ends up serving the package as a whole. Combat isn’t too deep, but it increases your skills and grants materials for crafting. The crafting lets you proceed further, and also helps you with the farming. The farming likewise can give you stronger materials, consumables, or produce the right items to gift townsfolk. You can even use them on some monsters to befriend them, taking them into combat to supplement your abilities or keeping them on the farm to do chores and produce materials. Simple pieces, but it makes for a very large and beautiful puzzle.
“Rune Factory 4 is very much greater than the sum of its parts.”
By now, you hopefully have a good idea of what’s in store for you in Rune Factory 4. Everything I’ve said so far has all been true of the original 3DS release, though. So what else is new about Rune Factory 4 Special?
There have been a few adjustments made to compensate for the lack of the 3DS dual screen on a Switch. The second screen was usually dedicated to a minimap or other information, but instead, this is now presented in a transparent window in the corner. You can resize the minimap with a press of ZL, though, so it doesn’t get too intrusive. There’s also been a number of tweaks that allow you to enlarge text boxes, while ZR has been mapped to the frequently used Escape spell. Enough care and concessions were put in to make sure the transition to a different screen size is smooth, which is appreciated.
With all that said, it’s still very much a 3DS game in terms of appearance. The resolution has been increased and many of the models or images have been smoothed out, so the game looks far less pixelated than the original. Unfortunately, this is something of a double-edged sword; many of the flat images now look dull and simplistic despite the clarity. It was a lot harder to tell how everything was compressed to fit a 3DS screen and cartridge, but now that illusion has been lifted. The 3D models look good enough, but it’s all still clearly born of a handheld game. Those expecting high graphical fidelity won’t find it here, though the developers have done their utmost nonetheless.
Beyond the presentation, a few little additions have made their way into the port. English and Japanese dual audio is now available, toggled from the menu. There’s a new difficulty mode that’s quite punishing, but I honestly just found it more of a nuisance than an interesting challenge. Some games better suit being challenged on high difficulty, but Rune Factory 4’s combat depth is too basic and stat-driven to really warrant it. It’s there should you desire, however!
As for the new content… there isn’t all that much to it. Both showcased additions to Special are available on the main menu, but you won’t be able to access them immediately. Another Episode is a series of short segments displayed and voiced like a visual novel, each one focusing on a romanceable character. There’s also a bonus one for Ventuswill, which is the closest fans of the dragon goddess are gonna get this time around. Ultimately, these are simple, short, sweet, but not a particularly large chunk of content. They’re also DLC, but will be free for the first month or so if you get the game early.
The Newlywed Mode adds more gameplay in the form of an epilogue with your partner after you get married. Again, there’s one for each, and these remain locked until you marry that specific character in a playthrough. Given the overall length of the game, only the absolutely dedicated or determined are ever likely to see all of these.
But here’s the rub: I didn’t get to play any of these episodes in the course of my review. This isn’t for lack of trying, either. I clocked up well over 40 hours of playtime on Switch, and I’ve beaten the 3DS version previously. I know what I’m doing to speed things along, but outside of rushing and ignoring non-essentials, it didn’t happen. Not only did I not make it to marrying a character, but I’m not even close! I only really just started dating my waifu of choice. As such, I honestly can’t tell you about the quality of this new content or what’s entailed. I intend to come back after the game has launched and cover it once I get there, but I just wasn’t able to get through enough to make it in time for this review.
Despite this conundrum, I think it loops right back around to showcasing just how much content there is in Rune Factory 4. This game is utterly enormous. It’s varied, it’s engaging, and it’s a great time. Whether doing chores at a relaxed pace or grinding hard to overcome a particular challenge, this holds true.
There is a major criticism I can offer, however. Town Events will spring up at random throughout your game. These involve a selection of the cast and some antics going on in their lives, and often lead to some great insight into their personality or history. Nonetheless, these events are random. On a day determined by the game (it’s not set), one of these events will trigger. Your save file will always have an event trigger on that day, and reloading prior to that day will let you cycle through events to access a particular one if you’re dedicated.
“This game is utterly enormous. It’s varied, it’s engaging, and it’s a great time.”
Now, this might not be an issue if these were exclusively minor little events. The problem is, these Town Events also include a number of key scenes. In order to marry your partner, you’ll have to see all their prerequisite events, and some have more than others. More egregiously? The entire third Act of the plot including the last major area is locked behind this!
If you didn’t look online and just try playing at your own pace — as I did on the 3DS — it might take you a frustratingly long time to even realize that the plot continues and there’s more to do… only for you then needing to cycle the events until you trigger the right one. It’s utterly maddening, and the largest complaint I could level against Rune Factory 4. I was hoping this would be adjusted for Special, but alas.
As major an issue as this is, however, it’s one that you can overcome with a little patience and a touch of frustration. By the time you’re likely to reach this point, you’ll have played a tremendously large chunk of video game already, with still more ahead. It really astonished me just how much content was in a 3DS game, and this is still remarkable even now on a different system. Given that this is my only problem with the game outside of small nitpicks, it’s far from a deal breaker.
“While no individual aspect is the best of its kind, the overall package exudes charm and entertainment that is hard to match.”
So this is where we stand. Rune Factory 4 Special is an amazing game. It was my personal favourite 3DS game out of the large and varied library. It’s a game that I was more than happy to return to even if there was no new content whatsoever. I still know my way around Selphia and relish my time with it. Many love Stardew Valley, but as quality as that game is… I’ve never been able to play it without eventually going back and replaying Rune Factory 4 instead. I expect I’ll still be playing even when Animal Crossing rolls around. While no individual aspect is the best of its kind, the overall package exudes charm and entertainment that is hard to match.
If you haven’t played the original and this sounds even remotely like your kind of game, I heartily encourage you to try it. If you did play the original, you probably won’t get too much that you didn’t already experience. Should you just feel a little nostalgic for it and want to go back to one of the best farming life sims ever made, though? That was more than enough for me to adore my time with Rune Factory 4 Special, and will continue to do so long after you’re done reading this. Here’s hoping the upcoming Rune Factory 5 manages to capture that magic again.
February 25, 2020 1:30 PM EST
from EnterGamingXP https://entergamingxp.com/2020/02/rune-factory-4-special-review-its-always-been-special-to-me/?utm_source=rss&utm_medium=rss&utm_campaign=rune-factory-4-special-review-its-always-been-special-to-me
0 notes
Text
Days Gone – Review
From the makers of Syphon Filter and… Bubsy 3D, Bend Studio is now back with a new IP, Days Gone. On the surface, it seems like “that video game again”. As in, you’ve probably seen various elements of the game in other games before. Open world. Zombies (but not really). Survival elements. Crafting and upgrades. Three skill trees. Shooting and melee. Clearing outposts. You get the idea.
But Days Gone is better than the sum of its parts, though it barely held the parts together at times. Yet somehow, it’s still a hell of a ride from start to finish.
Note: Review based on version 1.02 and version 1.03 (pre-release, before the day-1 patch version 1.04), played on the base PS4
Presentation
Days Gone takes place in the wilderness of Oregon, USA, 2 years after “things went to shit” as it colloquially referred to. Society falls after an outbreak killed billions and turned many of them into Freakers.
The open world is gorgeous. There is a dynamic time and weather system that dramatically changes the environment as well as impacting gameplay. Heavy rain turns the side roads muddy and slippery while the night brings out most of the nasty Freaks.
If you like taking screenshots, there’s plenty of beautiful (and gross) sceneries. And the Photo Mode is decent.
The open world feels small but dense but over time, it becomes larger, with some changes reflective of the story.
The zombie-like but not-zombie Freakers look and sound gross. Blood and gore do spill, with body parts falling off the Freakers, or human enemies when heavy force is applied. Like shooting at the face with as shotgun.
Days Gone has plenty of cinematics with great performances by the actors. Though I find it jarring to see a few seconds of a loading screen, a cut-scene plays, and then another loading screen to go back to gameplay. It ruins the flow a bit, especially when the scenes are just a few seconds long.
It’s really enjoyable riding on the open road (when nothing is out to kill you). The excellent soundtrack kicks in slowly on the longer, uninterrupted journeys. That particular song, which starts and end dynamically, is emotionally charged, swooping and atmospheric as it is soulful and mellow. Perfect for a biker traveling the open roads.
When the faced with the horrifying Freakers however, tunes of dread and suspense pipes in. Whilst the tender, emotional moments are just heartwarming to hear. The overall soundtrack, including the choice of licensed music, is astoundingly well put together.
Unfortunately, the game is crippled with performance issues. The pre-release version I played through saw massive dips in framerate on the base PS4. Slowdowns, textures not loading in, and sometimes even assets not loading in will happen if you move fast enough. Especially while riding the bike.
You will definitely notice the slowdown. At worse, the game crashes.
I can’t tell whether the performance issues are due to the modified Unreal Engine they are using, or a sign we have reached the hardware limits of the PS4.
Gameplay
In Days Gone, you play as Deacon St. John, a former biker gang member (or for you Malaysians: an American Mat Rempit) who is now a Drifter. He does odd jobs for various encampments, either clearing up hideouts or finding lost people or taking out bounties. While the plan was to head out north, circumstances lead to Deacon losing his bike and having to keep doing jobs with the camps he wanted to get away from.
From there on, an overarching story of multiple threads will unravel, weaving various subplots in and out as you progress. You don’t have quest lines, you have storylines, where one mission may advance one or more storyline as it is being completed.
Though for the most part, it’s a story of a man still clinging to the past. Heck, the in-game day tracker counts starting from two years (more accurately, 734 days gone) since he last saw his wife.
The map is packed and there’s really not much downtime going to point A to point B. But the fact that the roads are all windy, filled with obstacles to avoid and danger lurking, you are really on your toes while riding the bike.
If you go on the road for too long, then you better start expecting trouble is coming, either a sniper ambush or swarms of Freakers.
Fiddly (By Design) Controls
You will need to spend some time getting the hang on Days Gone’s controls. R2 is for melee and you need to aim with L2 to use your gun, no blind fire. Grenades are tucked within the Survival Wheel, which requires holding L1, select the grenades category, wait a bit, then select the grenade of choice. Combat is not that fluid, but I guess it’s a deliberate design choice- it’s a survival game, after all.
Weapons are pretty inaccurate at the start, ammo is scarce, and powerful melee weapons break. You will need to use stealth and loot for resources, but you definitely can go gung-ho once you’ve got most of the skill upgrades and stat buffs.
Loot
If the survival elements sound dreadful, just take the solemn that Bend Studio took lessons from Red Dead Redemption II. Looting is quick and easy to do- some enemies like Freakers don’t even need a button prompt to loot.
Resources and melee weapons are scattered around the desolate buildings in the world. They are plentiful but don’t expect them to respawn immediately. Thankfully, gas cans and gas stations have infinite gas.
There’s a sense of permanence in Days Gone. I had a firefight in a small town but didn’t get to loot the area properly as I was locked in a story mission. Revisiting the area not long after (within the same in-game day) and all the bodies and missed crafting components are there as I remembered.
Some Bugs
Alongside the framerate drop and texture loading issues mentioned, the AI pathfinding also frequently bugged out. I’ve seen enemies stuck behind geometry, and even friendly NPCs during missions getting stuck because a Freaker body is in the way.
This game sure has some production values but moments when such issues pop up, coupled with the controls, make it feel like a janky, cobbled-up together game at times.
The Bike
The bike is the star of Days Gone’s gameplay. It’s your only mode of transport, and it needs to be taken care of. You need to keep it away from damage and make sure you have enough fuel or face some big issues. You don’t want to be on foot for too long with Freaks roaming around ready to maul you.
It really makes you consider your traveling plans. In the early game, you’ll have to stop by a gas station for fuel or find a gas can in one of those NERO checkpoints. I spent the first few hours lifting and coasting a lot to save fuel while driving very carefully not to hit anything. And I love that I have to do that.
But later on, you get to upgrade the bike with cosmetics and performance parts, either of which changes the bike’s look, You get to see the Engine III upgrade is a bigger engine block with a different, deeper engine tone. Even racing games don’t go that deep with customisations these days.
Welcome to the Freakshow
The Freakers come in various archetypes. From the little ki- I mean Newts, to Runners, infected wolves that will chase you down even when on a bike.
But the Horde is the big selling point for Days Gone. As those early trailers showed, they are indeed vicious and they are huge. The biggest Hordes have hundreds of these Freakers roaming together.
The early game is spent on avoiding the massive Hordes unless you have a death wish taking them on. But as you progress, Deacon will get more skill points, better weapons and also stat buffs that will allow you to mow them down. Yes, it’s a lot of just running around, then looking at the back taking pot shots but the areas you fight them in do have multiple routes and explosives to use to your advantage.
Crafting all the gear needed, stocking up ammo, and laying up all the traps before engaging the Horde is both the most exhilarating and the most cathartic experience in Days Gone. Nothing like mowing down hundreds of not-zombies after hours of just gasping looking the sheer size and wondering: “How the heck am I supposed to kill them all?”
Content
Days Gone is longer than you would expect. The game has about one hour worth of tutorial before opening up the world for you to explore. The fact the open world only opens up gradually means the size, and the number of side-missions available, will not overwhelm you as a result. Side-missions like clearing marauder camps each have a small reward, which can be tracked in the menus. And finding them is easy, just explore the map and it will mark the spot when you are close enough.
The story does feel cliche. “Sons Of Anarchy meets The Walking Dead” is a rather apt description, but the plot is more than just the biker life and post-apocalypse melodrama.
There are many interwoven subplots coming in and out of the main progression, all focusing on character interaction. Deacon is a dick, the name checks out, but a generic white-man protagonist he is not. Seeing him bouncing off with the rest of the cast, some with great chemistry, others with clashing personalities, is entertaining to see. And the poignant romance story, of how he is dealing with the loss of his wife, is gripping. With a great payoff.
Outside of the surprisingly good story, expect the same-old side missions and collectibles. It is an open world game, after all. Though taking down the Hordes is really fun to do by the end game.
It took me around 41 hours to finish Days Gone and see the credits. Though completionists will definitely spend more than that.
Personal Enjoyment
Days Gone sure sounds like just another open world game on paper with technical issues. But somehow, I really like it.
I am a stickler for games running at its intended framerate cap. So there’s a lot of moments where I just reel back and cringe seeing all the slowdowns. Despite that, the pros outweigh the cons. I enjoyed seeing Deacon’s story unfolded. The number of optional camps to clear is just enough- and with enough variety- to keep me engaged.
I enjoyed customising, upgrading and maintaining the bike. Plus, there’s enough wiggle room in the systems to see something dynamic happen. I tried taking down an ambush camp but forgot to put silencers on. That caught the attention of a nearby Horde and ravaged the camp for me while I cowardly hide in a bush. That’s neat!
Verdict
Days Gone is an ambitious open world survival game that is almost bursting at its seams. The dynamic open world is lovingly crafted to not only look good, but serve gameplay purposes. The customisable bike rivals those seen in racing games. The tension coming from facing the Freakers and managing your crafting resources won’t get old. The story is amazingly well told filled with great character moments.
Yet technical issues, from noticeable framerate drops to the various glitches and crashes are a letdown. It makes you think whether the PS4 is at its last legs… or the game is just too ambitious for its own good.
Whatever the case is, should you persist through the jankiness, Days Gone is the best open world biker survival game, that happens to have sort-of zombies, out there.
It’s a hell of a ride.
Review based on version 1.02 and version 1.03 (pre-release, before the day-1 patch version 1.04), played on the base PS4. Review copy provided by the publisher
Days Gone – Review published first on https://touchgen.tumblr.com/
0 notes
Text
Maintaining Data on Excel is becoming very difficult as the data is growing. Excel has become very slow as a result. Though my Mac has 16 GB of RAM, it takes between 2-3 minutes to save my Excel Workbook. So, I started making Applications and storing the data in Database. I have taken space in IBM Cloud for DB2 Database.
I spent the 2 days to make my Price Index Application. I programmed on Shiny for the first time and so had to frequently refer for syntax, etc. Shiny was my choice as it is easy to integrate R Language code in Shiny and present the output as a web page. I hosted my application on the R Studio server.
The application can be found at this URL – PriceIndex. It is also available from within this site under the Menu Option “Applications“.
The graphs do not make much sense now as the data set is small. However, as the data grows, I will add predictive analytics. Then, the site will recommend how prices of Stock Market and Gold will behave in future.
Also, I will next make this available as a Mobile App.
While writing this application, I came up some code snippets which can be useful for others trying to write applications in Shiny.
I used the following libraries to create this application. Note the syntax to installing the package if it is already not present in the environment.
if("shiny" %in% rownames(installed.packages()) == FALSE) {install.packages("shiny")} library(shiny) if("ggplot2" %in% rownames(installed.packages()) == FALSE) {install.packages("ggplot2")} library(ggplot2) if("scatterplot3d" %in% rownames(installed.packages()) == FALSE) {install.packages("scatterplot3d")} library(scatterplot3d) if("lubridate" %in% rownames(installed.packages()) == FALSE) {install.packages("lubridate")} library(lubridate)
I used RJDBC to connect to the DB2 database on IBM Cloud. To connect to the database, the following code was used. Note the use of dyn.load. It is absolutely required.
Also, find the path of db2jcc4.jar on your machine and provide the full path.
dyn.load('/Library/Java/JavaVirtualMachines/jdk-9.0.4.jdk/Contents/Home/lib/server/libjvm.dylib') library(rJava) library(RJDBC) #Enter the values for you database connection dsn_driver = "com.ibm.db2.jcc.DB2Driver" dsn_database = "BLUDB" # e.g. "BLUDB" dsn_hostname = "dashdb-entry-yp-lon02-01.services.eu-gb.bluemix.net" dsn_port = "50000" dsn_protocol = "TCPIP" dsn_uid = "<em>user_id</em>" dsn_pwd = "<em>password</em>" jcc = JDBC("com.ibm.db2.jcc.DB2Driver", "<em>path</em>/db2jcc4.jar"); jdbc_path = paste("jdbc:db2://", dsn_hostname, ":", dsn_port, "/", dsn_database, sep=""); conn = dbConnect(jcc, jdbc_path, user=dsn_uid, password=dsn_pwd) query = "SELECT * FROM PRICEINDEX"; rs = dbSendQuery(conn, query); df = fetch(rs, -1);
I use a validation to allow entry of prices as long as they are within 3 standard deviations from the mean. The maximum and minimum allowed values can be calculated as follows.
number_of_sd <- 3 minGold <- max(1, round(mean(df$Gold) - (number_of_sd * sd(df$Gold)))); maxGold <- round(mean(df$Gold) + (number_of_sd * sd(df$Gold)));
The code to create the User Interface is as follows. A number of layouts and panels have been used. You can check the way to use them. Also, notice that controls have been created at runtime using uiOutput() function.
ui <- fluidPage( # Application title fluidRow( column(width = 12, align = "center", h1("Price Index")) ), fluidRow( column(width = 12, align = "center", h3("Maintained by Partha Majumdar")) ), fluidRow( column(width = 12, align = "center", h6(paste("Last Updated On:", "21-March-2018"))) ), navbarPage("Price Index", tabPanel("Graphs", # Sidebar sidebarLayout( sidebarPanel( radioButtons("rbGraphType", h4("Select Graph Type"), choices = list("Bar Plot" = 1, "Histogram" = 2, "Line Chart" = 3, "Box Plot" = 4, "Scatter Plot" = 5, "Scatter Plot 3D" = 6), selected = 4), uiOutput("optionSelect"), uiOutput("subOptionSelect"), uiOutput("scatterSelect2"), uiOutput("scatterSelect3") ), # Show a plot mainPanel( plotOutput("dispPlot") ) ) ), tabPanel("Price Movement", # Sidebar sidebarLayout( sidebarPanel( fluidRow(column(12, span(h5("Prices of Potato, Tomato, Onion coming DOWN is GREEN, going UP is RED, no mevement is WHITE."),align='Center')), span(h5("Price of Gold going UP is GREEN, coming DOWN is RED, no movement is WHITE."),align='Center'), span(h5("Index of Sensex and NIFTY going UP is GREEN, coming DOWN is RED, no movement is WHITE."),align='Center') ), selectInput("ddlYearHTML", h4("Select Year"), factor(df$Year), selected = TRUE, multiple = FALSE), selectInput("ddlMonthHTML", h4("Select Month"), factor(df$MonthName)), fluidRow(column(12, span(h4("Prices of Potato, Tomato, Onion recorded at Shampura, Bangalore - 560032, India."),align='Center') )) ), # Show a plot mainPanel( fluidRow(column(12, htmlOutput("dispHTML") )) ) ) ), tabPanel("Data", # Sidebar sidebarLayout( sidebarPanel( radioButtons("rbDataType", h4("Select the Data to View"), choices = list("Raw Data" = 1, "Normalised Data" = 2), selected = 1), selectInput("ddlYear", h4("Select Year"), factor(df$Year), selected = TRUE, multiple = FALSE), selectInput("ddlMonth", h4("Select Month"), factor(df$MonthName)), downloadButton('downloadData', 'Download'), fluidRow(column(12, span(h4("Prices of Potato, Tomato, Onion recorded at Shampura, Bangalore - 560032, India."),align='Center') )) ), # Show a plot mainPanel( tableOutput("dispData") ) ) ), navbarMenu("Data Maintenance", tabPanel("Add", fluidRow( column(3, h5("Enter the Date for which you want to record the Prices. By default, today's date id entered. Date cannot be more than Today's Date."), h5("Enter the prices of the different commodities. By detault, the previous days prices are displayed."), h5("Click on Save button to save the prices") ), column(9, fluidRow(column(6, dateInput("diDate", "Enter Date of Observation", Sys.Date(), max = Sys.Date()) ), column(3, h5(paste("Should be less than",Sys.Date(),sep = " ")) ) ), fluidRow(column(6, numericInput("niPotato", "Enter Price of Potato per KG", subset(df, df$Date == max(df$Date))$Potato, min = minPotato, max = maxPotato, step = 1) ), column(3, h5(paste("Range:",minPotato,"-",maxPotato)) ) ), fluidRow(column(6, numericInput("niTomato", "Enter Price of Tomato per KG", subset(df, df$Date == max(df$Date))$Tomato, min = minTomato, max = maxTomato, step = 1) ), column(3, h5(paste("Range:",minTomato,"-",maxTomato)) ) ), fluidRow(column(6, numericInput("niOnion", "Enter Price of Onion per KG", subset(df, df$Date == max(df$Date))$Onion, min = minOnion, max = maxOnion, step = 1) ), column(3, h5(paste("Range:",minOnion,"-",maxOnion)) ) ), fluidRow(column(6, numericInput("niGold", "Enter Price of Gold per Gram", subset(df, df$Date == max(df$Date))$Gold, min = minGold, max = maxGold, step = 1) ), column(3, h5(paste("Range:",minGold,"-",maxGold)) ) ), fluidRow(column(6, numericInput("niSensex", "Enter SENSEX Index Value", subset(df, df$Date == max(df$Date))$Sensex, min = minSensex, max = maxSensex, step = 1) ), column(3, h5(paste("Range:",minSensex,"-",maxSensex)) ) ), fluidRow(column(6, numericInput("niNIFTY", "Enter NIFTY Index Value", subset(df, df$Date == max(df$Date))$Nifty, min = minNIFTY, max = maxNIFTY, step = 1) ), column(3, h5(paste("Range:",minNIFTY,"-",maxNIFTY)) ) ), fluidRow(column(6, passwordInput("piPassword", "Enter the Password") ), column(3, h5("Password is required to be able to save data") ) ), actionButton(inputId = "sbSave", label = "Save") ) ), fluidRow( column(12, h4(textOutput("DataEntry")) ) ) ), tabPanel("Update", fluidRow( column(2, "Updatesidebar" ), column(10, "Updatemain" ) )), plotOutput("dataUpdate") ) ) )
First let us look at the data entry window. To save the data, the "Submit" button to be pressed. This event can be captured using the observeEvent() function. A snippet of the validation code is provided. After the validation, the ode for saving the record was written.
observeEvent(input$sbSave, { validRecord <- 0; if(!is.null(input$piPassword)) { if(input$piPassword == password) {validRecord <- 1;} else {validRecord <- 0; msg <<- "Invalid Password"} } if(validRecord == 1) { if(!is.null(input$diDate) & length(input$diDate) != 0) { oldRec <- subset(dfDownload, dfDownload$Date == input$diDate); if(exists("oldRec")) { if(nrow(oldRec) == 0) { validRecord <- 1 } else { validRecord <- 0 msg <<- "Record already exists" } } else { validRecord <- 0 msg <<- "Invalid Date provided" } } else { validRecord <- 0 msg < Sys.Date()) { msg <<- "Date cannot be greater than Today" validRecord <- 0 } else { validRecord <- 1 } } ...
If you want to suppress the output of a part of the code, then put the code inside a sink block.
{ sink("/dev/null"); newRecord <- data.frame( Date = as.Date(input$diDate, "%Y-%m-%d"), Potato = input$niPotato, Tomato = input$niTomato, Onion = input$niOnion, Gold = input$niGold, Sensex = input$niSensex, Nifty = input$niNIFTY ) ; sink(); }
By default, the variables in a code block are local. If you want the values of a variable to be available throughout the code, then use the
<<-
operator instead of
<-
operator.
dfDownload <<- rbind(dfDownload, newRecord)
To download the data into a Comma Separate Values file (CSV File), you can use the following code.
output$downloadData <- downloadHandler(
# This function returns a string which tells the client # browser what name to use when saving the file. filename = function() { paste("PriceIndex", "csv", sep = ".") },
# This function should write data to a file given to it by # the argument 'file'. content = function(file) { # Write to a file specified by the 'file' argument write.table(dfDownload, file, sep = ",", row.names = FALSE) } )
Based on event, if you would like your code to respond, you would need to program the reactive() function.
outputData <- reactive({ if(is.null(input$ddlMonth)) { df1 <- subset(df, df$Year == input$ddlYear) } else { if(input$ddlMonth == "") { df1 <- subset(df, df$Year == input$ddlYear) } else { df1 <- subset(df, df$MonthName == input$ddlMonth & df$Year == input$ddlYear) } } ... } output$dispData <- renderTable({ outputData() })
To build controls based on conditions, following code provides an example. Here, based on the type of Graph, the choices Radio Buttons are built dynamically.
choiceRadioButton <- reactive({ if(as.numeric(input$rbGraphType) == 1 | as.numeric(input$rbGraphType) == 2 | as.numeric(input$rbGraphType) == 3 | as.numeric(input$rbGraphType) == 5) { radioButtons("rbCommodity", h4("Select Commodity"), choices = list("Potato" = 1, "Tomato" = 2, "Onion" = 3, "Gold" = 4, "Sensex" = 5, "Nifty" = 6), selected = 4) } } )
…
output$optionSelect <- renderUI({ choiceRadioButton() })
To create the Bar Chart, the following code can be used. There are more features in the qplot function. I will update them later.
output$dispPlot <- renderPlot({ if(as.numeric(input$rbGraphType) == 1) { #Bar Plot if(is.null(input$rbCommodity)) { x <- data.matrix(df[2]) } else { x <- data.matrix(df[as.numeric(input$rbCommodity) + 1]) } qplot(x, geom = "bar", fill = I("yellow"), colour = I("red")) }
To display the Histogram, the following code was used.
else if(as.numeric(input$rbGraphType) == 2) { #Histogram if(is.null(input$rbCommodity)) { x <- data.matrix(df[2]) histTitle <- "Potato" } else { x <- data.matrix(df[as.numeric(input$rbCommodity) + 1]) histTitle <- switch(as.numeric(input$rbCommodity), "Potato", "Tomato", "Onion", "Gold", "Sensex", "NIFTY") } histTitle <- paste("Histogram of", histTitle, "Prices between", as.character(min(df$Date)), "and", as.character(max(df$Date)), sep = " ")
# generate bins based on input$bins from ui.R if(is.null(input$bins)) { l <- 30 } else { l <- input$bins } bins <- seq(min(x), max(x), length.out = l + 1)
# draw the histogram with the specified number of bins hist(x, breaks = bins, col = 'darkgray', border = 'white', xlab = "Price Bins", ylab = "Frequency", main = histTitle) }
To display the Line Chart, the following code was used.
else if(as.numeric(input$rbGraphType) == 3) { #Line Chart if(is.null(input$rbCommodity)) { all_prices <- ggplot() + geom_line(data = df,aes(x=c(1:nrow(df)), y = Potato), size=1, colour="brown") + geom_line(data = df,aes(x=c(1:nrow(df)), y = Tomato), size =1, colour = "red") + geom_line(data = df,aes(x=c(1:nrow(df)), y = Onion), size =1, colour = "purple") + labs(x = "Date", y = "Price in Rs.") print(all_prices) } …
To display the Box Plot, the following code was used.
else if(as.numeric(input$rbGraphType) == 4) { #Box Plot dfBox <- data.frame(label = factor(rep(c("Potato","Tomato", "Onion", "Gold", "Sensex", "Nifty"), each=nrow(df))), value = c(df$N_Potato, df$N_Tomato, df$N_Onion, df$N_Gold, df$N_Sensex, df$N_Nifty)) ggplot(dfBox, aes(x=label, y=value)) + geom_boxplot() }
To display the Scatter Plot, the following code was used.
ggplot(data = dfnew, aes(dfnew[3], dfnew[4], color = factor(MonthNum))) + geom_point(aes(x = data.matrix(dfnew[3]), y = data.matrix(dfnew[4]))) + scale_size_area() + xlab(XLabel) + ylab(YLabel) + ggtitle(paste("Scatterplot of", XLabel, "vs.", YLabel, "and Month", sep = " "))
The user interfaces are shown below.
Programming with Shiny Maintaining Data on Excel is becoming very difficult as the data is growing. Excel has become very slow as a result.
#Application#Cloud#Data Analysis#Data Analytics#database#Design#GUI#internet#Programming#R#R Language#Server#Shiny#Statistical PRogramming#Statistics#UI#User Interface#Web
0 notes
Text
New Post has been published on Top 10 of Anything and Everything!!!
New Post has been published on http://theverybesttop10.com/most-popular-online-slots/
Top 10 Most Popular Online Slots
Top 10 Most Popular Online Slots
The developers of slot games come with new ideas every day. Every new game that is developed supersedes the previous versions in terms of jackpots, features, gameplay and graphics. Games make life colourful, bright and unbelievably exciting. This list of the top ten most popular games is made with some of the most advanced and up to date technologies. Their interesting plots and amazing free no deposit bonuses are what has made these games become most preferred by the players.
Top 10 Most Popular Online Slots
Frankie Dettori’s Magic Seven Slots
1 – Frankie Dettori’s Magic Seven
Playtech provides this title which commemorates one of the greatest achievements in sporting. It is made of moving graphics that represent Frankie’s historic day. It is made up of twenty-five paylines and five reels. On top of this, it has casinos Free Spins no deposit and some few expanding wilds. The aim is to get at least three of the similar elements on the reels and this will earn you rewards. You will the grand prize and 7777x your bet of the game when you put five Frankie headshots on the reels.
Iron Man 2
2 – Iron Man 2
The slot is made based on the hero of a Marvel comic book. Tony Stark who is the inventor of this great slot machine is also the game’s superhero. Just like other Marvel slots, the twenty-five lines and five reeled slot features a Marvel Mystery Progressive Jackpot. The jackpot is randomly activated just before the game ends. It has exciting gameplay and slick graphics. The game is loaded with entertainment and especially during the interactive bonus game.
Deal or No Deal Slots
3 – Deal or No Deal
This popular and amazing TV game show was converted to a twenty paylines and five reels online pokie. It features a progressive jackpot that players are quite happy about. Placing a maximum bet puts you in a good chance of winning the jackpot. The great audio has contributed to the slot success for it captures the essence of the TV show. The business may be risky but you get more rewards when you wait longer.
X-Men Slots
4 – X-Men
If you have been a fan of slot machines for a long time, then you have probably heard or played X-Men. It comes with twenty-five paylines, five reels and engaging features which make it among the most popular. The paying scatters, a wild and an extra wild, and Villains and Heroes bonus rounds wards the player unlimited free games. The X feature and the multi-level Mystery Progressive jackpot reward you a 5x multiplier. This game will never disappoint you.
(adsbygoogle = window.adsbygoogle || []).push();
China Shores
5 – China Shores
Konami has managed to come up with a slot machine that is among the top rated. China Shores is an outstanding game made with a Chinese theme. Its extravagant features increase the likelihood of the player getting big wins. Konami has hit the jackpot for coming up with decent and attractive slot machines and this is just one of them.
Beach Life Slots
6 – Beach Life
There is so much to attract you to the Beach Life slot machine starting from its looks, personality, and the beach life itself. Other things that will interest you in the game are the scatter and wild symbols as well as the average payout jackpot of $2 million. The mammoth potential winning and excellent basic graphics are what has brought it in this list.
Circus of Cash
7 – Circus of Cash
This game is among the most popular slot machines due to its innovative and unique bonus rounds feature. It has more than nine bonuses and also has a progressive jackpot. Just like a perfect date the slot machine is entertaining and funny and have women with beards.
Jacks or Better
8 – Jacks or Better
You will find this video poker mainly in online or land-based casinos. The standard poker ranking, a 52 card deck and a mixture of spinning reels make the game outstanding among many others. The player aims to get the Royal Flush and you can be sure to be awarded with a jackpot as soon as you get it.
(adsbygoogle = window.adsbygoogle || []).push();
Thunderstruck II Slots
9 – Thunderstruck II
Can you imagine a man with a hammer, the lighting and the romance? The pokie is designed with Norse Mythology. It is an upgrade from the previous Thunderstruck. The sound effects and the graphics are of higher quality compared to its predecessor. The epic machine has 243 enable paylines and a sequence of incredible features.
A Night Out Slots
1 – A Night Out
The slot machine will make you feel like you are having fun on a Friday night. It is packed with exceptional features such as a Dollar ball which is the progressive game’s jackpot; a dance floor scatter element, wild beer element, and bartender bonus. You definitely know why this slot appeared on this list of popular games. It is everything one would desire to experience from lots of action, lots of light in a town full of lurid cocktails. It will be your lucky day when you join Cindy, Roxy and Kat in the Night out.
The above games are tested, and they are safe to play. The movie franchise, interactive bonus rounds and 3D graphics and effect will take you to experience new heights. Consider factors such as progressive jackpots, lucrative paytables, Bonus features and storylines to get the best slot machine to play. Enjoy the games but remember to play responsibly.
0 notes