#DataLove
Explore tagged Tumblr posts
Visit Tumblr Blog
Explore Tumblr blogs with no restrictions, modern design and the best experience.
Last Seen Tumblr Blogs


Fun Fact
Tumblr is available in 18 languages.
Text

Are you a data set? Because every time I analyze you, I find new patterns that make me want to learn more.
.
1 note
·
View note
Photo


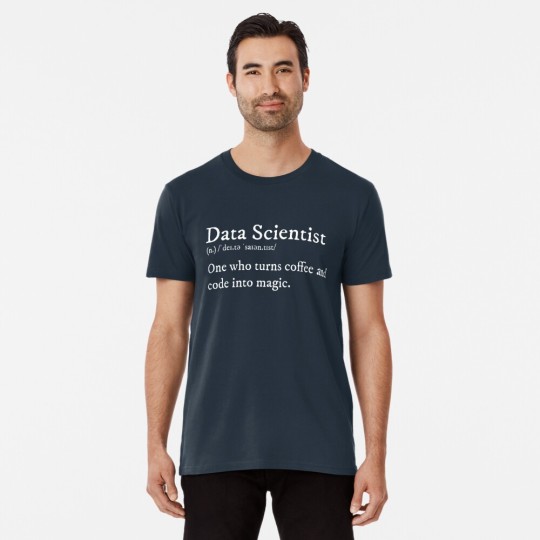


(via "Data Scientist Design" Classic T-Shirt for Sale by PiquantPigments)
0 notes
Note
fellow star trek jew. im not sure if youre a datalover like myself but while it is obviously a deep, deep oversimplification of what a golem is- do you thing data & lore could be considering a kind of... futurism golem? while the soongs arent canon jews, spiner is openly a jew (and noonien gives me hardcore Resident Jew Of The Village vibes) and noonien sculpted data & lore into men and who knows whats written on that emotion chip and i feel like there could be definite parallels with the emotion chip and lore's going haywire vs data's emotion chip things... what if doc soong's colony (or at least his [jewish] community) had data as their fitst step to a protector to at least him as a jew or the colony's jewish community or idk.
im rambling now my mind is getting away from me and i dont know as much about golems as id like. but. the soong-type androids being futurism golems.
ROTATING THIS ASK IN MY BRAIN LIKE A FINE ROTISSERIE CHICKEN
53 notes
·
View notes
Text
¡📊✨ Simplifica tu Excel con estos Trucos y Consejos para eliminar filas vacías! 🚀✨ Aprende a mantener tus hojas de cálculo ordenadas y eficientes en solo unos pasos. 😎🔍
🔗 ¡Descubre más aquí!
youtube
#ExcelPro #TrucosDeExcel #ConsejosÚtiles #Productividad #ExcelTips #OrganizaTuVida #OficinaEficiente #DataLovers 🖥️💼📈
0 notes
Photo

4 notes
·
View notes
Photo
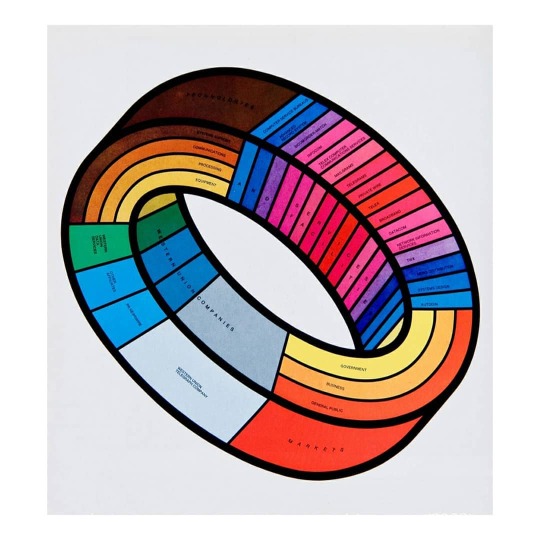
Data visualization from Graphis Diagrams: The Graphic Visualization of Abstract Data by Walter Herdeg, 1974. - #graphis #graphic #posterlove #posterdesign #datalove #datavisualization #graphisdiagrams #graphicindex #graphisdiagrams #swissgraphicdesign #swissdesign #vintageposter #vintagegraphicdesign #data #moebius #mobius #mobiusstrip #impossiblecircle #graphicart #visualgraphc #visualization #graphicdesigncentral #graphicinspiration #optart #graphicprint #printisnotdead #graphicdesign #visualgraphc #visualdesign #designgrafico #diseñografico #grafischontwerp https://www.instagram.com/p/CDdbTXFBm7X/?igshid=ogs12ipfuxf7
#graphis#graphic#posterlove#posterdesign#datalove#datavisualization#graphisdiagrams#graphicindex#swissgraphicdesign#swissdesign#vintageposter#vintagegraphicdesign#data#moebius#mobius#mobiusstrip#impossiblecircle#graphicart#visualgraphc#visualization#graphicdesigncentral#graphicinspiration#optart#graphicprint#printisnotdead#graphicdesign#visualdesign#designgrafico#diseñografico#grafischontwerp
0 notes
Photo

Rin - Data Love on Youtube
1 note
·
View note
Text
Week 1
Hi there, DATAlovers!
Yes, that’s what I’ll be calling y’all. I am taking a pretty interesting course on Coursera, Data Management and Visualization. It started out as a work thing but it may be love. I will try to regularly post my progress over the next couple of weeks so we could share this journey together! Feel free to comment or provide suggestions, I would love the feedback! Be kind!
1 note
·
View note
Text
python programming company
A high-level, all-purpose programming language is Python. Code readability is prioritised in its design philosophy, which makes heavy use of indentation. Python uses garbage collection and has dynamic typing. It supports a variety of programming paradigms, such as functional, object-oriented, and structured programming. Nowadays, a lot of Linux and UNIX distributions offer a modern Python, and installing Python is typically simple. Even some Windows machines now come pre-installed with Python, most notably those made by HP. For most platforms, installing Python is straightforward, but if you do need to do so and are unsure how to go about it, you can find some tips on the Beginners Guide/Download wiki page.

#devopscommunity#pythonprogrammers#savedata#savemoney#sqldeveloper#aiuse#dataproblems#datasolution#dukanhvadduvil#guldborgsundtriathlonklub#saucony#aisolution#dataarchitecture#dataaudit#dataconsulting#dataimportant#datalover#dataprojects#datasciences#datastrategy
0 notes
Text
Tableau certification with training in Noida
A computer science study at Stanford that sought to enhance the flow of analysis and increase data accessibility for individuals led to the founding of Tableau in 2003. Tableau’s core technology, VizQL, was created and patented by its co-founders Chris Stolte, Pat Hanrahan, and Christian Chabot. VizQL visually expresses data by converting drag-and-drop operations into data queries via an intuitive interface. Since our founding, we have consistently made unmatched investments in research and development, creating solutions to assist anyone working with data in finding answers more quickly and discovering unexpected insights.
One of the most well-liked tools for business intelligence and data visualization that aids in seeing and comprehending data is Tableau. To gain meaningful insight from the data, it is helpful to develop interactive graphs and charts in the form of a dashboard and spreadsheet. It enables us to quickly assess trends graphically and decide. Its primary applications are: 1. Data exploration and analysis 2. Development of dashboards 3. Production of reports 4. Data storytelling 5. Predictive modelling 6. Joint analysis of data 7. Data visualisation 8. Analyzing data in real-time
From past few years, APPWARS Technologies has been regarded as Noida’s top Tableau training facility. It aims to provide high-quality training in various situations. Consequently, joining APPWARS Technologies will be a wise career decision if you too want to learn more in-depth knowledge about Tableau. You can learn how to create graphics and organize data using their Tableau certification program. You will be able to make more insightful business selections if you use these abilities. Tableau is a fantastic tool for visualizing data, and this course will teach you how to map data. Additionally, you will comprehend how ideas like statistics and data mapping relate to Tableau and how they might enhance your proficiency with it.
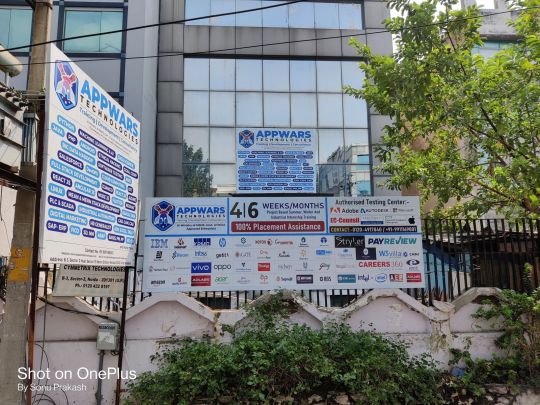
Here is the link to connect with APPWARS Technologies :- https://appwarstechnologies.com/tableau-training-in-noida/
#TableauSoftware#Tableau#datarock#data#datalover#dataanalytics#dataanalysis#dataanalyst#bitool#businessanalysis#businessanalytics#businessanalyst#businessintelligence#datarockstar#datahero#TableauConference#TableauWorkshop#TableauDesktop#TableauServer#TableauOnline#dataviz#datavizualisation#TableauDashboard#Dashboard#vizable#viz#bigdata#datapluswoman#womanindata
0 notes
Photo
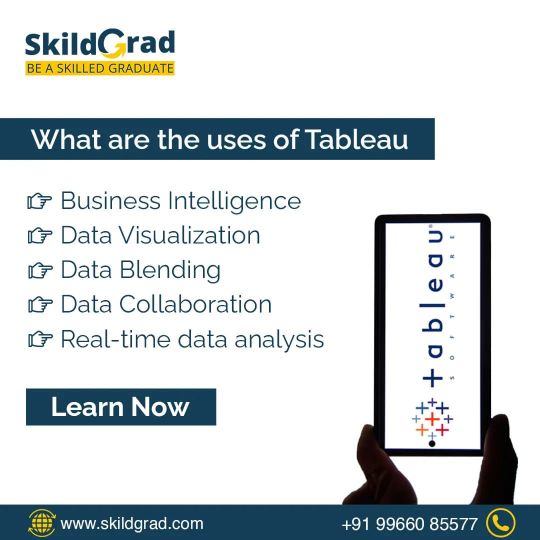
This data visualisation tool has been utilised by the business intelligence sector ever since it was first developed. Tableau is widely used by businesses like Amazon, Walmart, Accenture, Lenovo, and others. Follow us for more interesting tips career If you wants to excel your career in Tableau, give a call now for a free demo Contact: 9966085577 or Visit: https://skildgrad.com/courses/tableau/ #SkildGrad #onliencourse #TableauSoftware #Tableau #datarock #data #datalover #dataanalytics #dataanalysis #dataanalyst #businessanalysis #businessanalytics #businessanalyst #businessintelligence #datarockstar #datahero #TableauWorkshop #TableauDesktop #TableauServer #TableauOnline #datavizualisation #tableaudashboard https://www.instagram.com/p/CiRsCtGvCXJ/?igshid=NGJjMDIxMWI=
#skildgrad#onliencourse#tableausoftware#tableau#datarock#data#datalover#dataanalytics#dataanalysis#dataanalyst#businessanalysis#businessanalytics#businessanalyst#businessintelligence#datarockstar#datahero#tableauworkshop#tableaudesktop#tableauserver#tableauonline#datavizualisation#tableaudashboard
0 notes
Photo

✍️Enroll Now: https://forms.gle/6PA5g9JfKNqH5dhM7 🔥Special Offer Rs. 8,000/- Only 👉Attend Online Demo on Tableau By Real-Time Expert | Sriman IT 📅Start Date: 30th August @ 8:00 PM IST For More Details: Call: +91-9985014433 WhatsApp: 9985024433 📪Email: [email protected] 🌐Website: www.srimanit.com 📩Join us on Telegram : https://t.me/sriman_it 📩Subscribe Our YouTube Channel : https://www.youtube.com/channel/UC26qAebkJyZ-e7k26refLVA 📩Join us on Facebook : https://www.facebook.com/SrimaniTech/ 📩Join us on Instagram : https://www.instagram.com/sriman_it/ 📩 Join us on Twitter : https://twitter.com/sriman_it 💥Features of Online Training ✅ Real-Time Oriented Training ✅ Live Training Sessions ✅ Interview Preparation Tips ✅ FAQ’s #tableau #tableaututorial #tableaututorialfromscratch #tableautraining #tableautrainingforbeginners #tableauonlinetraining #tableauinterviewquestions #tableaucourse #tableauproject #tableauforbeginner #tableaubasics #tableauserver #tableauservertraining #tableaucertification #tableaucertificationtraining #datarock #datalover #dataanalytics #dataanalysis #dataanalyst #bitool #businessanalysis #businessanalytics #businessanalyst #businessintelligence #tableauconference #tableworkshop #tableaudesktop #tableauserver #tableauonline (at Hyderabad) https://www.instagram.com/p/CTHhWDipH5O/?utm_medium=tumblr
#tableau#tableaututorial#tableaututorialfromscratch#tableautraining#tableautrainingforbeginners#tableauonlinetraining#tableauinterviewquestions#tableaucourse#tableauproject#tableauforbeginner#tableaubasics#tableauserver#tableauservertraining#tableaucertification#tableaucertificationtraining#datarock#datalover#dataanalytics#dataanalysis#dataanalyst#bitool#businessanalysis#businessanalytics#businessanalyst#businessintelligence#tableauconference#tableworkshop#tableaudesktop#tableauonline
0 notes
Photo
In the last months the DataBeersTorino organizing team has been super busy with projects and deadlines. Otherwise we strongly believe in the power of community, and in the love for Data.
Would you like to help us organize a new episode of our favorite event?
Call for speaker is officially open!
If you are interested send us an email to:
databeerstorino [at] gmail [dot] com
0 notes
Text
#DatosyMezcales: datos abiertos sobre feminicidios, elecciones y el sistema fiscal
Una edición más de #DatosyMezcales en Ciudad de México para festejar que este 2017 cumplimos 5 años :) Aprovechando que estamos de aniversario, en esta edición les contamos sobre los inicios de #DatosyMezcales y cómo desde sus antecedentes en 2013-2014 se ha expandido el #DataLove hasta cubrir 11 ciudades de México y América Latina (cada versión acompañada de su bebida espirituosa tradicional). Acá puedes ver la numeralia del 2016 y en próximos días para celebrar los 5 años de SocialTIC publicaremos la numeralia de ciudades, proyectos, entusiastas daterxs y litros de mezcal que ha reunido cada evento.
Estamos arrancando #DatosyMezcales y compartiendo cómo inició todo el #DataLove 💙 pic.twitter.com/uAJqa9iaI4
— SocialTIC (@socialtic)
5 de mayo de 2017
Como cada encuentro, en este post te compartimos las iniciativas alrededor de los datos que se presentaron:
1. Mapa y datos de feminicidios en México. María Salguero, @PrincesaBathory en Twitter nos habló sobre cómo creó y actualiza el mapa interactivo sobre feminicidios en México a partir de historias, notas y fuentes periodísticas desde enero 2016. En la página web Los feminicidios en México, está el primer mapa que creó y que ahora ha trasladado a Google Maps para actualizar y agregar categorías de información. Para seguir actualizándose, el mapa y la mapeadora necesitan equipo y recursos, aquí puedes apoyar.
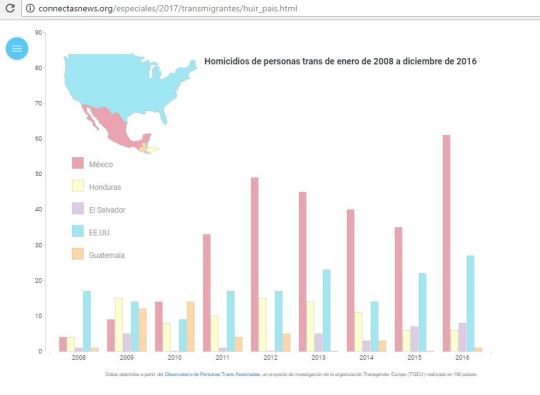
2. Reportaje basado en datos: crímenes de personas de diversidad sexual en América Latina Prometeo Lucero (@PrometeoLucero en Twitter), presentó la investigación que ha contabilizado los crímenes de 157 personas trans en América Latina desde enero de 2008 a diciembre de 2016, El Observatorio de Personas Trans Asesinadas ha reportado crímenes en Honduras, Guatemala y El Salvador. Este proyecto surge al reconocer que no había existido monitoreo sistemático de violencia de odio ni informes sobre asesinatos hacia personas trans. Aquí puedes ver el reportaje Transmigrantes basado en datos de la investigación.
3. Datos del sistema fiscal, una herramienta para proyectar cambios y propuestas. El simulador fiscal presentado por el CIEP ( Centro de Investigación Económica y Presupuestaria) es una herramienta que permite calcular la situación actual del sistema fiscal y proyectar propuestas y efectos en las finanzas del país. La herramienta contiene visualizaciones y simulaciones para proyectar cambios en campos como salud, educación y el sistema fiscal mexicano. Checa en este video cómo funciona el simulador fiscal:
youtube
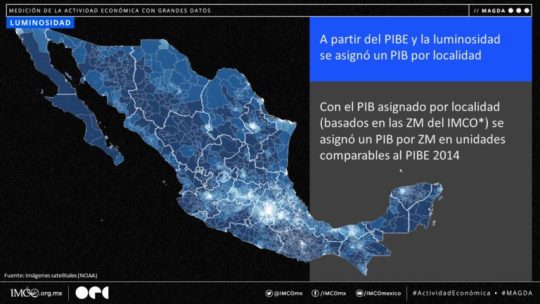
4. Tecnología y datos abiertos para medir la actividad económica de las ciudades en México Las organizaciones IMCO y OPI han desarrollado la plataforma MAGDA para la Medición de la Actividad Económica con Grandes Datos. MAGDA es creada a partir de la relación de la actividad económica con la emisión de luz (imágenes satelitales) y número de transacciones de retiro de efectivo en cajeros automáticos. En imco.org.mx puedes consultar: - bases de datos - código y documentación - boletín y ficha técnica
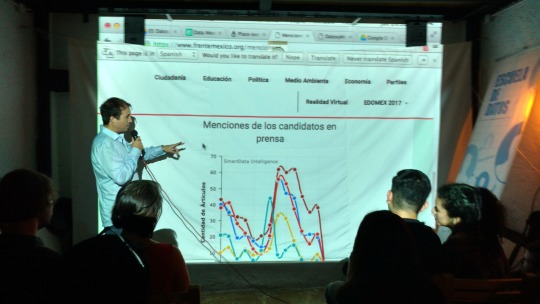
5. Datos sobre candidatxs y menciones para las elecciones 2017 del Estado de México El movimiento ciudadano Frente México presenta este análisis de datos en tiempo real sobre las menciones de los candidatos del Estado de México (en redes sociales: Facebook, Twitter y en medios digitales) para detectar el volumen de interacción y comparar qué temas son más mencioanados por lxs candidatxs.
Los temas de #Seguridad y #Corrupción son los más mencionados en redes para las elecciones de #Edomex2017 #DatosyMezcales pic.twitter.com/4afA7XxRrG
— Ale Navarro (@NAsteroide)
5 de mayo de 2017
6. Prototipado para organizaciones con proyectos tecnológicos ¿Eres una organización de la sociedad civil o gobierno trabajando en un proyecto para fortalecer a la ciudadanía? ¿Tienes la idea de usar tecnología para tu proyecto? El equipo de Cívica Digital te ofrece apoyo para crear un prototipo de alto nivel para que puedas presentar tu ideas, evaluar su impacto y cumplimiento de objetivos. Conoce aquí más información.
Sigue la pista del #DataLove, nos vemos en próximas noches de comunidad datera :)
#DatosAbiertos#DatosyMezcales#OpenDAta#TecnologíaCívica#HackingCívico#Dataviz#Mapas#Análisisdedatos#BigData#SmallData#DataLove#CDMX#México#EscueladeDatos
0 notes
Note
Will you be doing a data cronch post season 8?

Oh, why not. Wouldn’t want to disappoint all you datalovers out there.
27 notes
·
View notes
Link
3 notes
·
View notes