#Heatmap
Explore tagged Tumblr posts
Visit Tumblr Blog
Explore Tumblr blogs with no restrictions, modern design and the best experience.
Last Seen Tumblr Blogs


Fun Fact
The “We are the 99%” Tumblr blog became the slogan for the Occupy Wall Street movement.
Text

do you realize??
80 notes
·
View notes
Text


#heat map#heatmap#heatmaps#manicure#nail blog#nails#mani#xxl nails#cute nails#nail pics#pretty nails#long nails#beauty#nail faves#@hollywiththegoodnails
70 notes
·
View notes
Text


The floor plan and sections for my midterm presentation. Again I chose to work with some kind of heat map to show the different heights of the frames.
2 notes
·
View notes
Text
Real-Time Insights with WebTrack 360: Transforming Your Website Strategy
In today’s fast-paced digital landscape, gaining insights into user behavior is essential for optimizing your website and achieving business success. WebTrack 360 offers real-time analytics tools that empower you to enhance your website strategy, improve user experience, and boost conversion rates. In this blog, we’ll explore the key features and advantages of WebTrack 360, along with actionable tips for analyzing user behavior.
Why Real-Time Insights Matter
1. Identify User Behavior Patterns
Understanding how visitors navigate your website is crucial. With WebTrack 360, you can uncover valuable insights such as:
Visitor Demographics: Learn who visits your website, their interests, and geographical locations.
Behavioral Patterns: Identify common paths users take through your site and discover what content resonates with them.
2. Optimize User Experience (UX)
A seamless user experience is vital for retaining visitors and encouraging conversions. WebTrack 360 provides tools like:
Heatmaps: Visualize where users click, scroll, and move on your pages. Leverage this information to:
Identify High-Engagement Zones: Focus on the areas that capture the most attention.
Optimize Content Placement: Ensure critical information and call-to-action buttons are strategically positioned.
3. Enhance Conversion Rates
Conversions drive business growth. WebTrack 360 helps you achieve higher conversion rates by:
Leveraging User Feedback: Gather insights from user interactions and feedback to fine-tune your conversion paths.
Behavior Analytics: Understand which elements lead to successful conversions and replicate those strategies.
Key Features of WebTrack 360
Heatmaps: Visualize User Interactions
Heatmaps provide a bird’s-eye view of how users engage with your website. Here’s how they can benefit you:
Click Heatmaps: Highlight where users click the most, revealing popular links and buttons.
Scroll Heatmaps: Understand how far users scroll down your pages, helping you optimize content placement.
Move Heatmaps: Identify areas where users move their cursor, indicating interest or confusion.
Session Recordings: Dive Deeper
Session recordings allow you to watch user interactions in real time. Use them to:
Spot Pain Points: Identify where users encounter difficulties or drop off.
Analyze Navigation Paths: Understand the flow of user sessions and improve navigation.
Conclusion
WebTrack 360 empowers you with real-time insights, actionable data, and the tools needed to enhance your website’s performance. Start leveraging these features today to create a seamless user experience and drive conversions.
2 notes
·
View notes
Text


5 notes
·
View notes
Text
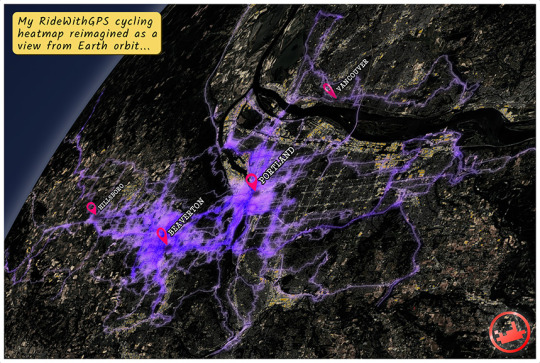
My RideWithGPS cycling heatmap reimagined as a view from Earth orbit...
0 notes
Text
💡 Bitcoin: Stärke an der Oberfläche – Schwäche im Kern?
In nur 60 Sekunden bringen wir es auf den Punkt: 🔸 Divergenz zwischen Preis & Orderflow 🔸 Was die Heatmaps wirklich sagen 🔸 Warum das MACD-Signal (noch) nicht reicht
📉 Die Mehrheit sieht „Bullish“. Wir sehen: Verteilung statt Akkumulation.
Wer nur auf den Kurs schaut, verpasst, was den Kurs bewegt.
#Bitcoin#BTC#Kryptoanalyse#Orderflow#Heatmap#MACD#SmartMoney#TradingInsights#Finanzmärkte#Kryptomarkt#ShortFormContent#ChartWise
0 notes


Text
This is so beautiful. And makes me giggle.

(via @slop.guru on Bluesky)
18K notes
·
View notes
Text
Video: Where to invest around the World
A #heatmap shows the net cumulative total #returns of major #global equity #indices, across three regions: #Americas, #Europe, and #APAC (Asia-Pacific), for up to 10 years of returns. We can see strong areas, such as #US tech (#Nasdaq100) and #SP500 and #Taiwan, which may be becoming overpriced, while also pointing to weaker spots like #Emerging #European #markets, #Spain, #Singapore, #Malaysia…

View On WordPress
#Americas#APAC#China#emerging#Europe#European#global#heatmap#indices#Malaysia#markets#Nasdaq100#opportunity#outperforming#recent#results#returns#Singapore#SP500#Spain#Taiwan#tech#US
0 notes
Text
How to Build a Heatmap in React – A Step-by-Step Guide
Want to create a heatmap in React? Follow this easy tutorial to implement data visualization with real-world examples and best practices.
0 notes
Text
Smart Metrics for Smart TVs: Belgium's New Video Measurement Reality - CIM ToVA Embraces the Connected Future (Havas Belgium Heatmap)
The Centre d’Information sur les Médias (CIM) has announced an important update to their Total Video Audience (ToVA) measurement system. This update incorporates Connected TV (CTV) into the measurement ecosystem, addressing a notable gap in cross-platform video audience measurement in Belgium. 1740756236506Télécharger Connected TV Integration The ToVA upgrade now includes CTV data from all…

View On WordPress
0 notes
Text
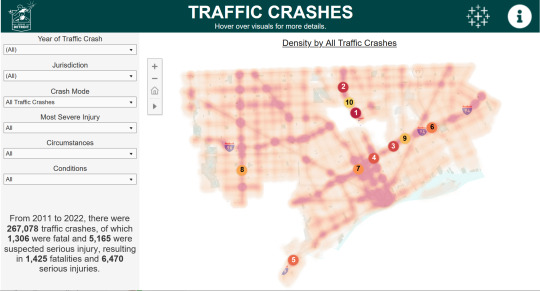
Map: City of Detroit Traffic Crashes
by: Steven Wiltse, Martin Denicolo, Zachary Manning, Kevin Zhang, Tess Parr – City of Detroit The City of Detroit has launched its Open Data Portal Analytics initiative in order to increase public access and understanding to valuable data and information that is posted on the Open Data Portal as raw datasets.To that end, the Traffic Crashes dashboard was built to visualize 267,078 traffic…
View On WordPress
#2011#2022#analytics#ArcGIS#City of Detroit#crash#data#Detroit#heatmap#Kevin Zhang#map#Martin Denicolo#open data#Steven Wiltse#Tess Parr#Zachary Manning
1 note
·
View note