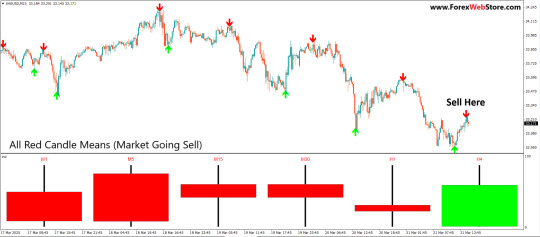
#Overbought/Oversold
Explore tagged Tumblr posts
Visit Tumblr Blog
Explore Tumblr blogs with no restrictions, modern design and the best experience.
Last Seen Tumblr Blogs


Fun Fact
Tumblr posted its first advertisements in May 2012 and subsequently earned $13M in revenue.
Text
"Mastering the Stochastic RSI Indicator: A Powerful Tool for Momentum and Trend Analysis"
The Stochastic RSI (StochRSI) is a momentum oscillator combining the Relative Strength Index (RSI) and the Stochastic Oscillator. It measures RSI's position relative to its range over time, helping identify overbought/oversold conditions and potential market reversals.
0 notes
Text
Mean Reversion: Forex Trading Strategy Explained
Mean reversion is a forex trading strategy that capitalizes on the tendency of asset prices to return to their historical averages. This approach assumes that extreme price movements will revert to the mean over time, providing traders with potential profit opportunities. What is Mean Reversion? It is based on the statistical concept that prices, after deviating significantly from their average,…
#Bollinger Bands#Forex Trading#Historical Average#MACD#Mean Reversion#Overbought Conditions#Oversold Conditions#Risk Management#RSI#Trading Strategy
2 notes
·
View notes
Link
Mastering MACD Analysis Using TA-Lib
The article provides a comprehensive guide to performing MACD (Moving Average Convergence Divergence) analysis using the TA-Lib library. By explaining the default MACD formula and its components, it demonstrates how to calculate the MACD Line, Signal Line, and Histogram using stock data. The guide also shows how to customize moving average periods for different analyses, allowing traders to adapt to varying market conditions.
Moreover, the article delves into practical MACD analysis techniques. It explains how to identify trend-following opportunities by detecting Golden Cross (uptrend) and Dead Cross (downtrend) points. The text also illustrates how to analyze market trends using the size of the Histogram, offering insights into strong trends and weakening trends. The article covers overbought and oversold conditions by showcasing divergence calculation and zero line crossing strategies. Overall, this guide equips traders with the knowledge and tools to make informed investment decisions using MACD analysis.
#MACD analysis#Trend following#Golden Cross#Dead Cross#Histogram analysis#Overbought#Oversold#Divergence#Zero Line Crossing
3 notes
·
View notes
Text
0 notes
Text
The Joker In The Deck
Stocks formed a swing low on Monday. Stocks printed its lowest point on day 47, placing them late in their timing band for a DCL to form. Monday’s swing low closed back above the 10 day MA to signal the new daily cycle. Stocks are currently in a daily uptrend. Stocks will remain in their daily uptrend unless they close back below the lower daily cycle band — however RSI 05 is signaling a…

View On WordPress
0 notes
Text
Capitalizing on Oversold Stocks: The Art of Buying Low and Selling High
Every seasoned trader knows the timeless principle: buy low, sell high. While the concept seems straightforward, the real challenge lies in knowing when to act. An oversold stock can signal a golden opportunity—if you’re able to identify it at the right moment. But how can you tell when a stock is truly oversold and ready for a rebound?
While fundamental analysis involves examining company earnings, balance sheets, and valuations, technical analysis takes a different route—one that focuses on price action. Rather than digging through financial reports or tracking executive decisions, technical analysts rely on charts to tell the story. The belief is simple: price reflects all known information, and studying price behavior is enough to make informed trading decisions.
One of the most widely used tools in this approach is the Relative Strength Index (RSI)—a trusted indicator that helps traders spot potential reversals in oversold or overbought conditions.
Why the Buy Low, Sell High Strategy Works
The idea of buying a stock after it has declined—anticipating a bounce back—is grounded in both logic and psychology. It works when you can identify short-term undervaluation, where prices have dropped not because of fundamental weakness, but due to temporary selling pressure, market sentiment, or external events. For fundamental traders, this might mean identifying a stock trading below its book value. But for technical traders, price is the only signal that matters.
RSI: The Technical Analyst’s Go-To Indicator
This is where the RSI comes into play. The Relative Strength Index is a momentum oscillator that measures the speed and magnitude of recent price movements. It operates on a scale from 0 to 100 and helps identify whether a stock is overbought or oversold.
When the RSI crosses above 70, the stock is considered overbought. This could signal that a pullback or consolidation is near.
When the RSI drops below 30, the stock is viewed as oversold—often a cue for traders to prepare for a potential upward move.
By using RSI, traders can pinpoint key moments when sentiment has driven a stock too far in one direction and position themselves to capitalize on the reversal.
Find Full Blog: Buy Low – Sell High: Opportunities in Oversold Stocks
2 notes
·
View notes
Text
Types of Technical Indicators in Trading
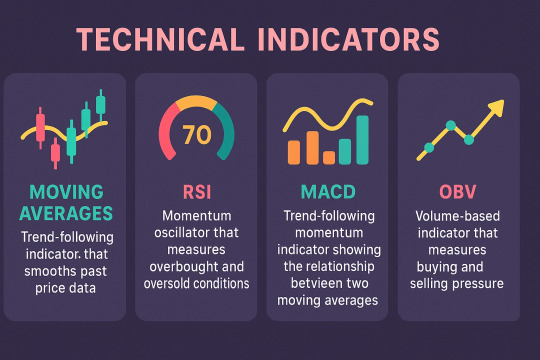
Technical indicators are essential tools used by traders to analyze market trends and make informed decisions. Among the many available, some of the most widely used types include Moving Averages, Relative Strength Index (RSI), MACD, and On-Balance Volume (OBV).
Moving Averages smooth out price data to identify trend direction over a specific period. Common types include the Simple Moving Average (SMA) and Exponential Moving Average (EMA), which help traders determine support and resistance levels and potential entry or exit points.
The Relative Strength Index (RSI) is a momentum oscillator that measures the speed and change of price movements. RSI values range from 0 to 100 and are typically used to identify overbought (above 70) or oversold (below 30) conditions, signaling potential reversals.
MACD (Moving Average Convergence Divergence) is a trend-following momentum indicator that shows the relationship between two EMAs. It helps traders identify changes in trend strength, direction, and momentum.
On-Balance Volume (OBV) uses volume flow to predict price movements. A rising OBV indicates accumulation, while a falling OBV suggests distribution, providing insights into the strength of a trend.
Using these indicators together can improve trading accuracy and help develop a solid, data-driven strategy.
Explore, all the Technical Indicators in Trading.
#Types of Technical Indicators in Trading#Technical Indicators in Trading#Indicators in Trading#trading indicators#indicators in trading
2 notes
·
View notes
Text
A long-dormant Polygon whale just made waves by snapping up a rising new token, XYZVerse, fueling speculation that this sports-fueled crypto could be the next breakout to watch.
Table of Contents
XYZ aims for G.O.A.T. status: Early buyers eye 1,000x gains
Polygon fluctuates
Conclusion
After five years of silence, a major holder of Polygon tokens has resurfaced. This investor is now acquiring a new cryptocurrency linked to POL. The unexpected move has caught the attention of market watchers. The new token is showing signs of significant growth potential. Could this be a signal of shifting trends in the market?
XYZ aims for G.O.A.T. status: Early buyers eye 1,000x gains
XYZVerse (XYZ) isn’t your average memecoin, it’s fusing the high-octane world of sports with crypto’s fast-moving edge. Built for die-hard fans of football, basketball, MMA, and esports, XYZVerse is more than just a token, it’s a competitive movement powered by adrenaline and community.
With its bold “Greatest of All Time” (G.O.A.T.) vision, XYZVerse is setting its sights far beyond typical memecoin hype. It’s already turning heads, recently crowned as the Best New Meme Project on the scene.
What gives XYZ the edge? Backed by a detailed roadmap and a fired-up community, the project is geared toward lasting impact and serious growth.

The XYZ presale is heating up fast, offering early investors tokens at a steep discount:
Launch price: $0.0001
Current price: $0.003333
Next presale stage: $0.005
Final presale price: $0.02
Target listing price: $0.10
With over $13 million already raised, momentum is building rapidly. The project’s ambitious target is a 1,000x return for those who locked in early. As demand soars, each presale stage brings higher prices, so those who act soon stand to gain the most.
XYZ is already making waves before hitting major exchanges. With listings on top CEXs and DEXs on the horizon, the opportunity window is closing fast.
You might also like:How a $500 stake in XYZVerse might transform over time
Polygon fluctuates
POL (ex-MATIC POL) has experienced notable price fluctuations recently. Over the past week, the coin saw a slight decline of 3.21%, settling within the current price range of $0.22 to $0.24. However, zooming out to the monthly view, POL has demonstrated a significant rebound with a 21.93% increase. Despite this short-term growth, the coin remains down by 23.38% over the past six months, reflecting broader market volatility.
Technical indicators point to key levels that could influence POL’s trajectory. The nearest resistance level is at $0.26, with a secondary resistance at $0.28. If the price pushes beyond these thresholds, it might signal a bullish trend. On the support side, levels at $0.21 and $0.19 could provide a safety net against further declines.
The 10-day simple moving average is $0.23, slightly below the 100-day average of $0.24, suggesting a cautious short-term outlook. The Relative Strength Index (RSI) stands at 53.70, indicating that the coin is neither overbought nor oversold. Meanwhile, a high Stochastic value of 91.17 might hint at potential overbought conditions.
Market observers note that while the recent monthly gain is promising, the mixed signals from technical indicators warrant careful attention. POL’s ability to break through resistance levels or hold above support zones could set the tone for its near-term performance. As the crypto market continues to evolve, staying informed on these key metrics remains crucial for those watching POL’s journey.
Conclusion
While established coins like POL show promise, XYZVerse stands out, uniting sports fans in a community-driven ecosystem aiming for substantial growth and cultural impact.
To find more information about XYZVerse, visit the official website.
2 notes
·
View notes
Text
"RSI Streak Indicator: Enhancing Trend Strength & Momentum Analysis with Relative Strength Index"
The RSI Streak Indicator tracks consecutive periods of RSI closing above or below a certain threshold, revealing trends and overbought/oversold conditions. It highlights momentum by counting bullish or bearish streaks, aiding in trend strength and reversal signals.
0 notes
Text
10 Forex Strategies for Scalping
Scalping is a popular trading strategy in the forex market, characterized by short-term trades aimed at capturing small price movements. This strategy requires quick decision-making, discipline, and a keen understanding of the market. In this article, we’ll explore 10 effective forex strategies for scalping that can help traders maximize their profits while minimizing risk. 1. Moving Average…
#Bollinger Bands#Candlestick Patterns#CCI#Crossovers#Divergence#Entry and Exit Points#Fibonacci Retracement#Forex#Forex Market#Forex Strategies#MACD#MACD Line#Momentum Indicator#Moving Average#Moving Average Convergence Divergence#Overbought Conditions#Oversold Conditions#Parabolic SAR#Pivot Points#Price Action#Price Movements#Relative Strength#RSI#Scalping#Scalping Strategy#Security#Signal Line#Stochastic Oscillator#Stop-Loss#Support And Resistance
0 notes
Link
Understanding and Utilizing RSI in Stock Trading
The provided article delves deeply into the significance and utilization of the Relative Strength Index (RSI) in the realm of stock trading. RSI serves as a crucial indicator for assessing whether a stock's current price is in an overbought or oversold state. The article comprehensively explains how RSI functions, its components, formulas, interpretation strategies, and practical tips for effective application.
This article is a comprehensive guide for investors, offering insights into the RSI's mechanics and its practical value in evaluating market conditions. By clarifying the concept of overbought and oversold levels, the article empowers investors to make more informed decisions and implement better trading strategies. The explanations and application strategies provided assist traders in using RSI as a valuable tool for understanding market dynamics and anticipating potential trend reversals.
#RSI#stock market#technical indicator#trading strategies#overbought#oversold#market conditions#trend reversals#investor education#trading insights
0 notes
Text
Mastering forex signals for trend following: a comprehensive guide
The foreign exchange market, or Forex, is a dynamic and ever-changing arena where traders seek to capitalize on currency price movements. One popular trading strategy is trend following, which involves identifying and following the prevailing market direction. Forex signals play a crucial role in assisting traders to navigate the complexities of trend following. In this comprehensive guide, we will explore the intricacies of Forex signals for trend following, helping you understand how to leverage them effectively for successful trading.
Understanding Trend Following
Trend following is a strategy that seeks to capitalize on the directionality of market prices. The basic premise is simple: identify the prevailing trend and place trades in the same direction. Trends can be upward (bullish), downward (bearish), or sideways (range-bound). Successful trend following involves entering a trade at the beginning of a trend and exiting when the trend shows signs of reversal.
The Role of Forex Signals
Forex signals serve as triggers for traders, indicating opportune moments to enter or exit a trade. These signals are generated through a thorough analysis of market data, including technical indicators, fundamental factors, and sometimes a combination of both. For trend following, signals become particularly crucial as they guide traders on when to jump on a trend and when to step aside.
Key Components of Forex Signals for Trend Following
1. Technical Indicators:
Moving Averages: These are fundamental tools in trend following. A moving average smoothens price data to create a single flowing line. Traders often look for crossovers, where short-term moving averages cross above long-term ones, as a signal to enter a trade.
Relative Strength Index (RSI): RSI measures the speed and change of price movements. A high RSI may indicate overbought conditions, suggesting a potential reversal, while a low RSI may indicate oversold conditions, signaling a potential buying opportunity.
Moving Average Convergence Divergence (MACD): MACD is a trend-following momentum indicator that shows the relationship between two moving averages of a security’s price.
2. Fundamental Analysis:
While trend following is predominantly a technical strategy, incorporating fundamental analysis can enhance the accuracy of signals. Economic indicators, interest rates, and geopolitical events can significantly impact currency trends.
3. Price Action:
Pure price action analysis involves studying the historical price movements of a currency pair. Identifying patterns, such as higher highs and higher lows in an uptrend, can provide strong signals for trend following.
Choosing a Reliable Signal Provider
With the plethora of signal providers available, it's essential to choose a reliable one. Consider the following factors:
Track Record: A provider's historical performance is a crucial indicator of their reliability. Look for providers with a consistent track record of accurate signals.
Transparency: Transparent signal providers disclose their methods, including the criteria for generating signals and their risk management strategies.
Risk-Reward Ratio: A good signal provider should have a clear risk-reward ratio for each signal, helping you manage your trades effectively.
Implementing Forex Signals for Trend Following
Once you've selected a signal provider or developed a reliable system, the implementation phase is critical. Here are some tips:
Risk Management: Set clear risk parameters for each trade. This includes defining the percentage of your trading capital you're willing to risk on a single trade.
Position Sizing: Adjust the size of your positions based on the strength of the signal and the volatility of the market.
Stay Informed: While signals provide valuable insights, staying informed about broader market trends and events is crucial. Unexpected news can impact the Forex market.
Continuous Evaluation: Regularly assess the performance of your chosen signals and be prepared to adjust your strategy if market conditions change.
Conclusion
Forex signals for trend following can be powerful tools in a trader's arsenal, helping to identify and capitalize on market trends. However, success in Forex trading requires a comprehensive understanding of both the strategy and the market itself. By combining technical indicators, fundamental analysis, and a disciplined approach to risk management, traders can use Forex signals to navigate the complex world of trend following with confidence. Remember, no strategy guarantees success, and ongoing learning and adaptation are essential for long-term success in the Forex market.
Source:
#TradeSignals#FinancialFreedom#StockMarketAlerts#InvestingWisdom#ProfitableTrades#MarketAnalysis#TradingSignals#DayTrading#ForexProfit#CryptoSignals#MarketTrends#InvestmentTips#SmartTrading#TradeSmart#TechnicalAnalysis#RiskManagement#ProfitPotential#TradingStrategies#StockPicks#EconomicIndicators#TradingEducation#MarketInsights#OptionsTrading#MarketWatch#TradeStrategy#FinancialMarkets#ForexTrading#CryptoInvesting#AlgorithmicTrading#StockMarketNews
28 notes
·
View notes
Text
What tools or indicators can be used with Forex charts?
Here's a comprehensive and detailed breakdown of tools and indicators used in Forex trading, structured to span around 3,500 words. This document includes technical analysis tools, charting platforms, indicators (leading and lagging), and practical strategies for application.

Tools and Indicators Used with Forex Charts
Introduction
The foreign exchange (Forex) market is the largest and most liquid financial market globally, with trillions of dollars traded daily. To navigate this vast marketplace effectively, traders utilize a variety of tools and indicators to analyze price movements, identify trends, and execute strategic trades.
Understanding these tools and indicators is essential for any Forex trader—whether novice or experienced—as they form the foundation of technical analysis, one of the most widely used approaches in the financial markets.
This article explores the essential tools and indicators used in Forex charting, categorized into several groups for clarity and practical application.
1. Charting Platforms and Tools
1.1. Charting Software
To analyze Forex charts, traders need reliable charting platforms that provide real-time data, customizable indicators, and drawing tools.
Popular charting platforms:
MetaTrader 4 (MT4) and MetaTrader 5 (MT5): Industry standards offering robust technical analysis tools.
TradingView: A web-based platform with advanced charting features and social integration.
cTrader: Offers intuitive UI, depth of market (DOM) functionality, and automation options.
NinjaTrader: Used by more advanced traders for both Forex and futures markets.
1.2. Chart Types
Understanding different chart types helps traders select the most appropriate visualization method.
Line Chart: Plots closing prices; useful for identifying trends.
Bar Chart (OHLC): Shows open, high, low, and close prices; more data-rich.
Candlestick Chart: Most popular; visually intuitive and informative, ideal for pattern recognition.
Renko Charts: Focus on price movement, ignoring time.
Heiken Ashi: Smooths price action to better identify trends.
2. Categories of Forex Indicators
Forex indicators are generally categorized based on their function and timing:
Trend-following indicators (lagging)
Momentum indicators (leading)
Volatility indicators
Volume indicators
Support and resistance tools
Overlay indicators vs. oscillator indicators
3. Trend-Following (Lagging) Indicators
These indicators help identify the direction of the market trend.
3.1. Moving Averages (MA)
Simple Moving Average (SMA) and Exponential Moving Average (EMA) are essential tools.
SMA calculates the average of a selected range of prices.
EMA gives more weight to recent prices.
Usage:
Determine trend direction.
Create signals with crossovers (e.g., 50 EMA crossing 200 EMA = Golden Cross/Death Cross).
3.2. Moving Average Convergence Divergence (MACD)
Composed of two EMAs (MACD line and signal line) and a histogram.
Usage:
Crossover strategy for buy/sell signals.
Divergence from price to signal potential reversals.
3.3. Average Directional Index (ADX)
Measures trend strength, not direction.
Usage:
ADX above 25 = strong trend.
ADX below 20 = weak trend or range-bound market.
3.4. Ichimoku Kinko Hyo
A comprehensive indicator showing trend, momentum, and support/resistance.
Components:
Tenkan-sen (conversion line)
Kijun-sen (base line)
Senkou Span A and B (cloud)
Chikou Span (lagging line)
Usage:
Cloud (Kumo) provides dynamic support and resistance.
Crossovers and breakouts from the cloud indicate signals.
4. Leading Indicators (Momentum)
Leading indicators aim to forecast future price movements.
4.1. Relative Strength Index (RSI)
An oscillator ranging from 0 to 100.
Usage:
RSI > 70 = overbought.
RSI < 30 = oversold.
Divergence with price indicates reversals.
4.2. Stochastic Oscillator
Compares a specific closing price to a range over time.
Usage:
%K and %D lines; crossovers suggest entries/exits.
Overbought/oversold levels are typically 80/20.
4.3. Commodity Channel Index (CCI)
Shows when a currency is overbought/oversold relative to its average price.
Usage:
Readings above +100 or below -100 suggest overbought/oversold conditions.
4.4. Rate of Change (ROC)
Measures the speed of price change.
Usage:
Increasing ROC suggests growing momentum.
Often used with trend indicators to confirm movement.
5. Volatility Indicators
These indicators measure how much price fluctuates.
5.1. Bollinger Bands
Consists of a SMA and two bands (±2 standard deviations).
Usage:
Price touching the upper band = potential overbought.
Price touching the lower band = potential oversold.
Bollinger Band squeeze indicates potential breakout.
5.2. Average True Range (ATR)
Shows average price volatility over a specific time.
Usage:
Not a directional indicator.
Useful for setting stop-loss and target levels.
5.3. Keltner Channels
Similar to Bollinger Bands but use ATR instead of standard deviation.
Usage:
Identify breakouts and trend continuations.
6. Volume-Based Indicators
Forex is decentralized, so volume is often broker-based. However, tick volume can still be useful.
6.1. On-Balance Volume (OBV)
Cumulative volume indicator.
Usage:
Confirms trends.
Divergence from price may signal reversal.
6.2. Volume Weighted Average Price (VWAP)
The average price weighted by volume.
Usage:
Commonly used for intraday analysis.
Helps institutions judge fair value zones.
7. Support and Resistance Tools
7.1. Pivot Points
Calculated from previous period’s high, low, and close.
Types:
Standard
Fibonacci
Woodie
Camarilla
Usage:
Identify potential support/resistance levels.
Useful for intraday and swing trading.
7.2. Fibonacci Retracement
Identifies potential pullback levels.
Common levels: 23.6%, 38.2%, 50%, 61.8%, 78.6%
Usage:
Entry during retracements in trending markets.
Combine with trendlines for confirmation.
7.3. Trendlines and Channels
Drawn manually to connect swing highs/lows.
Usage:
Visualize trend direction and strength.
Breakouts signal potential reversals or continuations.
8. Custom Indicators and Tools
Many platforms allow traders to create or install custom indicators.
Examples:
Harmonic pattern indicators (Gartley, Bat, Crab)
Custom divergence indicators
Multi-timeframe RSI or MACD
Sentiment indicators
9. Chart Patterns and Price Action Tools
While not strictly indicators, chart patterns play a crucial role in technical analysis.
9.1. Classic Chart Patterns
Head and Shoulders
Double Top/Bottom
Triangles (Ascending, Descending, Symmetrical)
Flags and Pennants
Rectangles
Usage:
Reversal and continuation signals.
9.2. Candlestick Patterns
Doji
Hammer
Engulfing
Morning Star/Evening Star
Shooting Star
Usage:
Signal potential turning points.
Combine with support/resistance or trend indicators.
9.3. Price Action Tools
Swing Highs/Lows
Order Blocks
Break of Structure (BoS)
Liquidity Zones
Usage:
Used for precision entries and institutional trading style (Smart Money Concepts - SMC).
10. Combining Indicators for Strategy Building
10.1. The Problem of Indicator Overload
Using too many indicators can lead to conflicting signals and analysis paralysis.
Best Practice:
Combine indicators with different functions.
Example setup:
Trend: 200 EMA
Momentum: RSI
Volatility: Bollinger Bands
10.2. Confluence Trading
Confluence occurs when multiple indicators or tools point to the same conclusion.
Example:
Price hits a Fibonacci level + RSI is oversold + bullish engulfing candlestick.
This increases the probability of success.
11. Trading Strategy Examples
11.1. Moving Average Crossover Strategy
Indicators:
50 EMA and 200 EMA Entry:
Buy when 50 EMA crosses above 200 EMA. Exit:
Opposite crossover or stop-loss under support.
11.2. RSI Divergence Strategy
Indicators:
RSI Entry:
Look for bullish/bearish divergence. Exit:
Take profit at key support/resistance.
11.3. Bollinger Band Breakout
Indicators:
Bollinger Bands Entry:
Enter when price breaks out of a tight band range. Exit:
Use ATR or fixed pip target.
11.4. Ichimoku Cloud Trend Strategy
Indicators:
Ichimoku Kinko Hyo Entry:
Buy when price is above the cloud and Tenkan-sen crosses Kijun-sen upward. Exit:
Close when price enters the cloud or crossover occurs downward.
12. Risk Management Tools on Charts
Besides entry and exit signals, charts also support tools for risk management:
Stop-loss placement using ATR
Take-profit based on recent swing highs/lows
Position size calculator indicators
Trade simulators and replay tools
13. Psychological and Sentiment Indicators
Though not always on the chart, these tools influence market moves.
Commitment of Traders (COT) Report
Retail Sentiment Indicators (from brokers like IG or OANDA)
News sentiment tools
Economic calendars embedded in platforms
Conclusion
Forex charting is both an art and a science. With the right tools and indicators, traders can gain deep insights into market movements, enhance precision, and improve risk-to-reward ratios. However, no single tool guarantees success.
The key is to develop a strategy that suits your trading style—whether scalping, day trading, or swing trading—and consistently use a combination of indicators that complement each other rather than duplicate signals.
To summarize:
Use trend indicators to determine direction.
Use momentum indicators for timing entries.
Use volatility indicators to understand price fluctuations.
Use support/resistance tools to define high-probability zones.
Combine tools intelligently to build robust strategies.
Would you like this content formatted as a downloadable PDF or with visual examples for each indicator?
#forex robot#forex trend indicator#forexsignals#stock market#currency forex online trading#youtube#forextrader#forex market#forextrading#forex
1 note
·
View note
Text
RSI: Your Secret Weapon for Better Trading Decisions
You know that feeling when you're always catching the market at the wrong time? Yeah, me too. That's until I discovered the Relative Strength Index (RSI), and boy, what a game-changer it's been! Let me share some real talk about this awesome tool.
First off, RSI is like having a market GPS - it helps you figure out if you're headed for overbought territory (above 70) or oversold land (below 30). But here's the kicker - it's not as simple as "buy low, sell high."
When I first started, I made the rookie mistake of treating RSI like a magic 8-ball. Every time it hit those magic numbers, I'd jump in without thinking twice. Let's just say my trading account wasn't too happy about that strategy!
Here's what actually works:
Watch for RSI trends, not just numbers
Pay attention when RSI and price are telling different stories
Use multiple timeframes to confirm your analysis
Don't forget about the overall market trend
Want to learn more? Check out my detailed guide on Relative Strength Index (RSI) for the full scoop!
#RSI indicator#trading analysis#market indicators#trading psychology#momentum trading#technical trading#RSI strategy#trading basics#market analysis#beginner trading
2 notes
·
View notes
Text
Chart Chaser: A Trader’s Obsession with Technical Analysis on MintCFD

In the realm of online trading, a “Chart Chaser” is a trader who relies heavily on technical analysis. These traders obsessively study charts, patterns, and indicators to identify the optimal entry and exit points for their trades. While some traders focus on market news or economic fundamentals, Chart Chasers believe that the key insights lie within the patterns and trends shown in the data itself. For users on MintCFD, adopting the Chart Chaser approach can be rewarding, especially given the wide range of tools and various trading chart patterns available on the platform.
The Allure of Following Trends in Charts
Chart Chasers are drawn to technical analysis because it offers a visual and data-driven way to understand market behavior. By studying price movements, volume, and indicators, they look for recurring patterns, such as Double Bottoms, Head and Shoulders, and Moving Averages, which they believe can predict future price action. With the MintCFD trading app, traders have access to advanced charting tools that make it easy to become a Chart Chaser, allowing for in-depth analysis and strategy development.
Key Tools on the MintCFD Platform for Chart Chasers
MintCFD’s platform is rich with tools tailored for those who take a technical approach. Here are some essentials for the dedicated Chart Chaser:
Real-Time Charting Tools: MintCFD offers detailed, real-time charts that provide instant insights into price movements. For a Chart Chaser, these charts are invaluable as they capture every shift and trend in the market, allowing them to act quickly based on the latest data.
Diverse Chart Patterns: From Candlestick charts to Line charts, MintCFD provides several options, enabling traders to switch between patterns based on their trading style. For instance, Candlestick patterns are often favored by Chart Chasers because they reveal price action in detail, helping traders identify trends and reversals.
Technical Indicators: Popular indicators, such as the RSI (Relative Strength Index), MACD (Moving Average Convergence Divergence), and Bollinger Bands, are available on MintCFD to help Chart Chasers confirm their hypotheses. These indicators can signal overbought or oversold conditions, momentum changes, and potential trend reversals.
Custom Alerts: MintCFD’s alert system lets Chart Chasers set notifications based on specific price movements, helping them act on technical signals even if they’re not actively monitoring their screens. This way, they never miss a crucial trade opportunity based on their analysis.
Benefits and Pitfalls of Being a Chart Chaser
For those who love data, becoming a Chart Chaser offers unique advantages, but it also comes with some potential pitfalls. Here’s how to manage both on the MintCFD Platform:
Benefits: Technical analysis is highly data-driven, meaning decisions are based on objective data rather than emotional responses. By relying on chart patterns and indicators, Chart Chasers can create highly structured strategies with specific entry and exit points. With MintCFD’s intuitive tools, they can continuously refine their methods and explore different indicators.
Pitfalls: Focusing solely on technical analysis can lead to “analysis paralysis,” where a trader over-analyzes and hesitates to act. Additionally, ignoring market news and economic factors may leave a Chart Chaser blind to important influences. MintCFD offers market news and insights alongside technical tools, helping Chart Chasers balance their analysis with a broader context.
Master the Market on MintCFD Trading App: Stop Over-Analyzing and Start Thriving as a Chart Chaser
To succeed as a Chart Chaser without getting caught in a loop of over-analysis, it’s essential to have a plan and set clear criteria for entering and exiting trades. MintCFD’s watchlists and alert systems can help keep track of multiple assets without overwhelming yourself with constant analysis. Having a set of ���go-to” indicators and patterns also helps prevent information overload.
Final Thoughts
For traders who thrive on technical data, becoming a Chart Chaser can be an exciting and rewarding journey. MintCFD is an ideal platform for these traders, with its robust charting tools, real-time indicators, and customizable alerts. While it’s easy to get caught up in the details, the best Chart Chasers know when to step back and trust their analysis. By balancing data with a disciplined approach, MintCFD users can make the most of their technical strategies and succeed in the dynamic world of trading.
Take control of your trading journey with the MintCFD Trading App
#mintcfd#cfdtrading#cryptotrading#onlinetrading#tradingstrategy#tradingsignals#forextrading#forexstrategies#cryptoinvesting#stockmarket
2 notes
·
View notes
Text
SEO-friendly : 7 Key Insights into the Meaning of Relative Strength Index in Forex Trading
The meaning of relative strength index is a crucial tool for Forex traders, helping identify overbought and oversold conditions for better decision-making. The meaning of relative strength index, often called RSI, is essential in Forex trading. It helps traders understand whether a currency pair is overbought or oversold. This insight allows for better decision-making when buying or selling…
0 notes