#Power BI data source parameters
Explore tagged Tumblr posts
Visit Tumblr Blog
Explore Tumblr blogs with no restrictions, modern design and the best experience.
Last Seen Tumblr Blogs


Fun Fact
Celebrities use Tumblr as well.
Text
Streamlining Power BI Report Deployment for Multiple Customers with Dynamic Data Sources.
Navigating the maze of business intelligence, especially when it comes to crafting and rolling out Power BI reports for a diverse client base, each with their unique data storage systems, is no small feat. The trick lies in concocting a reporting solution that’s as flexible as it is robust, capable of connecting to a variety of data sources without the need for constant tweaks. This isn’t just…
View On WordPress
#automated Power BI deployment#multi-customer Power BI reports#Power BI data source parameters#Power BI dynamic data sources#T-SQL in Power Query
0 notes
Text
Cross-Mapping Tableau Prep Workflows into Power Query: A Developer’s Blueprint
When migrating from Tableau to Power BI, one of the most technically nuanced challenges is translating Tableau Prep workflows into Power Query in Power BI. Both tools are built for data shaping and preparation, but they differ significantly in structure, functionality, and logic execution. For developers and BI engineers, mastering this cross-mapping process is essential to preserve the integrity of ETL pipelines during the migration. This blog offers a developer-centric blueprint to help you navigate this transition with clarity and precision.
Understanding the Core Differences
At a foundational level, Tableau Prep focuses on a flow-based, visual paradigm where data steps are connected in a linear or branching path. Power Query, meanwhile, operates in a functional, stepwise M code environment. While both support similar operations—joins, filters, aggregations, data type conversions—the implementation logic varies.
In Tableau Prep:
Actions are visual and sequential (Clean, Join, Output).
Operations are visually displayed in a flow pane.
Users rely heavily on drag-and-drop transformations.
In Power Query:
Transformations are recorded as a series of applied steps using the M language.
Logic is encapsulated within functional scripts.
The interface supports formula-based flexibility.
Step-by-Step Mapping Blueprint
Here’s how developers can strategically cross-map common Tableau Prep components into Power Query steps:
1. Data Input Sources
Tableau Prep: Uses connectors or extracts to pull from databases, Excel, or flat files.
Power Query Equivalent: Use “Get Data�� with the appropriate connector (SQL Server, Excel, Web, etc.) and configure using the Navigator pane.
✅ Developer Tip: Ensure all parameters and credentials are migrated securely to avoid broken connections during refresh.
2. Cleaning and Shaping Data
Tableau Prep Actions: Rename fields, remove nulls, change types, etc.
Power Query Steps: Use commands like Table.RenameColumns, Table.SelectRows, and Table.TransformColumnTypes.
✅ Example: Tableau Prep’s “Change Data Type” ↪ Power Query:
mCopy
Edit
Table.TransformColumnTypes(Source,{{"Date", type date}})
3. Joins and Unions
Tableau Prep: Visual Join nodes with configurations (Inner, Left, Right).
Power Query: Use Table.Join or the Merge Queries feature.
✅ Equivalent Code Snippet:
mCopy
Edit
Table.NestedJoin(TableA, {"ID"}, TableB, {"ID"}, "NewColumn", JoinKind.Inner)
4. Calculated Fields / Derived Columns
Tableau Prep: Create Calculated Fields using simple functions or logic.
Power Query: Use “Add Column” > “Custom Column” and M code logic.
✅ Tableau Formula Example: IF [Sales] > 100 THEN "High" ELSE "Low" ↪ Power Query:
mCopy
Edit
if [Sales] > 100 then "High" else "Low"
5. Output to Destination
Tableau Prep: Output to .hyper, Tableau Server, or file.
Power BI: Load to Power BI Data Model or export via Power Query Editor to Excel or CSV.
✅ Developer Note: In Power BI, outputs are loaded to the model; no need for manual exports unless specified.
Best Practices for Developers
Modularize: Break complex Prep flows into multiple Power Query queries to enhance maintainability.
Comment Your Code: Use // to annotate M code for easier debugging and team collaboration.
Use Parameters: Replace hardcoded values with Power BI parameters to improve reusability.
Optimize for Performance: Apply filters early in Power Query to reduce data volume.
Final Thoughts
Migrating from Tableau Prep to Power Query isn’t just a copy-paste process—it requires thoughtful mapping and a clear understanding of both platforms’ paradigms. With this blueprint, developers can preserve logic, reduce data preparation errors, and ensure consistency across systems. Embrace this cross-mapping journey as an opportunity to streamline and modernize your BI workflows.
For more hands-on migration strategies, tools, and support, explore our insights at https://tableautopowerbimigration.com – powered by OfficeSolution.
0 notes
Text
Unlock the Power of Data: Start Your Power BI Training Journey Today!

Introduction: The Age of Data Mastery
The world runs on data — from e-commerce trends to real-time patient monitoring, logistics optimization to financial forecasting. But data without clarity is chaos. That’s why the demand for data-driven professionals is skyrocketing.
If you’re wondering where to begin, the answer lies in Power BI training — a toolset that empowers you to visualize, interpret, and tell stories with data. When paired with Azure Data Factory training and ADF Training, you’re not just a data user — you become a data engineer, storyteller, and business enabler.
Section 1: Power BI — Your Data Storytelling Toolkit
What is Power BI?
Power BI is a suite of business analytics tools by Microsoft that connects data from hundreds of sources, cleans and shapes it, and visualizes it into stunning reports and dashboards.
Key Features:
Data modeling and transformation (Power Query & DAX)
Drag-and-drop visual report building
Real-time dashboard updates
Integration with Excel, SQL, SharePoint, and cloud platforms
Easy sharing via Power BI Service and Power BI Mobile
Why you need Power BI training:
It’s beginner-friendly yet powerful enough for experts
You learn to analyze trends, uncover insights, and support decisions
Widely used by Fortune 500 companies and startups alike
Power BI course content usually includes:
Data import and transformation
Data relationships and modeling
DAX formulas
Visualizations and interactivity
Publishing and sharing dashboards
Section 2: Azure Data Factory & ADF Training — Automate Your Data Flows
While Power BI helps with analysis and reporting, tools like Azure Data Factory (ADF) are essential for preparing that data before analysis.
What is Azure Data Factory?
Azure Data Factory is a cloud-based ETL (Extract, Transform, Load) tool by Microsoft used to create data-driven workflows for moving and transforming data.
ADF Training helps you master:
Building pipelines to move data from databases, CRMs, APIs, and more
Scheduling automated data refreshes
Monitoring pipeline executions
Using triggers and parameters
Integrating with Azure services and on-prem data
Azure Data Factory training complements your Power BI course by
Giving you end-to-end data skills: from ingestion → transformation → reporting
Teaching you how to scale workflows using cloud resources
Prepping you for roles in Data Engineering and Cloud Analytics
Section 3: Real-Life Applications and Benefits
After completing Power BI training, Azure Data Factory training, and ADF training, you’ll be ready to tackle real-world business scenarios such as:
Business Intelligence Analyst
Track KPIs and performance in real-time dashboards
Help teams make faster, better decisions
Data Engineer
Build automated workflows to handle terabytes of data
Integrate enterprise data from multiple sources
Marketing Analyst
Visualize campaign performance and audience behavior
Use dashboards to influence creative and budgeting
Healthcare Data Analyst
Analyze patient data for improved diagnosis
Predict outbreaks or resource needs with live dashboards
Small Business Owner
Monitor sales, inventory, customer satisfaction — all in one view
Automate reports instead of doing them manually every week
Section 4: What Will You Achieve?
Tangible Career Growth
Access to high-demand roles: Data Analyst, Power BI Developer, Azure Data Engineer, Cloud Analyst
Average salaries range between $70,000 to $130,000 annually (varies by country)
Future-Proof Skills
Data skills are relevant in every sector: retail, finance, healthcare, manufacturing, and IT
Learn the Microsoft ecosystem, which dominates enterprise tools globally
Practical Confidence
Work on real projects, not just theory
Build a portfolio of dashboards, ADF pipelines, and data workflows
Certification Readiness
Prepares you for exams like Microsoft Certified: Power BI Data Analyst Associate (PL-300), Azure Data Engineer Associate (DP-203)
Conclusion: Data Skills That Drive You Forward
In an era where businesses are racing toward digital transformation, the ones who understand data will lead the way. Learning Power BI, Azure Data Factory, and undergoing ADF training gives you a complete, end-to-end data toolkit.
Whether you’re stepping into IT, upgrading your current role, or launching your own analytics venture, now is the time to act. These skills don’t just give you a job — they build your confidence, capability, and career clarity.
#Azure data engineer certification#Azure data engineer course#Azure data engineer training#Azure certification data engineer#Power bi training#Power bi course#Azure data factory training#ADF Training
0 notes
Text
How Logistics Companies Use of Power BI for Supply Chain Management
One of the most valuable resources in the fast paced, highly competitive logistics sector of today is data. As supply chains get more intricate, logistics firms are using business intelligence solutions like Microsoft Power BI more frequently to boost productivity, make better decisions, and increase operational visibility. Take advantage of our Power BI Certification Course Online to learn how to use Power BI to improve your company's supply chain management.

Why Power BI?
Microsoft Power BI is a potent business analytics and data visualization application that lets companies compile information from several sources, make dynamic dashboards, and produce reports in real time. For logistics firms looking to streamline their supply chain operations, its robust data modeling tools, integration capabilities, and user-friendly interface make it the perfect option.
Important Ways Power BI Helps with Supply Chain Management:
1. Operational Visibility in Real Time
Logistics firms can track key performance indicators (KPIs) including delivery schedules, stock levels, and transportation expenses in real time with Power BI. Decision makers can obtain the most recent information to take prompt, confident action by linking to real-time data sources, such as ERP systems, TMS (Transportation Management Systems), and WMS (Warehouse Management Systems).
2. Better Prediction of Demand
To prevent overstocking or understocking, which can both cause supply chain disruptions, accurate demand forecasting is crucial. By modeling past sales data, seasonal patterns, and outside variables, Power BI enables analysts to more precisely predict demand, assisting businesses in optimizing procurement plans and inventory levels.
3. Monitoring Supplier Performance
Monitoring vendor performance over time is essential to preserving solid supplier relationships. Logistics managers can use Power BI to build dashboards that monitor supplier cost variations, quality parameters, and delivery schedules. The choice of suppliers and contract talks can then be influenced by this data.

4. Fleet and Route Optimization
Logistics teams can examine driver performance, vehicle maintenance records, fuel use, and route efficiency with the aid of Power BI Certification in Bangalore. It enables businesses to find inefficiencies and optimize delivery routes for lower costs and quicker service when combined with GPS and IoT sensor data.
5. Risk Mitigation and Exception Management
Power BI helps businesses to identify irregularities and look into the underlying reasons of interruptions, such as delays, weather-related effects, or supplier problems. Managers may minimize downtime and financial loss by taking prompt corrective action thanks to custom alerts and exception reports.
Conclusion:
Power BI is becoming an essential tool for promoting supply chain excellence as logistics operations grow more data intensive. Power BI enables logistics organizations to make data-driven choices quickly and accurately, from managing supplier relationships to optimizing routes and measuring KPIs.
Power BI provides the adaptability and insights required to handle the intricate supply chain environment of today, whether you're in charge of a local delivery network or an international freight business.
#Power BI Course in Bangalore#Power BI Course Online#Supply Chain Management#Power BI Training#Learnovita
1 note
·
View note
Text
What You’ll Learn in a Data Analyst Course in Noida: A Complete Syllabus Breakdown

If you are thinking about starting a career in data analytics, you’re making a great decision. Companies today use data to make better decisions, improve services, and grow their businesses. That’s why the demand for data analysts is growing quickly. But to become a successful data analyst, you need the right training.
In this article, we will give you a complete breakdown of what you’ll learn in a Data Analyst Course in Noida, especially if you choose to study at Uncodemy, one of the top training institutes in India.
Let’s dive in and explore everything step-by-step.
Why Choose a Data Analyst Course in Noida?
Noida has become a tech hub in India, with many IT companies, startups, and MNCs. As a result, it offers great job opportunities for data analysts. Whether you are a fresher or a working professional looking to switch careers, Noida is the right place to start your journey.
Uncodemy, located in Noida, provides industry-level training that helps you learn not just theory but also practical skills. Their course is designed by experts and is updated regularly to match real-world demands.
Overview of Uncodemy’s Data Analyst Course
The Data Analyst course at Uncodemy is beginner-friendly. You don’t need to be a coder or tech expert to start. The course starts from the basics and goes step-by-step to advanced topics. It includes live projects, assignments, mock interviews, and job placement support.
Here’s a detailed syllabus breakdown to help you understand what you will learn.
1. Introduction to Data Analytics
In this first module, you will learn:
What is data analytics?
Why is it important?
Different types of analytics (Descriptive, Diagnostic, Predictive, Prescriptive)
Real-world applications of data analytics
Role of a data analyst in a company
This module sets the foundation and gives you a clear idea of what the field is about.
2. Excel for Data Analysis
Microsoft Excel is one of the most used tools for data analysis. In this module, you’ll learn:
Basics of Excel (formulas, formatting, functions)
Data cleaning and preparation
Creating charts and graphs
Using pivot tables and pivot charts
Lookup functions (VLOOKUP, HLOOKUP, INDEX, MATCH)
Conditional formatting
Data validation
After this module, you will be able to handle small and medium data sets easily using Excel.
3. Statistics and Probability Basics
Statistics is the heart of data analysis. At Uncodemy, you’ll learn:
What is statistics?
Mean, median, mode
Standard deviation and variance
Probability theory
Distribution types (normal, binomial, Poisson)
Correlation and regression
Hypothesis testing
You will learn how to understand data patterns and make conclusions from data.
4. SQL for Data Analytics
SQL (Structured Query Language) is used to work with databases. You’ll learn:
What is a database?
Introduction to SQL
Writing basic SQL queries
Filtering and sorting data
Joins (INNER, LEFT, RIGHT, FULL)
Group By and aggregate functions
Subqueries and nested queries
Creating and updating tables
With these skills, you will be able to extract and analyze data from large databases.
5. Data Visualization with Power BI and Tableau
Data visualization is all about making data easy to understand using charts and dashboards. You’ll learn:
Power BI:
What is Power BI?
Connecting Power BI to Excel or SQL
Creating dashboards and reports
Using DAX functions
Sharing reports
Tableau:
Basics of Tableau interface
Connecting to data sources
Creating interactive dashboards
Filters, parameters, and calculated fields
Both tools are in high demand, and Uncodemy covers them in depth.
6. Python for Data Analysis
Python is a powerful programming language used in data analytics. In this module, you’ll learn:
Installing Python and using Jupyter Notebook
Python basics (variables, loops, functions, conditionals)
Working with data using Pandas
Data cleaning and transformation
Visualizing data using Matplotlib and Seaborn
Introduction to NumPy for numerical operations
Uncodemy makes coding easy to understand, even for beginners.
7. Exploratory Data Analysis (EDA)
Exploratory Data Analysis helps you find patterns, trends, and outliers in data. You’ll learn:
What is EDA?
Using Pandas and Seaborn for EDA
Handling missing and duplicate data
Outlier detection
Data transformation techniques
Feature engineering
This step is very important before building any model.
8. Introduction to Machine Learning (Optional but Included)
Even though it’s not required for every data analyst, Uncodemy gives you an introduction to machine learning:
What is machine learning?
Types of machine learning (Supervised, Unsupervised)
Algorithms like Linear Regression, K-Means Clustering
Using Scikit-learn for simple models
Evaluating model performance
This module helps you understand how data analysts work with data scientists.
9. Projects and Assignments
Real-world practice is key to becoming job-ready. Uncodemy provides:
Mini projects after each module
A final capstone project using real data
Assignments with detailed feedback
Projects based on industries like banking, e-commerce, healthcare, and retail
Working on projects helps you build confidence and create a strong portfolio.
10. Soft Skills and Resume Building
Along with technical skills, soft skills are also important. Uncodemy helps you with:
Communication skills
Resume writing
How to answer interview questions
LinkedIn profile optimization
Group discussions and presentation practice
These sessions prepare you to face real job interviews confidently.
11. Mock Interviews and Job Placement Assistance
Once you complete the course, Uncodemy offers:
Multiple mock interviews
Feedback from industry experts
Job referrals and placement support
Internship opportunities
Interview scheduling with top companies
Many Uncodemy students have landed jobs in top IT firms, MNCs, and startups.
Tools You’ll Learn in the Uncodemy Course
Throughout the course, you will gain hands-on experience in tools like:
Microsoft Excel
Power BI
Tableau
Python
Pandas, NumPy, Seaborn
SQL (MySQL, PostgreSQL)
Jupyter Notebook
Google Sheets
Scikit-learn (Basic ML)
All these tools are in high demand in the job market.
Who Can Join This Course?
The best part about the Data Analyst Course at Uncodemy is that anyone can join:
Students (B.Tech, B.Sc, B.Com, BBA, etc.)
Fresh graduates
Working professionals looking to switch careers
Business owners who want to understand data
Freelancers
You don’t need any prior experience in coding or data.
Course Duration and Flexibility
Course duration: 3 to 5 months
Modes: Online and offline
Class timings: Weekdays or weekends (flexible batches)
Support: 24/7 doubt support and live mentoring
Whether you’re a student or a working professional, Uncodemy provides flexible learning options.
Certifications You’ll Get
After completing the course, you will receive:
Data Analyst Course Completion Certificate
SQL Certificate
Python for Data Analysis Certificate
Power BI & Tableau Certification
Internship Letter (if applicable)
These certificates add great value to your resume and LinkedIn profile.
Final Thoughts
The job market for data analysts is booming, and now is the perfect time to start learning. If you’re in or near Noida, choosing the Data Analyst Course at Uncodemy can be your best career move.
You’ll learn everything from basics to advanced skills, work on live projects, and get support with job placement. The trainers are experienced, the syllabus is job-focused, and the learning environment is friendly and supportive.
Whether you’re just starting or planning a career switch, Uncodemy has the tools, training, and team to help you succeed.
Ready to start your journey as a data analyst? Join Uncodemy’s Data analyst course in Noida and unlock your future today!
0 notes
Text
Power BI Best Practices Parameters For Data Source Connection (60)
PowerBI #PowerBIDesktop #PowerBITutorials ✉ Business Queries / Analytics Consulting ✉ : [email protected] … source
0 notes
Text
How to Learn Alteryx: A Step-by-Step Guide for Beginners

Alteryx is now one of the most-loved platforms for data mixing, advanced analytics and automation. If you're a business analyst or a researcher, data analyst or moving into data analytics, acquiring Alteryx will increase your efficiency and enable you to get important insights from your data quickly.
In this post, we'll go through a straightforward and user-friendly guide to learning Alteryx effectively. From learning the basics of the platform to getting ready for work every step is created to help you gain the skills you need to succeed in real life and gain confidence using the platform.
What is Alteryx?
Alteryx is a robust auto-service analytics system that allows customers to join, clean and transform data from a variety of sources without writing complicated code. It has a drag-and-drop interface that is accessible to all types of users, both technical and non-technical.
Alteryx is a great tool for automating tasks. Alteryx it is possible to make repetitive chores easier, conduct statistical analysis, as well as even integrate with other tools such as Tableau, Power BI, R, and Python.
Why Learn Alteryx?
Here are some compelling motives:
A high demand for roles that involve data.
A user-friendly interface to complicated analytics
Excellent tool to automatize business workflows
Machine learning and advanced analytics integration
Improves the productivity of analysts and data professionals.
Step-by-Step Guide to Learning Alteryx
Step 1: Understand the Alteryx Platform
Start by becoming acquainted using beginning by gaining familiarity with the Alteryx Designer user interface. It is the primary application where the bulk tasks will be performed. Some of the most important elements to look into include:
Canvas: Where workflows are created
Tools palette: categorized operations like Input, Output, Preparation, Join, Parse, etc.
Window for configuration: Can be used to set the parameters for every tool
Results window: Shows output from your workflow
Alteryx offers a 14-day trial of Alteryx Designer. trial version of Alteryx Designer. Start by downloading it and exploring sample data.
Step 2: Use Alteryx Academy
Alteryx Academy provides a no-cost source provided by Alteryx that includes interactive videos, lessons and even challenges. It's beginner-friendly it covers all aspects of fundamentals to advanced processes.
The most important learning pathways comprise:
Beginning with Designer
Core Certification Prep
Weekly Challenges (for practice with hands)
Begin with "Interactive Lessons" as they offer a guided practice on the platform and explanations.
Step 3: Learn the Core Tools
Alteryx Designer is an Alteryx Designer platform has over 200 tools, however novices should concentrate on mastering the basics first. This includes:
Input Data / Output Data
Select
Filter
Join / Union
Sort
Formula
Summarize
Sample
Knowing how these tools operate can help you deal with the majority of common use cases, such as cleaning data, merging databases as well as filtering records and creating summary.
Step 4: Build Real Projects
The theory isn't enough, practice is essential. Do your best to duplicate your daily routines or download open data from websites such as Kaggle as well as Data.gov. Develop end-to-end workflows that incorporate data ingestion, transformation and export.
A few ideas for projects are:
Cleaning and preparing sales data
Data from multiple sources
Making monthly dashboards of business performance
Step 5: Earn Alteryx Certifications
Alteryx provides industry-recognized certificates. Alteryx Designer Core Certification Alteryx Designer Core Certification is an excellent place to begin. It is a way to prove your understanding of the basic instruments and the concepts.
The test is online, free and is open-book. The preparation for this certification enhances your knowledge of the practical applications.
Once you've completed the Core Level, you'll be able to move towards the Advanced and Expert levels.
Step 6: Join the Community
Alteryx Community Alteryx Community is an active online forum that lets users offer tips, ideas workflows, and the best methods. There are many benefits to this forum, including:
Inquiring questions and receiving expert advice
Community challenges can be addressed and solutions
Socializing with professionals and employers
Explore topics of interest and take part in regular discussions and other events.
Step 7: Explore Advanced Features
Once you've mastered the basics, look into further advanced areas, such as:
Predictive analytics using R as well as Python tools
Spatial analytics to analyze location and mapping
Automation with Alteryx Server as well as Scheduler
Making custom workflows and macros
These features provide more effective use cases and job possibilities.
Tips for Success
Try to practice every day even if only for 20-30 minutes
Note down screenshots or processes for future references.
Don't be a slave to memorizing. Focus on understanding the logic behind tool interactions
Make use of your "Search" feature inside Alteryx Designer to find quickly tools
Try working through the Weekly Challenges of Alteryx to improve your problem-solving abilities
Final Thoughts
Learning Alteryx will change how you handle data. Its easy-to-use interface and strong capabilities make it a vital tool for marketers, analysts as well as professionals working with data. If you follow this step-by-step tutorial and remaining constant, you'll develop the practical knowledge that makes you more useful in any role that relies on data.
Start small, continue to practice and don't be afraid look into Alteryx community and the Alteryx Training certification programs to keep yourself focused and keep growing.
0 notes
Text
Data Lake Integration with Azure Data Factory: Best Practices and Patterns

As businesses scale their data needs, Azure Data Lake becomes a go-to storage solution — offering massive scalability, low-cost storage, and high performance. When paired with Azure Data Factory (ADF), you get a powerful combo for ingesting, transforming, and orchestrating data pipelines across hybrid environments.
In this blog, we’ll explore best practices and design patterns for integrating Azure Data Lake with ADF, so you can build efficient, secure, and scalable data pipelines.
🔗 Why Use Azure Data Lake with Azure Data Factory?
Cost-effective storage for raw and processed data
Flexible schema support for semi-structured/unstructured data
Seamless integration with Azure Synapse, Databricks, and Power BI
Built-in support in ADF via Copy Activity, Mapping Data Flows, and linked services
🧱 Architecture Overview
A common architecture pattern:pgsqlSource Systems → ADF (Copy/Ingest) → Azure Data Lake (Raw/Curated Zones) ↓ ADF Mapping Data Flows / Databricks ↓ Azure SQL / Synapse Analytics / Reporting Layer
This flow separates ingestion, transformation, and consumption layers for maintainability and performance.
✅ Best Practices for Azure Data Lake Integration
1. Organize Your Data Lake into Zones
Raw Zone: Original source data, untouched
Curated Zone: Cleaned and transformed data
Business/Gold Zone: Finalized datasets for analytics/reporting
Use folder structures like:swift/raw/sales/2025/04/10/ /curated/sales/monthly/ /gold/sales_summary/
💡 Tip: Include metadata such as ingestion date and source system in folder naming.
2. Parameterize Your Pipelines
Make your ADF pipelines reusable by using:
Dataset parameters
Dynamic content for file paths
Pipeline parameters for table/source names
This allows one pipeline to support multiple tables/files with minimal maintenance.
3. Use Incremental Loads Instead of Full Loads
Avoid loading entire datasets repeatedly. Instead:
Use Watermark Columns (e.g., ModifiedDate)
Leverage Last Modified Date or Delta files
Track changes using control tables
4. Secure Your Data Lake Access
Use Managed Identities with RBAC to avoid hardcoded keys
Enable Access Logging and Firewall Rules
Implement Private Endpoints for data lake access inside virtual networks
5. Monitor and Handle Failures Gracefully
Enable Activity-level retries in ADF
Use custom error handling with Web Activities or Logic Apps
Integrate Azure Monitor for alerts on pipeline failures
📐 Common Patterns for Data Lake + ADF
Pattern 1: Landing Zone Ingestion
ADF pulls data from external sources (SQL, API, SFTP) → saves to /raw/ zone. Best for: Initial ingestion, batch processing
Pattern 2: Delta Lake via Data Flows
Use ADF Mapping Data Flows to apply slowly changing dimensions or upserts to data in the curated zone.
Pattern 3: Metadata-Driven Framework
Maintain metadata tables (in SQL or JSON) defining:
Source system
File location
Transformations
Schedul
ADF reads these to dynamically build pipelines — enabling automation and scalability.
Pattern 4: Hierarchical Folder Loading
Design pipelines that traverse folder hierarchies (e.g., /year/month/day) and load data in parallel. Great for partitioned and time-series data.
🚀 Performance Tips
Enable Data Partitioning in Data Flows
Use Staging in Blob if needed for large file ingestion
Tune Data Integration Units (DIUs) for large copy activities
Compress large files (Parquet/Avro) instead of CSVs when possible
🧠 Wrapping Up
When used effectively, Azure Data Factory + Azure Data Lake can become the backbone of your cloud data platform. By following the right patterns and best practices, you’ll ensure your pipelines are not only scalable but also secure, maintainable, and future-ready.
WEBSITE: https://www.ficusoft.in/azure-data-factory-training-in-chennai/
0 notes
Text
6 Powerful Ways Power BI Transforms Your Business Operations
Let’s get straight to the point—Power BI’s top selling points are its robust features, intuitive design, and cost-effectiveness.
In today’s hyper-connected world, data is the new bacon—hot, in-demand, and irresistible! And why not? It drives customer behavior, shapes internal strategies, and helps business leaders make smart decisions.
But here's the catch: raw data alone isn’t valuable unless it’s well-structured, visualized, and actionable. That’s where Microsoft Power BI steps in, transforming your data chaos into clarity.

What is Power BI and Why Should You Care?
According to Microsoft, Power BI is a unified, scalable business intelligence (BI) platform that enables you to connect, model, and visualize any kind of data. It supports self-service BI, as well as enterprise-level analytics.
Power BI helps you gather, visualize, and analyze large volumes of business-critical data in a way that’s simple, engaging, and easy to digest. You can finally ditch those dull spreadsheets and lengthy reports and get everything you need—right on a single dashboard, through eye-catching graphs and interactive charts.
Power BI also shares a familiar interface with Microsoft Excel, so even non-tech-savvy users can jump in and start using it with minimal training. Plus, it integrates effortlessly with Microsoft 365 tools, cloud platforms, and external databases.
6 Ways Power BI Enhances Your Business Processes
Let’s break down how Power BI can elevate your operations, streamline decision-making, and maximize return on investment.
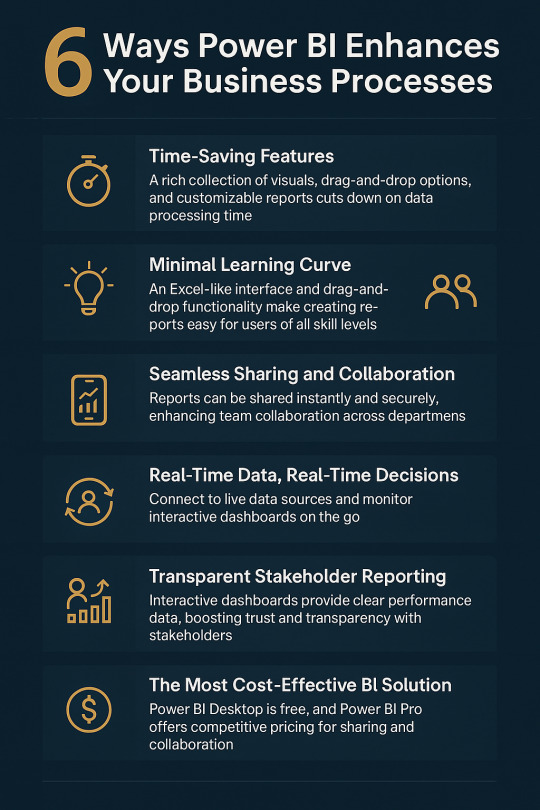
1. Time-Saving Features That Make a Big Difference
Power BI comes packed with a rich library of pre-built visuals, drag-and-drop elements, and highly customizable reports that significantly reduce the time spent on data processing.
Key time-saving features include:
Natural language queries: Ask questions like “What were sales last month?” and get instant charts.
Bookmarks, filters, and parameters: Personalize data stories based on your audience.
Zoom sliders: Easily navigate complex data.
DAX (Data Analysis Expressions): A powerful formula language for creating complex measures.
With Microsoft continuously adding updates, Power BI is always getting smarter.
2. Minimal Learning Curve
One of the biggest fears businesses have when adopting new software is the learning curve. But Power BI removes that barrier entirely.
Thanks to its Excel-like interface and drag-and-drop functionality, even first-time users can build impressive reports and dashboards. Your team doesn't need to be made up of data scientists—they just need a little curiosity and creativity.
For more advanced users, there’s support for:
M-Query for data transformation
DAX for advanced calculations
Python and SQL integration for deep-level analytics
Whether you’re a beginner or a pro, Power BI caters to all skill levels.
3. Seamless Sharing and Collaboration
Power BI takes team collaboration to the next level.
With Power BI Pro, users can:
Share reports instantly across departments
Embed dashboards into SharePoint, Teams, or your website
Schedule automatic report updates
Grant secure access to stakeholders and clients
Forget endless email chains and outdated attachments. With Power BI, everyone gets real-time access to the same data, keeping teams aligned and productive.
4. Real-Time Data, Real-Time Decisions
In a rapidly changing market, real-time insights can be a game-changer.
Power BI allows you to connect to live data sources—whether it's social media, SQL servers, CRM platforms, or cloud apps. By setting up an on-premises data gateway, your dashboards stay continuously updated.
You can even view interactive dashboards from your mobile device, so you’re never out of the loop—even on the go.
Example: Your support team can monitor live call logs to instantly spot and resolve customer wait-time issues.
That’s the power of timely decision-making.
5. Build Trust with Transparent Stakeholder Reporting
Let’s face it—no one likes long, text-heavy reports anymore.
Power BI enables you to present complex business performance data in an engaging, visual format that your stakeholders will love. From executives to investors, interactive dashboards help convey KPIs and results clearly and persuasively.
Reports can be accessed from any device at any time, building transparency and boosting stakeholder confidence.
And the best part? Updates are reflected automatically, ensuring they’re always seeing the most current data.
6. The Most Cost-Effective BI Solution on the Market
Cost plays a major role in decision-making, and Power BI truly stands out in this regard. Power BI Desktop is completely free—just download it and begin building interactive, data-rich reports right away.
For sharing and collaboration, Power BI Pro is available at just $9.99 per user per month. It allows you to publish dashboards on-premises and effortlessly share them with your team by simply sending a link.
Compared to other business intelligence tools, Power BI offers a highly competitive pricing model. When you factor in its powerful features and capabilities, it becomes clear that Power BI delivers exceptional value for your investment.
FAQs
1. Is Power BI suitable for beginners? Yes! With its Excel-like feel and drag-and-drop features, Power BI is designed for users at all levels.
2. How secure is Power BI for business data? Power BI uses Microsoft’s robust security protocols, including data encryption, role-based access, and compliance with GDPR.
3. Can I customize dashboards for different departments? Absolutely. Power BI lets you create department-specific views, filters, and dashboards based on the role or access level.
4. Does Power BI work offline? Power BI Desktop works offline for data modeling and report building. Online features like sharing and collaboration require internet access.
5. How often does Power BI get updates? Microsoft releases monthly feature updates, keeping the platform modern and user-friendly.
#power bi consulting services#generative ai#power bi solutions#data analytics#data analytics services#Power BI
0 notes
Text
Implementing the Tableau to Power BI Migration: A Strategic Approach for Transition
migrating from Tableau to Power BI offers organizations an opportunity to unlock new levels of analytics performance, cost-efficiency, and integration within the Microsoft ecosystem. However, transitioning from one BI tool to another is a complex process that requires careful planning and execution. In this guide, we explore the essential steps and strategies for a successful Tableau to Power BI migration, ensuring smooth data model conversion, optimized performance, robust security implementation, and seamless user adoption. Whether you're looking to modernize your analytics environment or improve cost management, understanding the key components of this migration is crucial to achieving long-term success.
Understanding the Tableau to Power BI migration Landscape
When planning a Tableau to Power BI migration , organizations must first understand the fundamental differences between these platforms. The process requires careful consideration of various factors, including data architecture redesign and cross-platform analytics transition. A successful Tableau to Power BI migration starts with a thorough assessment of your current environment.
Strategic Planning and Assessment
The foundation of any successful Tableau to Power BI migration lies in comprehensive planning. Organizations must conduct a thorough migration assessment framework to understand their current Tableau implementation. This involves analyzing existing reports, dashboards, and data sources while documenting specific requirements for the transition.
Technical Implementation Framework
Data Architecture and Integration
The core of Tableau to Power BI migration involves data model conversion and proper database connection transfer. Organizations must implement effective data warehouse integration strategies while ensuring proper data gateway configuration. A successful Tableau to Power BI migration requires careful attention to ETL process migration and schema migration planning.
Development and Conversion Process
During the Tableau to Power BI migration, special attention must be paid to DAX formula conversion and LOD expression transformation. The process includes careful handling of calculated field migration and implementation of proper parameter configuration transfer. Organizations should establish a robust development environment setup to ensure smooth transitions.
Performance Optimization Strategy
A critical aspect of Tableau to Power BI migration involves implementing effective performance tuning methods. This includes establishing proper query performance optimization techniques and memory usage optimization strategies. Organizations must focus on resource allocation planning and workload distribution to maintain optimal performance.
Security Implementation
Security remains paramount during Tableau to Power BI migration. Organizations must ensure proper security model transfer and implement robust access control implementation. The process includes setting up row-level security migration and establishing comprehensive data protection protocols.
User Management and Training
Successful Tableau to Power BI migration requires careful attention to user access migration and license transfer process. Organizations must implement effective group policy implementation strategies while ensuring proper user mapping strategy execution. This includes developing comprehensive user training materials and establishing clear knowledge transfer plans.
Testing and Quality Assurance
Implementing thorough migration testing protocols ensures successful outcomes. Organizations must establish comprehensive validation framework setup procedures and implement proper quality assurance methods. This includes conducting thorough user acceptance testing and implementing effective dashboard testing strategy procedures.
Maintenance and Support Planning
Post-migration success requires implementing effective post-migration monitoring systems and establishing proper system health checks. Organizations must focus on performance analytics and implement comprehensive usage monitoring setup procedures to ensure continued success.
Ensuring Long-term Success and ROI
A successful Tableau to Power BI migration requires ongoing attention to maintenance and optimization. Organizations must establish proper maintenance scheduling procedures and implement effective backup procedures while ensuring comprehensive recovery planning.
Partner with DataTerrain for Migration Excellence
At DataTerrain, we understand the complexities of Tableau to Power BI migration. Our team of certified professionals brings extensive experience in managing complex migrations, ensuring seamless transitions while maintaining business continuity. We offer:
Comprehensive Migration Services: Our expert team handles every aspect of your migration journey, from initial assessment to post-migration support.
Technical Excellence: With deep expertise in both Tableau and Power BI, we ensure optimal implementation of all technical components.
Proven Methodology: Our structured approach, refined through numerous successful migrations, ensures predictable outcomes and minimal disruption.
Transform your business intelligence capabilities with DataTerrain's expert Tableau to Power BI migration services. Contact us today for a free consultation and discover how we can guide your organization through a successful migration journey.
1 note
·
View note
Text
Converting Tableau Parameters into Power BI Slicers and What to Watch Out For
When migrating from Tableau to Power BI, one of the trickier tasks is translating Tableau parameters into Power BI slicers. While both tools allow users to control visualizations dynamically, they handle interactivity and logic quite differently. At OfficeSolution, we've seen many users hit unexpected roadblocks in this part of their Tableau to Power BI migration journey. Here’s what you need to know — and what to look out for.
Understanding Tableau Parameters vs. Power BI Slicers
In Tableau, parameters are highly flexible — they allow users to input a single value that can be used across calculated fields, filters, reference lines, and more. Parameters can be tied to any data source or even used independently of data.
On the other hand, Power BI uses slicers to filter data, typically based on fields in a data table. Unlike Tableau parameters, slicers are tied directly to the data model, which can limit their flexibility for some advanced scenarios.
Converting Parameters into Slicers
Here’s how you can map Tableau parameters into Power BI:
Parameter as Filter: If the parameter is used for filtering, simply replace it with a slicer in Power BI linked to the appropriate field. Use drop-down or list slicers for a similar experience.
Parameter in Calculated Fields: If the parameter is used within calculated fields in Tableau, you’ll need to replicate that logic using DAX measures in Power BI. This often involves creating What-If Parameters or custom DAX expressions.
Independent Parameter Control: For parameters not tied to any data field (e.g., a user-defined numeric input), you’ll need to use Power BI’s What-If Parameter functionality, which lets users choose values from a predefined range that can drive DAX logic.
What to Watch Out For
1. Loss of Interactivity Flexibility Tableau parameters can control multiple worksheets independently, which is harder to replicate in Power BI without complex DAX and syncing slicers.
2. No Direct User Input Power BI does not allow free text or dynamic user input directly on reports like Tableau does. You must predefine values for What-If parameters, limiting real-time flexibility.
3. Data Model Dependencies Since slicers in Power BI must be based on actual fields in the data model, migrating parameter logic that existed outside Tableau’s data can require creating new supporting tables or measures.
4. Visual Synchronization Issues Unlike Tableau, Power BI requires extra effort to synchronize slicers across report pages. Be sure to use the "Sync slicers" feature wisely to ensure consistent user experience.
Need a Smarter Way to Handle Parameter Migration? At OfficeSolution, our Pulse Convert tool streamlines Tableau to Power BI migrations — including intelligent mapping of parameters to slicers and What-If logic. Avoid manual work and potential logic mismatches with our automated approach.
Explore more migration tips at https://tableautopowerbimigration.com and take the complexity out of your analytics transition.
0 notes
Text
How Power BI Enhances Workflow Automation?

In today’s fast-paced business environment, organizations are continuously seeking tools and technologies that enhance productivity and streamline operations. Workflow automation has emerged as a game-changing strategy, and Power BI—Microsoft’s robust business analytics service—plays a pivotal role in achieving this goal. From Power BI dashboard development to integrating actionable insights, this platform empowers businesses to automate data analysis, decision-making, and reporting processes. This article delves into how Power BI transforms workflow automation, spotlighting real-world Power BI dashboard examples and insights from Power BI development experts to illustrate its immense potential.
What is Workflow Automation, and Why Does It Matter?
Workflow automation refers to the use of technology to perform routine tasks and processes with minimal human intervention. By automating workflows, businesses can:
Save Time: Reduce the time spent on manual data entry and repetitive tasks.
Improve Accuracy: Eliminate human error in critical processes.
Enhance Scalability: Handle growing data volumes efficiently.
Boost Productivity: Allow employees to focus on strategic initiatives instead of mundane tasks.
Power BI fits perfectly into this ecosystem by providing a centralized platform to analyze, visualize, and share data insights seamlessly, enhancing the automation of workflows across departments.
1. The Role of Power BI in Workflow Automation
Power BI Dashboard Development for Streamlined Insights
Power BI dashboards are the backbone of data visualization. They allow businesses to consolidate data from various sources into interactive, easy-to-understand formats. For workflow automation, these dashboards provide real-time updates, ensuring that teams have instant access to critical metrics without manual input.
Custom Dashboards: Tailored to specific organizational needs, these dashboards enable automated reporting and tracking.
Real-Time Data Monitoring: With live data streams, businesses can make proactive decisions and automate responses.
Seamless Integration: Power BI integrates with tools like Microsoft Power Automate to trigger workflows based on data-driven events.
Power BI’s Data Transformation Capabilities
Power BI’s Power Query Editor allows users to clean, transform, and prepare data for analysis. Automation features, such as scheduled refreshes and query parameters, ensure data stays up-to-date without manual intervention.
Automated Data Refresh: Keep dashboards updated with the latest information.
Data Modeling: Simplify complex data relationships for faster insights.
Templates and Reusability: Create reusable templates for recurring workflows.
2. Real-World Power BI Dashboard Examples in Automation
1. Sales Performance Monitoring
A global retail company utilized Power BI to automate their sales performance tracking. Instead of manually compiling sales data from multiple regions, a Power BI dashboard consolidated the information, enabling:
Automatic updates from CRM systems.
Real-time sales metrics displayed visually.
Triggered alerts for underperforming regions.
2. Inventory Management
Manufacturers often face challenges in maintaining optimal inventory levels. With Power BI, companies automate inventory tracking through dashboards that:
Sync with ERP systems to monitor stock levels.
Forecast demand based on historical trends.
Automatically alert teams to reorder supplies.
3. Financial Reporting
Financial teams benefit from automated Power BI dashboards that simplify reporting processes by:
Consolidating data from accounting software.
Providing real-time profit and loss insights.
Generating automated reports for stakeholders.
3. Why Businesses Rely on Power BI Experts
The complexity of building effective dashboards and integrating Power BI into existing workflows often necessitates the expertise of Power BI development experts. These professionals ensure:
Tailored Solutions: Customization to meet unique business needs.
Optimal Performance: Dashboards are optimized for speed and reliability.
Advanced Features: Implementation of AI and predictive analytics.
Hiring a Power BI company or consulting with certified experts ensures that businesses maximize their investment in workflow automation.
4. Integration with Other Microsoft Tools
Power Automate
Power BI works seamlessly with Power Automate to create event-driven workflows. For instance:
Automatically send reports to stakeholders when a dashboard metric crosses a threshold.
Trigger email notifications based on data trends.
Initiate approval processes within Microsoft Teams.
Microsoft Teams and SharePoint
With integration capabilities, Power BI dashboards can be embedded directly into Microsoft Teams or SharePoint, allowing team members to access insights without switching platforms.
5. Future Trends in Power BI and Workflow Automation
The evolution of Power BI is continuously expanding its capabilities in workflow automation. Future trends include:
AI Integration: Enhanced predictive analytics for smarter decision-making.
Natural Language Queries: Allowing users to interact with dashboards conversationally.
Increased Customization: Advanced tools for creating bespoke workflows.
Scalability: Handling larger datasets with faster processing speeds.
Conclusion
Power BI is more than just a data visualization tool; it’s a powerhouse for workflow automation. From Power BI dashboard development to the expertise of Power BI experts, businesses are leveraging this platform to transform their operations. By integrating powerful analytics with automated processes, organizations can achieve unprecedented efficiency, accuracy, and growth.
Whether you're looking to streamline financial reporting, optimize inventory management, or enhance sales tracking, Power BI offers unparalleled solutions tailored to your needs. Invest in a Power BI company or consult with Power BI development experts to unlock the full potential of workflow automation. The future of business efficiency is here, and it’s powered by Power BI.
#Power BI dashboard development#Power BI company#Power BI Experts#power BI dashboard examples#power BI development experts#power BI dashboard
0 notes
Text
Comprehensive Overview of Techniques and Tools in Data Analysis
Data analysis plays a pivotal role in uncovering insights, driving decisions, and fostering business growth. With the increasing importance of data-driven strategies, understanding the techniques and tools used in data analysis has become essential. This comprehensive guide explores key data analysis techniques and popular tools used by professionals across industries.
Data Analysis Techniques
1. Descriptive Analysis
Descriptive analysis summarizes data by providing insights into past events. Techniques include:
Data Summarization: Using measures like mean, median, and mode.
Data Visualization: Charts, graphs, and dashboards.
Trend Analysis: Identifying historical patterns.
2. Exploratory Data Analysis (EDA)
EDA involves examining datasets to uncover underlying patterns, relationships, and anomalies. Techniques include:
Data Cleaning: Removing inaccuracies and filling missing values.
Data Profiling: Summarizing data characteristics.
Outlier Detection: Identifying and handling unusual data points.
3. Inferential Analysis
This technique uses statistical models to infer properties about a population based on sample data. Key methods include:
Hypothesis Testing: Assessing assumptions about data.
Regression Analysis: Understanding relationships between variables.
Confidence Intervals: Estimating population parameters.
4. Predictive Analysis
Predictive analysis forecasts future outcomes using historical data. Techniques include:
Machine Learning Models: Regression, classification, and clustering.
Time Series Analysis: Forecasting future trends.
Predictive Modeling: Developing statistical models.
5. Prescriptive Analysis
Prescriptive analysis recommends actions based on data-driven insights. Methods include:
Optimization Models: Suggesting the best course of action.
Simulation Models: Evaluating different scenarios.
Decision Trees: Visualizing decision-making processes.
Popular Tools for Data Analysis
1. Spreadsheets (Excel, Google Sheets)
Widely used for basic data analysis tasks such as summarization, filtering, and visualization.
2. Statistical Software (R, SAS, SPSS)
R: An open-source language for statistical computing and graphics.
SAS: Advanced analytics and business intelligence software.
SPSS: Popular for social science data analysis.
3. Data Visualization Tools (Tableau, Power BI)
Tableau: Interactive dashboards and real-time visual analytics.
Power BI: Data visualization and business intelligence reporting.
4. Database Management Tools (SQL, MySQL, PostgreSQL)
SQL-based tools enable querying and managing structured datasets.
5. Big Data Tools (Apache Hadoop, Apache Spark)
Hadoop: Distributed storage and processing of large datasets.
Spark: Fast data processing for large-scale analytics.
6. Programming Languages (Python, R)
Python: Popular for machine learning, data manipulation, and visualization.
R: Preferred for statistical analysis and data modeling.
7. Business Intelligence Platforms (Looker, Qlik)
Looker: Data exploration and business intelligence platform.
Qlik: Self-service data visualization and guided analytics.
8. Cloud Platforms (Google Cloud, AWS, Azure)
Provide scalable storage, data processing, and machine learning services.
Best Practices for Data Analysis
Define Objectives: Clearly outline the goals and questions to address.
Data Collection: Ensure accurate, reliable, and relevant data sources.
Data Cleaning: Remove inconsistencies and prepare data for analysis.
Data Visualization: Use intuitive visuals to communicate findings.
Model Selection: Choose appropriate models and techniques.
Insight Communication: Present findings with actionable recommendations.
Conclusion
Data analysis is a critical skill in today’s digital world, driving decisions across business, research, and technology sectors. By mastering essential techniques and leveraging powerful tools, organizations can unlock the true potential of their data, enabling informed decision-making and sustained growth.
0 notes
Text
Machine Condition Monitoring Market Size & Forecast Report, 2030
The global machine condition monitoring market was valued at USD 3.49 billion in 2024 and is expected to grow at a compound annual growth rate (CAGR) of 7.6% from 2025 to 2030. This growth is primarily driven by the need for advanced diagnostic tools to assess equipment health and predict maintenance needs effectively. Manufacturers increasingly rely on condition monitoring systems to enhance equipment performance and maintenance, which helps to optimize productivity and reduce the risk of unexpected breakdowns. In addition, the shift toward lean manufacturing has motivated manufacturers to adopt condition monitoring systems to improve production efficiency, reduce downtime, and streamline inventory management for spare parts.
Businesses are showing increased interest in condition monitoring as it enhances productivity, extends equipment lifespan, and minimizes scrap parts by reducing downtime. With real-time data on machine conditions, companies can leverage automation and make data-driven maintenance decisions. A notable development in this space is eNETDNC’s integration of Microsoft Power BI Desktop with its machine monitoring software in February 2024. This integration allows users to create customizable, real-time reports and dashboards, helping customers optimize processes through interactive visualization of key performance indicators, machine status, and production trends.
Gather more insights about the market drivers, restrains and growth of the Machine Condition Monitoring Market
Machine condition monitoring involves measuring various parameters of equipment to prevent breakdowns by identifying changes that could indicate potential faults. This approach is widely adopted across industries such as oil & gas, automotive, power generation, metals & mining, marine, and aerospace. Condition monitoring has become central to predictive maintenance, which improves asset longevity, enhances cost savings, ensures operator safety, and streamlines industrial processes. The prevalence of the Internet of Things (IoT) has introduced a new dimension to machine condition monitoring, enabling real-time communication between devices. As a result, industries can now make more informed decisions and improve diagnostic precision.
As industries prioritize operational efficiency, they are increasingly adopting advanced machine condition monitoring technologies, including artificial intelligence (AI) and machine learning (ML). These technologies enable predictive maintenance by analyzing historical data to recognize patterns and anticipate failures before they occur. Additionally, integrating cloud computing offers centralized data storage and analysis capabilities, allowing for real-time monitoring and remote access to equipment performance data. This shift in technology supports better decision-making, proactive maintenance, and ultimately reduces downtime and maintenance expenses, while boosting productivity and equipment reliability.
Application Segmentation Insights:
The turbines & generators segment held the largest revenue share in 2024. This growth is mainly attributed to the power generation industry's need for preventive maintenance. Turbines and generators are crucial components in power plants, and machine condition monitoring allows early identification of issues that could lead to costly outages. Moreover, the segment benefits from the increased use of renewable energy sources, which require advanced monitoring and predictive maintenance solutions to ensure operational efficiency and cost-effectiveness. Innovations like vibration analysis and infrared thermography have further advanced condition monitoring in this segment by providing more precise data on turbine and generator health.
The HVAC (Heating, Ventilation, and Air Conditioning) systems segment is also anticipated to see considerable growth in the coming years. This growth is fueled by the rising demand for energy-efficient and environmentally sustainable HVAC systems, along with the growing adoption of smart HVAC solutions with remote control features. As the commercial and industrial sectors expand, so does the need to improve indoor air quality, driving demand for advanced HVAC systems. Key trends supporting this growth include the integration of green technologies like geothermal heat pumps and solar-powered HVAC systems, the use of smart thermostats for remote control, and the development of demand-response HVAC systems that adjust settings based on occupancy levels. These advancements enhance energy efficiency and align with sustainability goals.
The machine condition monitoring market is thus set to expand significantly, driven by the increasing adoption of predictive maintenance technologies, demand for sustainable solutions, and industry-wide digital transformation efforts.
Order a free sample PDF of the Machine Condition Monitoring Market Intelligence Study, published by Grand View Research.
0 notes
Text
Machine Condition Monitoring Market Overview, Competitive Landscape and Forecasts 2030
The global machine condition monitoring market was valued at USD 3.49 billion in 2024 and is expected to grow at a compound annual growth rate (CAGR) of 7.6% from 2025 to 2030. This growth is primarily driven by the need for advanced diagnostic tools to assess equipment health and predict maintenance needs effectively. Manufacturers increasingly rely on condition monitoring systems to enhance equipment performance and maintenance, which helps to optimize productivity and reduce the risk of unexpected breakdowns. In addition, the shift toward lean manufacturing has motivated manufacturers to adopt condition monitoring systems to improve production efficiency, reduce downtime, and streamline inventory management for spare parts.
Businesses are showing increased interest in condition monitoring as it enhances productivity, extends equipment lifespan, and minimizes scrap parts by reducing downtime. With real-time data on machine conditions, companies can leverage automation and make data-driven maintenance decisions. A notable development in this space is eNETDNC’s integration of Microsoft Power BI Desktop with its machine monitoring software in February 2024. This integration allows users to create customizable, real-time reports and dashboards, helping customers optimize processes through interactive visualization of key performance indicators, machine status, and production trends.
Gather more insights about the market drivers, restrains and growth of the Machine Condition Monitoring Market
Machine condition monitoring involves measuring various parameters of equipment to prevent breakdowns by identifying changes that could indicate potential faults. This approach is widely adopted across industries such as oil & gas, automotive, power generation, metals & mining, marine, and aerospace. Condition monitoring has become central to predictive maintenance, which improves asset longevity, enhances cost savings, ensures operator safety, and streamlines industrial processes. The prevalence of the Internet of Things (IoT) has introduced a new dimension to machine condition monitoring, enabling real-time communication between devices. As a result, industries can now make more informed decisions and improve diagnostic precision.
As industries prioritize operational efficiency, they are increasingly adopting advanced machine condition monitoring technologies, including artificial intelligence (AI) and machine learning (ML). These technologies enable predictive maintenance by analyzing historical data to recognize patterns and anticipate failures before they occur. Additionally, integrating cloud computing offers centralized data storage and analysis capabilities, allowing for real-time monitoring and remote access to equipment performance data. This shift in technology supports better decision-making, proactive maintenance, and ultimately reduces downtime and maintenance expenses, while boosting productivity and equipment reliability.
Application Segmentation Insights:
The turbines & generators segment held the largest revenue share in 2024. This growth is mainly attributed to the power generation industry's need for preventive maintenance. Turbines and generators are crucial components in power plants, and machine condition monitoring allows early identification of issues that could lead to costly outages. Moreover, the segment benefits from the increased use of renewable energy sources, which require advanced monitoring and predictive maintenance solutions to ensure operational efficiency and cost-effectiveness. Innovations like vibration analysis and infrared thermography have further advanced condition monitoring in this segment by providing more precise data on turbine and generator health.
The HVAC (Heating, Ventilation, and Air Conditioning) systems segment is also anticipated to see considerable growth in the coming years. This growth is fueled by the rising demand for energy-efficient and environmentally sustainable HVAC systems, along with the growing adoption of smart HVAC solutions with remote control features. As the commercial and industrial sectors expand, so does the need to improve indoor air quality, driving demand for advanced HVAC systems. Key trends supporting this growth include the integration of green technologies like geothermal heat pumps and solar-powered HVAC systems, the use of smart thermostats for remote control, and the development of demand-response HVAC systems that adjust settings based on occupancy levels. These advancements enhance energy efficiency and align with sustainability goals.
The machine condition monitoring market is thus set to expand significantly, driven by the increasing adoption of predictive maintenance technologies, demand for sustainable solutions, and industry-wide digital transformation efforts.
Order a free sample PDF of the Machine Condition Monitoring Market Intelligence Study, published by Grand View Research.
0 notes
Text
MSPTDA 20: Query Parameter for Dynamic Folder Location / Data Source in Power BI & Excel Power Query
All 6 files and folders and text files used in video are available in this zipped folder: … source
0 notes