#SupportResistance
Explore tagged Tumblr posts
Visit Tumblr Blog
Explore Tumblr blogs with no restrictions, modern design and the best experience.
Last Seen Tumblr Blogs


Fun Fact
Average visit duration of Tumblr.com is 10 mins and 25 secs.
Text
Where the Market Pauses and Reacts
Support and resistance are more than just lines on a chart—they represent zones of real trader behavior, emotion, and reaction. When you learn to spot them, you begin to understand where the market breathes. To sharpen your eye for these critical zones using XM’s advanced charting tools, this breakdown offers clear techniques: Support and Resistance – Identify Key Levels with XM Charts
0 notes
Text
"Change of Line: Bullish Indicator Signaling Potential Uptrend Reversal in Market Movement"
Change of line – bullish refers to a shift in price action where support or resistance is broken and later retested as a new support. This signals potential upward momentum as the price respects the previous resistance, now turned support, indicating a bullish reversal.
0 notes
Text
Gold's uptrend nears the resistance zone at 2752 - 2741, signaling a possible correction. Learn about the key support levels and strategies for long trades near 2612 - 2601 and 2557 - 2541, with targets near 2722.
[ Gold, Gold Trading, Gold Price, Technical Analysis, Market Analysis, Commodity Trading, Forex, Precious Metals, Trading Strategy, Support and Resistance ]
#GoldTrading#GoldMarket#MarketAnalysis#TradingOpportunities#SupportResistance#GoldPrices#Investment#TradingStrategies#FinancialMarkets
0 notes
Text
Kháng cự hỗ trợ là một trong những kiến thức cơ bản nhất mà bất kỳ Trader nào cũng cần phải biết
Kháng cự hỗ trợ là các phạm vi giá trong quá khứ, nơi giá đã tăng và giảm và khả năng hành vi này lặp lại trong tương lai.
Cùng xem tiếp bài viết tại: https://tradingpill.com/tim-hieu-ve-khang-cu-ho-tro-va-cach-su-dung/
0 notes
Text

#IndicatorsMetatrader5#SupportResistance#BBands#Bollinger#Bollingerb#BollingerBands#JohnBollinger#mt5
0 notes
Text
XRP primed for a rally towards $0.63 amid symmetrical triangle breakout
XRP primed for a rally towards $0.63 amid symmetrical triangle breakout
XRP/USD confirms symmetrical triangle breakout on the 4H chart. XRP bulls storm through all the major averages, RSI looks north. Former SEC Chair White defends Ripple in pivotal crypto case. The short-term outlook for Ripple (XRP/USD) appears bullish, with both the technical and fundamental factors supporting the No. 7 digital coin. XRP/USD currently trades around $0.5730 adding over 1.50% on a…

View On WordPress
#breakout#Cryptocurrencies#Primed#Rally#Ripple#SupportResistance#SYMMETRICAL#Technical Analysis#TRIANGLE#XRP
0 notes
Text
"Change of Line – Bearish: Identifying Key Trend Reversals with a Focus on Downside Momentum"
The "Change of Line – Bearish" pattern occurs when prices pull back to test a previously broken support line or resistance zone, then fail to break above it. This confirms bearish momentum, signaling a potential continuation of the downward trend.
0 notes
Text
USD/JPY is at the edge of the cliff ahead of the Non-Farm Payrolls – Confluence Detector
USD/JPY is at the edge of the cliff ahead of the Non-Farm Payrolls – Confluence Detector

[ad_1]
USD/JPY has been on the back foot after the Fed decision and fears that the US and China may be unable to reach a comprehensive deal. And now, the Non-Farm Payrolls are set to rock markets. How is the currency pair positioned?
The Technical Confluences Indicator is showing that USD/JPY has critical support at 107.94, which is the convergence of the previous 4h-Low, the Fibonacci 161.8%…
View On WordPress
0 notes
Photo

#Candlesticks#IndicatorsMetatrader5#SupportResistance#candlezones#candles#CandlesZonesPRO#candlesticks#mt5#PriceAction#resistance#support#technicalanalysis
0 notes
Text
XRP bulls need to crack 200-DMA to extend the recovery
XRP bulls need to crack 200-DMA to extend the recovery
XRP/USD looks to extend recovery from two-week lows. 200-DMA is the level to beat for the XRP bulls. Daily RSI edges higher but holds below the midline. Ripple (XRP/USD) is attempting to build on Friday’s impressive bounce from two-week lows of $0.2400 amid the upbeat sentiment witnessed across the crypto board so far this Saturday. The no. 5 coin currently trades near $0.2800, adding over 2% on…

View On WordPress
#200DMA#Bulls#Crack#Cryptocurrencies#Extend#Recovery#Ripple#SupportResistance#Technical Analysis#XRP
0 notes
Text
"Change of Line: Bullish Indicator Signaling Potential Uptrend Reversal in Market Movement"
Change of line – bullish refers to a shift in price action where support or resistance is broken and later retested as a new support. This signals potential upward momentum as the price respects the previous resistance, now turned support, indicating a bullish reversal.
0 notes
Photo
FOREX SUPPORT AND RESISTANCE, PRICE ALERTS This article will show forex traders how to locate support and resistance levels on any currency pair and also how to set audible price alerts. http://www.forexearlywarning.com/forex-lessons/support-and-resistance
1 note
·
View note
Text
Why does the support/resistance line "pullback" occur?
Why does the support/resistance line “pullback” occur?
[ad_1]

Hi there, I am new to foreign exchange and at present studying, my foremost supply being Babypips. So I used to be studying this [BabyPips article](https://www.babypips.com/learn/forex/trading-the-lines) and may’t fairly perceive why does the pullback, talked about in the “Conservative Way” part, occur.
Here is my thought course of: You anticipate the value to rise after bouncing from a…
View On WordPress
#Analysis#Differential geometry#Fields of mathematics#Fundamental theorem of topos theory#happen#line#Mathematics#Pullback#supportresistance#www.babypips.com/learn/forex/trading-the-lines
0 notes
Photo

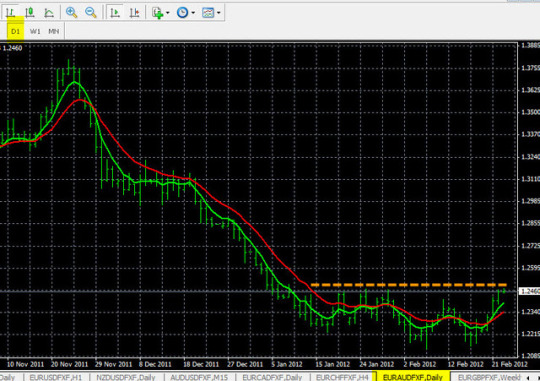
#IndicatorsMetatrader5#SupportResistance#TrendFollowing#MA#movingaverage#mt5#VolumeWeight#VolumeWeightedMovingAverage#VWMA
0 notes
Text
Godaddy successful supportline profit
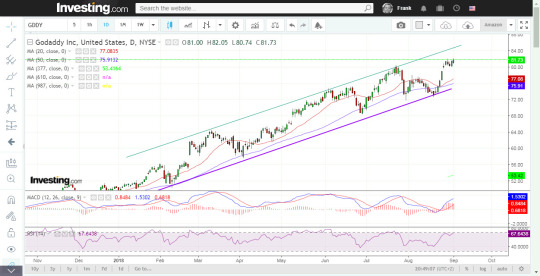
Godaddy successful supportline profit Back in August 17th, we published an article about Godaddy (NYSE:GDDY) and it was a great time to consider buying this Stock. Read the original post about Godaddy here Today, 2 weeks later we have sold our positions in Godaddy Inc., because we feel that resistance line is close. Furthermore we see some signals, that indicate that the top is near and we want to take profit now. We bought this Stock back in August 20 to a price noted at 73.17 and sold today at 81.68. Total profit for about 10-11 business days is calculated to 11.6%. This must be considered as a very good deal and successful trade. Congratulations to all, that followed this tip and collected some Dollars in profits :-) For those of you, that like to gamble, you can take ½ profit now and wait - maybe the price reach resistance line at 84.00-85.00. We do not gamble, so we followed our exit plan and sold all stocks of Godaddy Inc. We might buy again when the price fall back to support line next time and other buy signals becomes active. Godaddy successful supportline profit
Godaddy successful supportline profit You can read the original post from August 17th, right here Read the full article
#daytradingtradingstockmarket#Godaddy#investing#Nasdaq#Stockprofit#stocktobuy#stocktrading#Supportresistance
0 notes
Text
Ripple Price Analysis: Battle lines well-defined for XRP traders
Ripple Price Analysis: Battle lines well-defined for XRP traders
Read more on https://www.fxstreet.com Source link

View On WordPress
#Analysis#battle#Cryptocurrencies#Lines#Price#Ripple#SupportResistance#Technical Analysis#Traders#welldefined#XRP
0 notes