#Webgl Charts Library
Explore tagged Tumblr posts
Visit Tumblr Blog
Explore Tumblr blogs with no restrictions, modern design and the best experience.
Last Seen Tumblr Blogs


Fun Fact
The average Tumblr user visits about 67 pages every month.
Text
Creating High-Performance Real-Time Charts with JavaScript
New Post has been published on https://www.justwebdevelopment.com/blog/creating-high-performance-real-time-charts-with-javascript/
Creating High-Performance Real-Time Charts with JavaScript
The world of data visualization has undergone significant transformation over the past few years, with advancements in technology making it possible to create highly interactive and dynamic charts and graphs. One of the critical components in this evolution is the use of high-performance JavaScript chart libraries. Today, we learn more about the creation of real-time charts using such libraries, a topic on which I’ve collaborated closely with a developer to bring you the most accurate and practical insights.
The Importance of Real-Time Data Visualization
Real-time data visualization is crucial across various sectors, from finance and trading to medical research and aerospace. The ability to visualize data as it is generated allows for quicker decision-making and more responsive operations. Whether tracking stock prices, monitoring patient vitals, or observing real-time telemetry data from vehicles, the need for real-time updates in charts is universal.
The Technical Backbone: WebGL and WebAssembly
The backbone of high-performance JavaScript charts lies in technologies like WebGL and WebAssembly. WebGL, or Web Graphics Library, allows JavaScript to execute GPU-accelerated graphics, making it possible to render complex and data-intensive charts directly in the browser. This is especially beneficial for real-time applications as it ensures smooth and fast rendering even when dealing with large datasets.
WebAssembly, on the other hand, allows code written in multiple languages to run at near-native speed in web browsers. By leveraging WebAssembly, JavaScript chart libraries can perform complex calculations and data manipulations quickly, further enhancing performance.
Leveraging Hardware Acceleration
One of the standout features of advanced JavaScript chart libraries is their ability to leverage hardware acceleration. By utilizing the GPU for rendering, these libraries can handle millions of data points and multiple chart series without compromising on performance. This is particularly important for applications requiring real-time updates, as it ensures that the user interface remains responsive and smooth.
Creating Complex Interactions
Interactivity is a key component of modern data visualization. Users need to interact with charts to derive insights, such as hovering over data points to see detailed information, selecting and zooming into specific areas, or dynamically updating the data being visualized. Advanced chart libraries provide robust APIs that allow developers to create these complex interactions effortlessly. For instance, callbacks on series hover, selection, and data-point interactions enable a high degree of user engagement and functionality.
Building Interactive Dashboards
Dashboards that display multiple linked charts are common in industries like finance, medical research, and operations management. These dashboards allow users to see various data points and trends simultaneously and understand their correlations. JavaScript chart libraries facilitate the creation of such dashboards by providing features like linked zooming and panning, synchronized cursors, and dynamic addition or removal of chart panes.
Creating these interactive dashboards involves grouping multiple charts and synchronizing their interactions. This means that actions performed on one chart, such as zooming or panning, are reflected across all linked charts. This level of interaction enhances the usability and effectiveness of the dashboards, allowing users to gain insights quickly and efficiently.
The Role of Annotations and Markers
Annotations and markers play a crucial role in enhancing the readability and functionality of charts. By adding annotations, developers can highlight important data points, trends, or events, making it easier for users to understand the data. JavaScript chart libraries offer powerful annotation APIs that allow for the placement of various markers and shapes at specific data points or relative coordinates.
These annotations can be interactive, allowing users to click, drag, and resize them. This interactivity is useful in applications where users need to mark and comment on specific data points, such as in collaborative environments or analytical tools.
Enhancing User Experience with Cursors, Tooltips, and Legends
To further improve the user experience, advanced JavaScript chart libraries provide features like cursors, tooltips, and legends. Cursors, such as crosshairs and draggable vertical lines, help users track data points accurately. Tooltips provide additional information when users hover over data points, which is essential for detailed data analysis.
Legends are another critical feature, offering a quick reference to the data series displayed in the chart. By interacting with the legend, users can show or hide specific series, enhancing the focus on particular data points or trends.
Zooming and Panning Capabilities
Zooming and panning are fundamental interactions in data visualization, allowing users to focus on specific data ranges or explore different parts of the dataset. Advanced chart libraries offer sophisticated zooming and panning capabilities, which can be controlled programmatically or via user interactions.
These libraries provide APIs to zoom and pan in various directions and to scale the chart dynamically. This functionality is particularly useful in real-time applications where new data is continuously added, and users need to navigate through the evolving dataset.
Customization and Theming
Customization is key to integrating charts seamlessly into any application. JavaScript chart libraries come with various theming options, allowing developers to match the charts’ look and feel with the application’s overall design. Custom themes can be created to define colors, fonts, and other stylistic elements, ensuring that the charts are visually cohesive with the rest of the application.
Moreover, these libraries often provide animation options to enhance the visual appeal of charts. Animations can be applied to data transitions, user interactions, and style changes, making the charts more engaging and informative.
Financial and Stock Charting
In the financial sector, the ability to visualize stock data accurately and in real-time is crucial. Advanced JavaScript chart libraries support various financial chart types, such as candlestick, OHLC (Open, High, Low, Close), and mountain charts. These charts are essential for traders and analysts who need to monitor market trends and make informed decisions quickly.
Financial charts often require multiple panes to display different data series, such as price, volume, and indicators. By linking these panes and synchronizing their interactions, JavaScript chart libraries provide a comprehensive and intuitive way to visualize complex financial data.
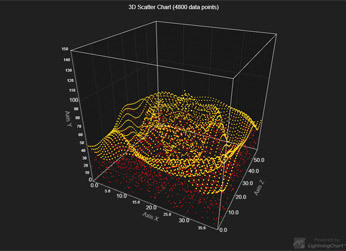
Real-Time 3D Charts
For applications requiring three-dimensional data visualization, JavaScript chart libraries offer WebGL-powered 3D charts. These charts allow for dynamic updates and seamless interactions, such as zooming, panning, and rotating the 3D scene. Real-time 3D charts are particularly useful in fields like medical imaging, scientific research, and engineering, where understanding the spatial relationships between data points is crucial.
Conclusion
Creating high-performance real-time charts with JavaScript requires a deep understanding of the underlying technologies and the specific needs of the application. By leveraging WebGL and WebAssembly, utilizing hardware acceleration, and providing robust interactivity and customization options, modern JavaScript chart libraries enable developers to create powerful and responsive data visualizations.
Through this exploration, we have highlighted the essential features and capabilities that make these libraries indispensable tools for real-time data visualization. From interactive dashboards to financial charting and 3D visualizations, the possibilities are vast and continually expanding, driven by the ongoing advancements in web technologies.
0 notes
Text
HTML Graphics

HTML provides various ways to include and work with graphics directly on web pages. The most common methods include using Canvas, SVG, and other techniques like CSS and WebGL for advanced graphics.
1. Canvas (<canvas>)
Purpose: The <canvas> element is a container for graphics that can be drawn using JavaScript. It's ideal for drawing shapes, making animations, creating charts, and developing games.
How It Works: The <canvas> element itself is just a container; the drawing is done with JavaScript, using a 2D or 3D context.
Attributes: width, height
Example: Drawing a rectangle on the canvas.<canvas id="myCanvas" width="200" height="100"></canvas><script> var canvas = document.getElementById('myCanvas'); var ctx = canvas.getContext('2d'); ctx.fillStyle = "blue"; ctx.fillRect(10, 10, 150, 80); </script>
Use Cases:
Creating dynamic graphics and animations
Developing browser-based games
Rendering charts and graphs
2. SVG (Scalable Vector Graphics) (<svg>)
Purpose: The <svg> element is used to define vector-based graphics that can be scaled without losing quality. SVG is XML-based, which means each element is accessible and can be manipulated via CSS and JavaScript.
How It Works: SVG graphics are defined in XML format, which makes them easy to edit and manipulate.
Example: Creating a simple circle with SVG.<svg width="100" height="100"> <circle cx="50" cy="50" r="40" stroke="black" stroke-width="3" fill="red" /> </svg>
Use Cases:
Icons and logos that need to be scalable
Creating complex vector illustrations
Responsive designs where graphics need to scale
3. CSS for Graphics
Purpose: CSS can be used to create and manipulate graphics through styles like gradients, shadows, and transformations.
How It Works: By using properties like background-image, border-radius, box-shadow, and transform, you can create graphic effects directly in CSS without using images.
Example: Creating a gradient background with CSS.<div style="width: 200px; height: 100px; background: linear-gradient(to right, red, yellow);"> </div>
Use Cases:
Adding simple graphical effects like gradients or shadows
Creating animations using keyframes
Designing layouts with complex shapes
4. WebGL
Purpose: WebGL (Web Graphics Library) is a JavaScript API for rendering 3D graphics within a web browser without the use of plugins.
How It Works: WebGL is based on OpenGL ES and provides a way to create complex 3D graphics and animations directly in the browser.
Example: WebGL is more complex and typically requires a JavaScript library like Three.js to simplify development.<!-- This is a simplified example, WebGL requires more setup --> <canvas id="glCanvas" width="640" height="480"></canvas> <script src="https://cdnjs.cloudflare.com/ajax/libs/three.js/r128/three.min.js"></script> <script> var scene = new THREE.Scene(); var camera = new THREE.PerspectiveCamera(75, window.innerWidth/window.innerHeight, 0.1, 1000); var renderer = new THREE.WebGLRenderer({ canvas: document.getElementById('glCanvas') }); renderer.setSize(window.innerWidth, window.innerHeight); document.body.appendChild(renderer.domElement); var geometry = new THREE.BoxGeometry(); var material = new THREE.MeshBasicMaterial({ color: 0x00ff00 }); var cube = new THREE.Mesh(geometry, material); scene.add(cube); camera.position.z = 5; var animate = function () { requestAnimationFrame(animate); cube.rotation.x += 0.01; cube.rotation.y += 0.01; renderer.render(scene, camera); }; animate(); </script>
Use Cases:
Creating complex 3D visualizations
Developing 3D games and simulations
Creating immersive virtual reality experiences
5. Inline SVG vs. <img> with SVG
Inline SVG: Directly embeds SVG code into the HTML, allowing for CSS and JavaScript manipulation.
<svg width="100" height="100"> <rect width="100" height="100" style="fill:blue" /> </svg>
<img> with SVG: Embeds an SVG file as an image, which is more static and less interactive.
<img src="image.svg" alt="Description">
Choosing the Right Method
Use <canvas> for dynamic, scriptable graphics.
Use <svg> for scalable, static graphics or when you need fine control over vector elements.
Use WebGL for 3D graphics and complex rendering tasks.
Use CSS for simple shapes, gradients, and animations.
These HTML5 graphics tools enable a wide range of visual possibilities, from simple shapes and icons to complex animations and 3D environments.
Read Me…
0 notes
Text
Benefits of Using LightningChart JS for the JavaScript Developers
Original Source: https://arctionltd.blogspot.com/2021/05/benefits-of-using-lightningchart-js-for.html
For developing web applications and software with JavaScript, developers have to use charting library. Charts are incorporated in a project to showcase data in a structured and methodical way. A large set of data may appear meaningless to viewers, if the dataset is not presented in an organized manner. JavaScript developers have to deal with different kinds of projects. From finance to trading, different industries need charts for representing large dataset. Hence, developers need a vast and efficient charting library. LightningChart JS, developed by Arction, can match the requirement of the developers with precision. In the following section, you can find the reasons why developers prefer using LightningChart JS.
Top-class Performance
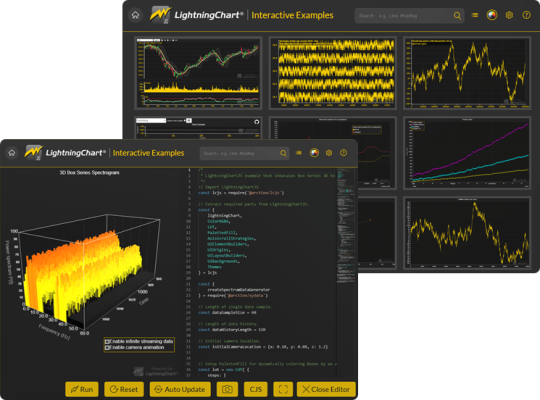
LightningChart JS is a cross platform charting library. Developers can use the charting library to incorporate 2D and 3D charts to their software development projects. Being a WebGL based charting library, LightningChart JS assures top-notch performance to the users. All charts render quickly, and it helps the developers to save their precious time. Another notable thing is the performance of the charting library with large dataset. Many JS charting controls become sluggish or slow, when dataset is a large. But, LightningChart JS can deal with tens of millions of data points in real-time. On the dashboard, developers can render more than hundred charts simultaneously.
Terrific Performance Level
JavaScript developers want the charting library that offers unmatched performance. LightningChart JS can match the expectation of the developers in terms of the performance. This GPU-accelerated charting library comes with Webgl Charts Library rendering support. As a result, the performance of the charting library is smooth and satisfactory. When compared to other charting libraries for JavaScript, LightningChart JS stood out in rendering speed, performance, and features. The charting library uses the graphics processor of a device meticulously. As a result, it features smooth animations and high refresh rates. It also has a sturdy load capacity, which is comparably better than other charting libraries for JavaScript developers.
Various Types of Charts
LightningChart JS features different kinds of charts. Arction has a skilled development team to ensure feature-rich charting library. The library includes 2D and 3D charts. Apart from them, there are many other charts. Some of those charts are zoom band charts, donut charts, gauge charts, pyramid chart, funnel chart, etc. All these charts can be used for developing software for different industries, including finance, banking, survey, engineering, and many more.

Low Cost Packages
LightningChart JS comes with many features to meet requirements of different developers. It includes access to the 2D and 3D charts. You can buy a license to get all the features. Our license allows you to use LightningChart JS in a commercial product. There are separate packages for the web and application developers. Apart from the packages for individual developers, there is a package for the enterprise. Enterprise licenses are meant as a custom-made license to suit a company's needs. Using LightningChart JS is recommended by the developers for its affordability. At a minimal cost, LightningChart JS comes with a feature-rich charting library. The customization options make LightningChart JS the best charting library for the JavaScript developers.
1 note
·
View note
Text
Is Bokeh the Future of Data Visualization with Interactive Python Plots?

Data visualization plays a crucial role in understanding and communicating insights from data. Python, being a versatile programming language, offers numerous libraries for creating visualizations. Among them, Bokeh stands out as a powerful and user-friendly library that allows you to build interactive visualizations with ease.
Bokeh is an open-source Python library specifically designed for creating interactive visualizations for modern web browsers. It enables you to generate rich, interactive plots, charts, and dashboards that can be easily shared and deployed across different platforms. Whether you’re a data scientist, web developer, or data enthusiast, Bokeh provides a comprehensive set of tools to help you bring your data to life.
With just a few lines of Python code, Bokeh enables you to create interactive, JavaScript-powered visualizations displayable in a web browser.
Its workflow involves two stages selecting visual building blocks and customizing them. Bokeh integrates a Python library responsible for defining visualization content and interactivity with BokehJS, a JavaScript library that handles the display in web browsers. Bokeh automates the generation of JavaScript and HTML code and supports the loading of supplementary JavaScript from Bokeh’s CDN for enhanced functionality.
Key Features of Bokeh:
Interactive Visualizations: Bokeh allows users to create interactive plots that respond to user input, such as mouse movements, clicks, or selections. This interactivity enhances data exploration and enables users to gain deeper insights by dynamically manipulating visual elements.
Multiple Rendering Options: Bokeh offers multiple rendering options, making it flexible for various use cases. It supports rendering visualizations as HTML documents, standalone web applications, or embedded components within other Python frameworks like Flask and Django.
Diverse Plotting Types: Bokeh supports a wide range of plotting types, including scatter plots, line plots, bar plots, histograms, heatmaps, and more. These plot types can be customized extensively to suit specific data visualization requirements.
High-performance Rendering: Bokeh leverages modern web technologies, such as HTML5 Canvas and WebGL, to efficiently render interactive plots. This enables smooth interaction even with large datasets and complex visualizations.
Cross-platform Compatibility: Bokeh visualizations can be displayed on different platforms and devices, including desktops, tablets, and mobile devices. The responsive design ensures that the visualizations adapt to various screen sizes, maintaining their interactivity and readability.
Cross-language Support: Bokeh supports multiple programming languages, including Python, R, and Julia, allowing users to leverage Bokeh’s capabilities in their preferred language environment.
Community and Documentation: Bokeh has an active community of users and developers, providing support, examples, and tutorials. The official Bokeh documentation is comprehensive, making it easier for users to get started and explore its advanced features.
Getting Started with Bokeh:
To start using Bokeh, you need to install it via pip, a package manager for Python. Once installed, you can import Bokeh in your Python script or Jupyter Notebook and begin creating visualizations.
Bokeh provides multiple interfaces for creating plots. The most used interface is the ‘bokeh.plotting’ module, which offers a convenient way to define and customize visual elements. You can create plots, add data, and configure various plot attributes such as titles, axes, legends, and tooltips.
Bokeh follows a declarative approach, allowing users to define plots and visual elements using a concise syntax. Here’s a simple example to illustrate the basic usage of Bokeh:
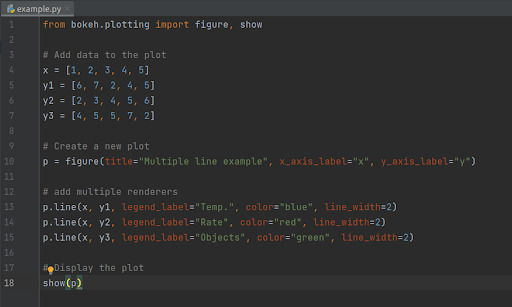
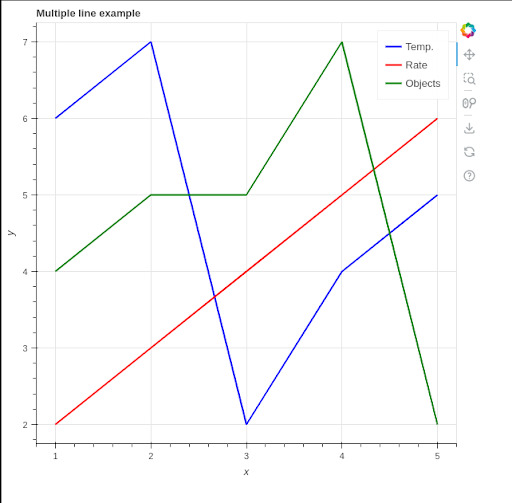
When you execute these lines of code, Bokeh creates an output file “example.html”. Bokeh also opens a browser to display it.
See the results in browser:
Conclusion:
Bokeh is a powerful Python library that empowers users to create interactive visualizations for the web. With its intuitive API and extensive customization options, Bokeh enables you to create visually appealing plots, charts, and dashboards that engage and inform your audience. Whether you’re exploring data, presenting insights, or building web applications, Bokeh is a valuable tool in your data visualization toolkit. By leveraging Bokeh’s capabilities, you can effectively communicate complex information, uncover hidden.
Originally published by: Is Bokeh the Future of Data Visualization with Interactive Python Plots?
0 notes
Text
3Dmol
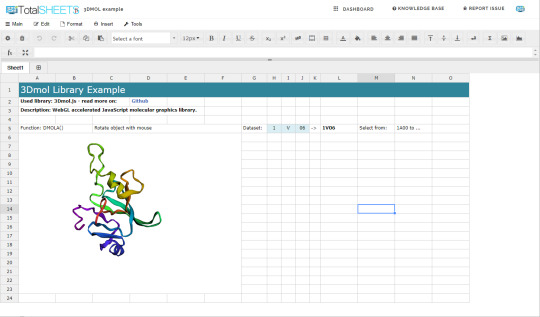
TotalSheets presents 3Dmol - WebGL accelerated JavaScript molecular graphics library. Read more: https://totalsheets.com/knowledge-base/3dmol/ #spreadsheets #spreadsheet #datavisualization #datascience #dataanalytics #dataanalyst #datanalysis #dataviz #charts #chart #javascript #webgl
1 note
·
View note
Text
Real-time Streaming Data Visualization Library - SensorChart
Real-time Streaming Data Visualization Library – SensorChart
SensorChart is a simple, fast JavaScript library that renders an animated chart to visualize real-time streaming data (e.g. fps) using Canvas and WebGL (Web Graphics Library) API.
How to use it:
Include the necessary regl and regl-line2d to handle WebGL 2D graph.
/path/to/regl.js /path/to/line2d.js
Include the SensorChart library.
/path/to/sensorchart.js
Create a canvas element on which you want…
View On WordPress
1 note
·
View note
Photo

🎉 JavaScript turns 25 years old
#489 — May 22, 2020
Unsubscribe : Read on the Web
JavaScript Weekly
A Complete Walkthrough to Using WebGL — A really thorough walkthrough of getting started with WebGL at the low level, complete with integrated, editable examples and coverage of the math behind 3D rendering. If you’ve ever wondered what libraries like Three.js are using behind the scenes, it’s all here.
Maxime Euzière
Microsoft Unveils 'Azure Static Web Apps' — Azure Static Web Apps brings modern static site deployment to Azure and integrates with GitHub and Visual Studio Code too. Want to see more? Here’s a 6 minute screencast demo. Yet another way to deploy those static single page apps :-)
Microsoft
The Most Complete Spreadsheet for JavaScript Apps – SpreadJS — Deliver true Excel-like experiences with this fast JavaScript enterprise spreadsheet solution. Build FinTech, analysis, budgeting, and forecasting apps. Featuring an Excel I/O, 450+ functions, tables, charts, sparklines, and more. View the latest demo.
SpreadJS by GrapeCity sponsor
The Unreasonable Effectiveness of Declarative Programming — Siddharth shows off his single file animation library by way of showing off the benefits of doing things in an (arguably) declarative style. A nifty post, this, which encourages you to interact with the code yourself.
Siddharth Bhat
The Third Age of JavaScript? — Yes, purely an opinion piece but he might have a point. “Every 10 years there is a changing of the guard in JavaScript. I think we have just started a period of accelerated change that could in future be regarded as the Third Age of JavaScript.”
Shawn Wang
Electron 9.0.0 Released — The popular cross platform desktop app framework gets more dependency bumps and is now running on Chromium 83, V8 8.3, and Node.js 12.14. There’s an integrated PDF viewer now, if you need that.
GitHub Inc.
⚡️ Quick bytes:
JavaScript is 25 years old at.. roughly now!
Microsoft has been showing off its work getting React Native on macOS and some other new Windows features.
Vue has made it into the 'adopt' zone of ThoughtWorks' languages and frameworks technology radar (and Vue 3.0.0 beta 14 is out too.)
Ionic are running IoniConf 2020 online next month (June 24).
💻 Jobs
Senior Software Engineer — Save Lives & Make an Impact — We use Node/TS/React & ML to provide crisis support via SMS. Help us scale globally with a focus on privacy and security.
Crisis Text Line
Find a Job Through Vettery — Vettery specializes in tech roles and is completely free for job seekers. Create a profile to get started.
Vettery
📚 Tutorials and Opinions

▶ (Re)-Implementing The Easiest JavaScript Game Ever — Have you ever played the ‘running dinosaur’ game in Chrome when your connection goes down? This is a fun 8 minutes spent reimplementing the basic mechanic. It’s scrappy, but that’s kinda the point. If you like his style, he’s done a 2 minute video flying through the development of another arcadey game.
KnifeCircus
The Architecture of a Serverless, Vue.js-Powered Content Management System — Not only does this outline the AWS infrastructural architecture pretty well, there’s code for you to use for your own setup if you wish.
Dan Bartlett
Understanding Lazy-Loading in Popular Frontend Frameworks — How Angular, React, and Vue handle on-demand loading of components.
tamos piros
▶ One Developer's Five Most Used JavaScript 'Tricks' — If you’re more at the beginner end of the scale, you might appreciate six minutes spent here. Well presented.
Aaron Jack beginner
Stream Chat API & JavaScript SDK for Custom Chat Apps — Build real-time chat in less time. Rapidly ship in-app messaging with our highly reliable chat infrastructure.
Stream sponsor
5 Differences Between Arrow and Regular Functions — A nice detailed look, with examples, of the differences between arrow and regular functions in JavaScript. I’m sure one or two of these will be new to many of you.
dmitri pavlutin
Dropbox's Great CoffeeScript to TypeScript Migration of 2017 — A deep retrospective from the Dropbox team on migrating hundreds of thousands of lines of CoffeeScript to TypeScript, sharing details on why they chose TypeScript and the challenges faced. “Fast forward to 2020, we now have over two million lines of TypeScript at Dropbox.”
David Goldstein
Promise.all vs Promise.allSettled — “I was reading the MDN docs on JavaScript promises and realized that the difference between Promise.all and Promise.allSettled wasn’t immediately obvious.”
JonLuca DeCaro
Growing Pains: From 0 to 13,000 Dependencies — Find out how your project can go from 0 to 13,000 dependencies in just a few steps.
Nikola Đuza
Error Handling in RxJS
Eugene Ghanizadeh Khoub
A (Mostly) Complete Guide to React Rendering Behavior
Mark Erikson
How to Use Object Destructuring in JavaScript — A code-heavy tutorial looking at object destructuring, a feature introduced in ES6 that allows you to extract properties from objects and bind them to variables.
dmitri pavlutin
🔧 Code & Tools
Reveal.js 4.0: An HTML Presentation Framework — A mature library takes another step forward. The homepage itself is, cleverly, a live demo (use the arrow keys). v4 adds several new features. Just want the code? Here’s the GitHub repo.
Hakim El Hattab
ac-colors: A Reactive Color Conversion and Generation Library — A lot of power under the hood here being able to convert between RGB, HSL, HEX, XYZ, LAB, and LCHab, as well as handle random color generation and contrast ratio calculation.
Vinay
MongoDB Is Easy. Now Make It Powerful. Free Download for 30 Days. — Using MongoDB Atlas? Studio 3T is the professional GUI and IDE that unlocks the power you need.
Studio 3T sponsor
umi-request: A Modern HTTP Request Tool Based on Fetch — An attempt at combining some of the niceties of Axios with the modernity of the Fetch API to get the best of both worlds.
UmiJS
Howler.js: An Audio Library for The Modern Web — Makes things easier cross-platform. Uses the Web Audio API but can fall back to HTML5 Audio.
James Simpson
Vue Class Store: Universal Vue Stores You Write Once and Use Anywhere — We’ll let it speak for itself: “I’ll give you reactivity, computed properties and watches, written in standard JavaScript or TypeScript, with no setup or boilerplate, and you can use me anywhere.”
Dave Stewart
New Integration: PostgreSQL Instrumented for Node.js
AppSignal sponsor
Vue Formulate: The Easy Way to Build Forms with Vue.js — First linked a few months ago, this has come on leaps and bounds since with grouped fields, a way to stop validation, slots for customization, and more.
Braid LLC
NanoPop: A Minimalistic Positioning Engine — In a race to do things in as few bytes as possible, NanoPop aims to be much smaller than even PopperJS for positioning things like tooltips and popovers.
Simon R.
by via JavaScript Weekly https://ift.tt/3bVZAUv
0 notes
Link
Every market is ruled by certain common concepts, and JavaScript development is no exception. The product lifecycle is a concept that you can apply to several different environments to understand and predict their behavior. It is a business concept that helps us understand the stages that a product goes through during its life, explaining the impact of these stages on its popularity measure—in most cases, sales. If we observe market behavior patterns, we can estimate the current stage of a product and therefore make some predictions about its popularity. There are four stages: introduction, growth, maturity, and decline, and on the chart above, you can see the impact on expected product sales for each stage. For example, smartphones sales aren’t growing like five years ago—actually, quite the opposite is true—so we can fairly say that smartphones are getting into their maturity stage. In the past few years, we’ve seen the introduction of a lot of new technologies in JavaScript, but we needed time to see how the market was going to adopt them. Nobody wants to be the specialist on another promising technology that ends with zero adoption. Now, however, is the time to take another look. In this article, I will take a look at how popular JavaScript is becoming and the factors that may have affected this popularity, and I will try to predict what the future of JavaScript will look like. The Future of JavaScript Language Features Since the European Computer Manufacturers Association (ECMA) established the year-based release cycle for ECMAScript, a standardized JavaScript specification, we haven’t seen a lot of new features coming to the language—just a few each year. This could be one of the reasons we saw an increase of adoption of languages that compile to ES5 like TypeScript or ReasonML, both bringing features to the language that are highly requested by the community. This is not new—JavaScript went through this process before (CoffeeScript) and, in the end, those features ended up being merged into the language standard itself, and that’s probably the future that we can expect for these new typed features, too. But now we are starting to see a game changer move in the compile-to-js market with the increasing availability of WebAssembly in the browsers. Now, we can use almost any language and compile it to run at almost native speed in a browser and, more importantly, we are starting to see support for future-proof features like support for threads that will allow us to take advantage of the multi-processor architecture that represents the inevitable future of all devices. The official toolchain for WebAssembly will help you to compile C/C++, but there are a lot of community provided compilers for different languages, like Rust, Python, Java, and Blazor (C#). Particularly, the Rust community is pretty active and we started to see complete front-end frameworks like Yew and Dodrio. This brings a lot of new possibilities to browser-based apps, and you only need to test some of the great apps built with WebAssembly to see that near-native browser-based apps are a reality now, e.g., Sketchup or Magnum. Adoption of typed languages that compile to ES5 is mature enough, the players are well established, and they won’t disappear (or be merged with ES) in the near future, but we’ll see a slow shift in favor of typed languages with WebAssembly. Web Front-end Frameworks Every year, we see a big fight on the front-end frameworks market for the web, and React has been the indisputable winner for the past few years—since the introduction of their game-changer technology, the Virtual DOM, we saw an almost obligated adoption from their counterparts in order to remain relevant in the battle. Some years ago, we saw the introduction of a radical new approach to web application development with Svelte, the “compiler framework” that disappears at compile time leaving small and highly efficient JavaScript code. However, that feature was not enough to convince the community to move to Svelte, but with the recent launch of Svelte 3.0, they introduced real reactive programming into the framework and the community is thrilled, so perhaps we are witnessing the next big thing in front-end frameworks. Inspired by the destiny operator: var a = 10; var b <= a + 1; a = 20; Assert.AreEqual(21, b); Svelte brings reactivity to JavaScript by overloading the use of label statements with reactivity at compile time by instructing the code to be executed in topological order: var a = 10; $: b = a + 1; a = 20; Assert.AreEqual(21, b); This is a radical new idea that might help in different contexts, so the creator of Svelte is also working on svelte-gl, a compiler framework that will generate low-level WebGL instructions directly from a 3D scene graph declared in HTMLx. Needless to say that React, Angular, and Vue.js won’t disappear overnight, their communities are huge, and they’ll remain relevant for several years to come—we are not even sure if Svelte will be the actual successor, but we can be sure of something: We’ll be using something different sooner or later. WebXR and the Future of the Immersive Web Virtual reality has been struggling for the past 60 years to find a place in the mainstream, but the technology was just not ready yet. Less than ten years ago, when Jon Carmack joined Oculus VR (now part of Facebook Technologies, LLC), a new wave of VR started to rise, and since then, we’ve seen a lot of new devices supporting different types of VR and of course the proliferation of VR-capable applications. Browser vendors didn’t wanted to lose this opportunity, so they joined with the WebVR specification allowing the creation of virtual worlds in JavaScript with WebGL and well-established libraries like three.js. However, the market share of users with 6dof devices was still insignificant for massive web deployments, but the mobile web was still able to provide a 3D experience with the device orientation API, so we saw a bunch of experiments and a lot of 360 videos for a while. In 2017, with the introduction of ARKit and ARCore, new capabilities were brought to mobile devices and all sorts of applications with AR and MR experiences. However it still feels a little unnatural to download one specific app for one specific AR experience when you are exploring your world around you. If we could only have one app to explore different experiences… This sounds familiar. We solved that problem in the past with the browser, so why not give it another shot? Last year, Mozilla introduced the WebXR Device API Spec (whose last working draft, at the time of this writing, is from two weeks ago) to bring AR, VR, and MR (ergo XR) capabilities to the browser. A few of the most important browser vendors followed with their implementation, with an important exception: Safari mobile, so to prove their point, Mozilla released a WebXR capable browser under the iOS platform WebXR Viewer. Now, this is an important step because the combination of AR and VR brings 6dof to mobile devices and mobile device-based headsets like Google Cardboard or the Samsung Gear VR, as you can see in this example, increasing the market share of 6dof devices by a large margin and enabling the possibility of a large-scale web deployment. At the same time, the guys at Mozilla have been working on a new web framework to facilitate the creation of 3D worlds and applications called A-Frame, a component-based declarative framework with HTML syntax based on three.js and WebGL, having just one thing in mind—to bring back the fun and ease of use to web programming. This is part of their crusade to the immersive web, a new set of ideas on how the web should look like in the future. Luckily for us, they are not alone, and we’ll start to see more and more immersive experiences on the web. If you want to give it a try, go ahead download the WebXR Viewer and visit this site to see the possibilities of the immersive web. Once again, standard browser-based apps won’t fade in a year or two—we’ll probably always have them. But 3D apps and XR experiences are growing and the market is ready and eager to have them. Native Support for ES6 Almost every technology invented in JavaScript in the past decade was created to solve problems generated by the underlying implementation of the browsers, but the platform itself has matured a lot over these past few years, and most of those problems have disappeared, as we can see with Lodash, which once reigned the performance benchmarks. The same is happening with the DOM, whose problems once were the actual inspiration for the creation of web application frameworks. Now, it is a mature API that you can use without frameworks to create apps—actually, that’s what web components are. They are the “framework” of the platform to create component-based apps. Another interesting part of the platform evolution is the language itself. We’ve been using Babel.js for the past few years to be able to use the latest features of ECMAScript, but since the standard itself started to stagnate a little bit in the last few years, that was enough time to allow the browser vendors to implement most of their features, including native support of the static import statement. So now, we can start to consider the creation of applications without Babel.js or other compilers since we have (again) the support of the language features in the platform it self, and since Node.js uses the same V8 VM as Google Chrome, we’ve started to see stronger support of ES6 in Node.js, even with the static import statement under the experimental-modules flag. This doesn’t mean that we’ll stop seeing apps being compiled at a professional level, but it means that starting with a browser-based application will be easy and fun as it once was. Server-side JavaScript Even though JavaScript started with server side in 1995 with the Netscape Enterprise Server, it wasn’t until Ryan’s Dahl presentation in 2009 that JavaScript started to be seriously considered for server-side apps. A lot of things happened in the past decade to Node.js. It evolved and matured a lot, creating once again the opportunity for disruption and new technologies. In this case, it comes from the hand of its very own creator, Ryan Dahl, who has been working on a new perspective of server-side secured apps with Deno, a platform that supports natively the latest language features as async/await, and also the most popular compile-to-js language TypeScript, targeting the best performance thanks to their implementation in Rust and the usage of Tokio, but more importantly with a new security philosophy that differentiates it from most of the server-side platforms like Python, Ruby, or Java). Inspired by the browser security model, Deno will let you use the resources of the host only after the user explicitly granted the permissions to the process, which might sound a bit tedious at the beginning, but it might result in a lot of implications by allowing us to run unsecured code in a secured environment by just trusting the platform. Node.js will still be there in the future but may be we’ll start to see serverless services like AWS Lambda and Azure Functions to provide the Deno functionality as an alternative to provide unsecured server-side code execution on their systems. Conclusion These are exciting times in the JavaScript world—a lot of technologies have matured enough to leave space for innovation, the active community never stopped to amaze us with their brilliant and incredible ideas, and we expect a lot of new alternatives to well-established tools since their mature stages are arriving quickly; we won’t stop using them since a lot of them are really good and there is plenty of proof in the battlefield, but new and exciting markets will start to emerge, and you’d better be prepared. Staying up to date with the latest in JavaScript world isn’t easy, because of the pace of development, but there are some sources that can really help. First, the most important news source, in my opinion, is Echo JS, where you can an incredible amount of new content every hour. However, if you don’t have the time, the JavaScript Weekly newsletter is an excellent summary of the week in JS. Besides this, it is also important to keep an eye on the conferences around the world, and YouTube channels like, JSConf, React Conf, and Google Chrome Developers are wonderfully helpful. Conversely, if you’re interested in seeing some constructive critique of where JavaScript is heading, I recommend reading As a JS Developer, This Is What Keeps Me Up at Night by fellow JavaScript developer Justen Robertson.
0 notes
Text
15 Interesting JavaScript and CSS Libraries for April 2018
Our mission at Tutorialzine is to keep you up to date with the latest and coolest trends in web development. That’s why every month we release a handpicked collection of some of the best resources that we’ve stumbled upon and deemed worthy of your attention.
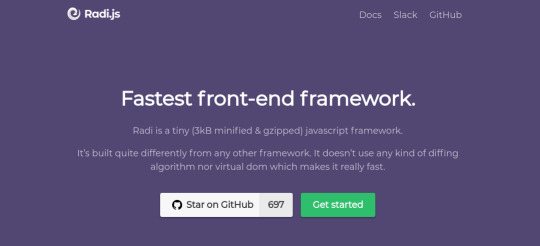
Radi is a fast and easy to use front-end javascript framework. It offers a simple way to build single-page or more complex applications. It is really tiny, only 3kb minified and gzipped, doesn't use any diffing algorithms or virtual dom, and requires no dependencies.

This is a JavaScript library for uploading any type of files. You can drop or copy and paste files, browse the filesystem or just use the API. It works with directories, local and remote URLs, and blobs. The library has a built in image optimization and automatic image resizing and cropping.
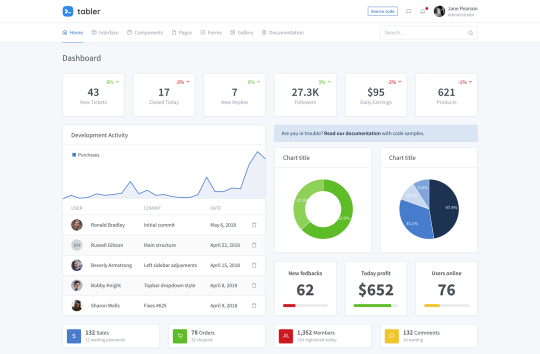
This is an open-source Bootstrap 4 Dashboard Theme. It is completely responsive, easy to integrate, follows the Bootstrap's coding conventions, and has a number of different customizable components to choose from. Tabler has great support for all modern browsers.

With Driver.js you can highlight items on your page, in order to attract the users attention. It is user-friendly, extremely lightweight and highly customizable. The library is licensed under MIT and works well on all browsers.

Rough.js is a lightweight canvas based library that can be used for drawing figures and shapes as if they were hand-drawn. It offers tools for drawin lines, curves, arcs, polygons and other shapes. The library also supports drawing SVG paths.
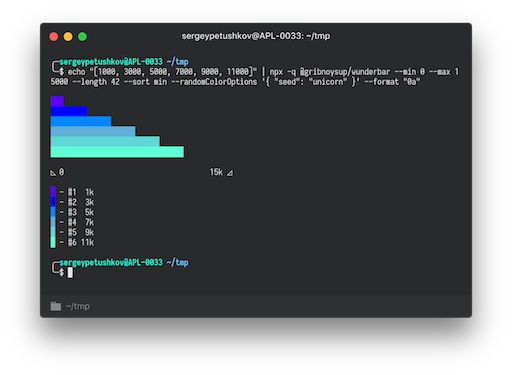
With this library you can print horizontal bar charts in your terminal. It is really simple to work with. You just need to pass an array in the command line, and the library will generate good lookin charts with legend and scale.

This is an open-source JavaScript library for creating beautiful charts for data visualization. It supports a large number of chart types such as bar, line, pie, heatmap and more. They are easy to use, highly customizable and work great on all browsers including IE8.
Material Design Icons is a simple, modern and beautiful icon set created by Google. It includes more than 900 icons, customized only with CSS. The icons are vector-based and look great on all screensizes, retina displays and low-dpi screens.
This is a modern, modular tool for compressing CSS files. It takes your CSS files and performs a number of optimizations, to compress your code as much as possible for a production environment. It removes whitespace, comments, unnecessary definitions and duplicate styles.
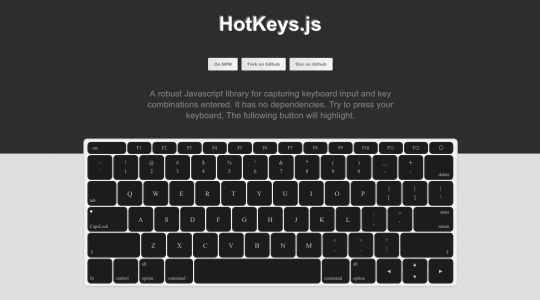
This is a JavaScript library for capturing keyboard input and key presses. It is very simple and user-friendly, has no dependencies and works on IE 6+, Safari, Firefox and Chrome. Special care must be taken when using it alongside other libraries, as it might interfere with keyboard handling.

TensorFlow is an open-source library for defining,training and deploying machine learning models in your browser. It allows you to build neural networks from scratch using high-level APIs and import, run and retrain existing models. What is more, TensorFlow supports WebGL and can work with GPU acceleration.

With Hover.css you can add a wide variety of hover effects and animations to links, buttons and images in your page. The code is self-contained and you can copy-paste it directly in your project, and is available in CSS, Sass and Less. The effects may not work on older browsers, because most of them use CSS3 features like transorms and transitions.

Sympact is a minimal library for calculating the CPU and memory usage of tasks in Node.js. It executes a script and evaluates its execution time, CPU usage, and memory usage, then returns a report containing the averages of the results. In addition, it comes with a CLI for a better user experience.

Leaflet is an open-source library for creating interactive maps. It offers some of the most important features for a map library like markers, layers, zooming and many more. It works on all major desktop and mobile platforms, has no external dependencies, and can be extended with a large number of plugins.

This is a functional promise library built with async/await. It is an alternative to the Bluebird.js library. What is more, it supports Tree Shaking, which means that you can use only the modules that you need and leave the rest, so it could end up really small in size.
Presenting Bootstrap Studio
a revolutionary tool that developers and designers use to create beautiful interfaces using the Bootstrap Framework.
Learn more
via Tutorialzine https://ift.tt/2Gxz7BB
0 notes
Link
First of all, nobody expected a lockdown. Nobody expected all the businesses will be paused or shifted to a total remote mode. And if most of the professions suffer from the lost opportunities and quarantine restrictions, developers (as they did so before for many years already) are the most used to ‘work from home’ people. And the new situation affected them not as much as others.
However, many of my friends working with aviation or travel, stayed without work. I hope, you all are ok.
I haven’t released March JS digest because of the start of the quarantine — I had a lot of work to do, and I suppose, many of you were busy with more important stuff than comparing and seeking for the best open source projects.
But now the situation is a bit better and I found some time to monitor what exactly had happened with JS repositories on GitHub in these two months, and what developers prefer for their projects when working from home.
Hence, we can grasp an overall situation and predict some trends to be followed in May. Stay safe!
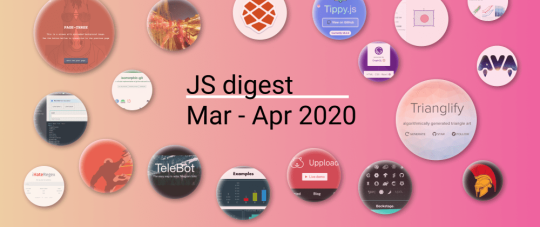
Most popular JS repositories in March and April 2020
Gatsby is a free and open source framework based on React that helps developers build websites and apps. 34,978 stars by now.
marked.js is a markdown parser and compiler. Built for speed. 22,199 stars by now.
AVA is a test runner for Node.js with a concise API, detailed error output, embrace of new language features, and process isolation. 17,842 stars by now.
Immer (German for: always) is a tiny package that allows you to work with immutable state in a more convenient way. It is based on the copy-on-write mechanism. 16,266 stars by now.
Playwright is a Node library to automate Chromium, Firefox, and WebKit with a single API. Playwright is built to enable cross-browser web automation that is ever-green, capable, reliable, and fast. 11,667 stars by now.
plotly.js is an open-source JavaScript charting library behind Plotly and Dash. 11,600 stars by now.
FullCalendar is a full-sized drag & drop JavaScript event calendar. 11,168 stars by now.
Trianglify is a library that creates algorithmically generated triangle art (SVG background). 9,302 stars by now.
Nano ID is a tiny (108 bytes), secure, URL-friendly, unique string ID generator for JavaScript. 9,129 stars by now.
MDX is an authorable format that lets you seamlessly use JSX in your markdown documents. You can import components, like interactive charts or notifications, and export metadata. 8,705 stars by now.
Bull is a Redis-based queue package for handling distributed jobs and messages in NodeJS. 8,237 stars by now.
Rome is an experimental JavaScript toolchain. It includes a compiler, linter, formatter, bundler, testing framework, and more. It aims to be a comprehensive tool for anything related to the processing of JavaScript source code. 8,193 stars by now.
ioredis is a robust, performance-focused, and full-featured Redis client for Node.js. 7,505 stars by now.
Tippy.js is a tooltip, popover, dropdown, and menu solution for the web. 7,352 stars by now.
Alpine.js is a rugged, minimal framework for composing JavaScript behavior in your markup. 7,050 stars by now.
ts-node is a TypeScript execution and REPL for Node.js. 6,630 stars by now.
Rickshaw is a JavaScript toolkit for creating interactive time-series graphs, developed at Shutterstock. 6,446 stars by now.
Excalidraw is a whiteboard tool that lets you easily sketch diagrams with a hand-drawn feel. 6,115 stars by now.
fkill-cli library stands for ‘Fabulously kill processes’. Cross-platform. 6,077 stars by now.
ora is an elegant terminal spinner. 5,927 stars by now.
Prompts is a library that stands for lightweight, beautiful, and user-friendly interactive prompts. 5,800 stars by now.
query-string helps you to parse and stringify URL query strings. 4,722 stars by now.
isomorphic-git is a pure JavaScript reimplementation of git that works in both Node.js and browser JavaScript environments. It can read and write to git repositories, fetch from and push to git remotes (such as GitHub), all without any native C++ module dependencies. 4,696 stars by now.
node-notifier is a Node.js module for sending notifications on native Mac, Windows, and Linux (or Growl as fallback). 4,454 stars by now.
Backstage is an open platform for building developer portals. It unifies all your infrastructure tooling, services, and documentation with a single, consistent UI. 4,011 stars by now.
react-ga is a JavaScript module that can be used to include Google Analytics tracking code in a website or app that uses React for its frontend codebase. It does not currently use any React code internally but has been written for use with a number of Mozilla Foundation websites that are using React, as a way to standardize our GA Instrumentation across projects. 3,723 stars by now.
jExcel is a lightweight vanilla javascript plugin to create web-based interactive tables and spreadsheets compatible with Excel or any other spreadsheet software. 3,629 stars by now.
AutoCannon is an HTTP/1.1 benchmarking tool written in Node, with support for HTTP pipelining and HTTPS. 3,604 stars by now.
Dinero.js is a library for working with monetary values in JavaScript. 3,590 stars by now.
Redwood is an opinionated, full-stack, serverless web application framework that will allow you to build and deploy JAMstack applications with ease. 3,341 stars by now.
franc is s natural language detection. 3,334 stars by now.
webpack-blocks is a library that helps you by providing functional building blocks for your webpack config: easier way to configure webpack and to share configuration between projects. 2,820 stars by now.
hotkey to trigger an action on a target element when a key or sequence of keys is pressed on the keyboard. This triggers a focus event on form fields or a click event on others. 2,041 stars by now.
Serialize JavaScript to a superset of JSON that includes regular expressions and functions. 2,012 stars by now.
React Easy State is a simple React state management. 2,006 stars by now.
Qoa is a minimal interactive command-line prompts. The library utilizes a simple & minimal usage syntax and contains 7 configurable console interfaces, such as plain text, confirmation & password/secret prompts as well as single keypress, quiz & multiple-choice navigable menus. 1,931 stars by now.
kasaya is a “WYSIWYG” scripting language and runtime for browser automation. 1,808 stars by now.
match-sorter is a simple, expected, and deterministic best-match sorting of an array in JavaScript. 1,788 stars by now.
Crank.js helps you to write JSX-driven components with functions, promises, and generators. 1,622 stars by now.
Ervy brings charts to terminal. 1,481 stars by now.
iHateRegex.io is a regex cheat sheet for the haters. This project gives you a visual representation of regular expressions, embed regular expression visualization on your sites, code highlighting and validation, and more. 1,479 stars by now.
Stryker is a mutation testing for JavaScript and friends. 1,469 stars by now.
react-enroute is a simple React router with a small footprint for modern browsers. This package is not meant to be a drop-in replacement for react-router, just a smaller simpler alternative. 1,441 stars by now.
OpenChakra is a visual editor and code generator for React using Chakra UI. You can draft components with the simple drag and drop UI. 1,429 stars by now.
jest-dom stands for custom jest matchers to test the state of the DOM. 1,417 stars by now.
Notyf is a minimalistic JavaScript library for toast notifications. It’s responsive, A11Y compatible, dependency-free and tiny (~3KB). Easy integration with React, Angular, and Vue. 1,361 stars by now.
on-change allows you to watch an object or array for changes. 1,354 stars by now.
React Awesome Slider is a 60fps content transition slider that renders an animated set of production-ready UI general-purpose sliders. 1,317 stars by now.
Panolens.js is an event-driven and WebGL based panorama viewer. Lightweight and flexible. It's built on top of Three.JS. 1,254 stars by now.
Uppload is a JavaScript image uploader. It’s highly customizable with 30+ plugins, completely free and open-source, and can be used with any file uploading backend. 1,235 stars by now.
telebot is a library supporting an easy way to write Telegram bots in Node.js. 898 stars by now.
Thank you for reading!
0 notes
Text
300+ TOP Highcharts Interview Questions and Answers
Highcharts Interview Questions for freshers experienced :-
1. What is Highcharts? Highcharts is a JavaScript based charting library. It is used to enhance web applications by adding interactive charting capability. Highcharts supports a wide range of charts. Charts are drawn using SVG in standard browsers. 2. What are the features of Highcharts? Features of Highcharts are: Export Dynamic Zoomablity Free to Use Lightweight External data Text Rotation Multiple axes DateTime support Multitouch Support Simple Configurations Configurable tooltips 3. What are Line Chart? Line Chart is used to draw line or spline based charts. Types of Line Chart: Basic line With data labels Ajax loaded data, clickable points Time series, zoomable Spline with inverted axes Spline with symbols Spline with plot bands Time data with irregular intervals Logarithmic axis 4. What is Angular Gauge? Angular Gauge is used to draw speedometer/gauge type charts. Types of Angular Gauge: Angular Gauge Solid Gauge Clock VU Meter Gauge with dual axes 5. What is Area Charts? Area Chart is used to draw area wise charts. Types of Area Chart: Basic Area Area with negative values Stacked area Percentage area Area with missing points Inverted axes Area-spline Area range Area range and line 6. What are Pie Charts? Pie Chart is used to draw pie based charts. Types of Pie Chart: Basic Pie Pie with Legends Donut Chart Semi circle Donut Pie with drill down Pie chart with gradient Pie chart with monochrome 7. What is Scatter Chart? Scatter Chart is used to draw scattered charts. 8. What is Bubble Chart? Bubble Chart is used to draw bubble based charts. Types of Bubble Chart: Bubbles Chart 3D Bubbles Chart 9. What is Dynamic Chart? Dynamic Chart is used to draw dynamic charts/data based charts where user can modify charts. Types of Dynamic Chart: Spline updating each second Click to add a point 10. What is 3D Chart? 3D Chart is used to draw 3-dimensional charts. Types of 3D Chart: 3D Column 3D Column with null 3D Column with stacking 3D Pie 3D Donut 11. What is Heat Map? Heat Map is used to draw heat map type charts. Types of Heat Map: Heat Map Large Heat Map 12. What is Tree Map? WebGL supported following drawing modes that are listed in table: Tree Map is used to draw tree map type charts. Types of Tree Map: Tree Map Tree Map with Levels Large Tree Map 13. What is Combination Chart? Combination Chart is used to draw mixed charts (bar chart with pie chart). Types of Combination Chart: Column, Line and Pie Dual Axes, Line and Column Multiple Axes Scatter with regression line 14. Define Irregular Time Data? First define an X value (date) for each point which adds data points with irregular intervals. 15. Does High chart run on client side or server side? It runs on client side only irrespective of your server such as PHP, Perl, ASP, ASP.NET, Node.js etc. It is directly loaded from your system. 16. How to integrate flot with angularjs? Since charting involves heavy DOM manipulation, directives are the way to go. Data can be kept in the Controller App.controller('Ctrl', function($scope) { $scope.data = , , ]]; }); And you can create a custom HTML tag1 specifying the model you want to get data from which angular can compile through a directive App.directive('chart', function() { return { restrict: 'E', link: function(scope, elem, attrs) { var data = scope; $.plot(elem, data, {}); elem.show(); } }; }); 17. Proper way to remove all series data from a Highcharts chart? This to remove all chart series, while(chart.series.length > 0) chart.series.remove(true); Highcharts Questions and Answers Pdf Download Read the full article
0 notes
Text
Collective #500
New Post has been published on https://languageguideto.com/awesome/collective-500/
Collective #500
CSS Nesting Module
The draft of a new CSS module that introduces the ability to nest one style rule inside another.
Read it
This content is sponsored via Thought Leader Seeking a common language for design& engineering
How design and engineering work together is evolving. From blueprint to build, and the changing nature of developer handoff.
Read the article
Color.review
A great way to test the contrast between background and text.
Check it out
lax.js
A light-weight JavaScript library to create smooths and beautiful animations when you scroll.
Check it out
7 Tricks with Resting and Spreading JavaScript Objects
Joel Thoms presents six lesser known tricks when using rest and spread with JavaScript objects.
Read it
CSS Grid: Floor Plan
A terrific CSS grid demo by Olivia Ng.
Check it out
Core
A responsive front-end feature kit in React. By the folks of Mason.
Get it
An Introduction to Web Components
The first article in a series that dives into Web Components. By Caleb Williams.
Read it
Wolfenstein: Ray Tracing On use WebGL1
Reinder Nijhoff shares his experimentation on real-time light tracing in WebGL.
Read it
Lumina
A beautiful WebGL game made by the folks at Goodboy Lab.
Check it out
How to create a continuous colouring range legend using D3 and d3fc
Ronan Graham shares how to implement a legend for a D3/ d3fc heatmap chart.
Read it
Bach SVG Music Animation
A demo by Steven Estrella where he synchronizes SVGs to music.
Check it out
Three.js NodeMaterial introduction
Don McCurdy explains what node-based materials are.
Read it
Be a Tourist !
An outdoor themed icon pack with 64 vector icons.
Get it
Making Sense of Chrome Lite Pages
Tim Kadlec demystifies Chrome Lite Pages and points out some unanswered questions.
Read it
HTML periodical table
A periodical table for HTML built with CSS grid. By Chen Hui Jing.
Check it out
Stop Chat Pop Ups
” Hello, Goodbye” blocks every chat or helpdesk pop up in your browser.
Check it out
Free Font: Reno Mono
A minimal monospace typeface designed by Renaud Futterer.
Check it out
Building a’ Homebrew’ Video Game Console
Sergio Vieira shares the fascinating narrative of how he constructed his own video game console.
Read it
Art of Noise# 8: Noisy Blobs
As part of their” Art of Noise” collections, Tibix created this great demo.
Check it out
Free Resources for Product Management
A large define of free resources and templates “youre going to” get work done in one place.
Check it out
From Our Blog Awesome Demos Roundup# 2
The second edition of our collecting of creative demos and experiments for your inspiration.
Check it out
Collective #500 was written by Pedro Botelho and published on Codrops.
Read more: tympanus.net
0 notes
Video
tumblr
Testlogger case study
LightningChart is the ultimate scientific data visualization software and charting controls for .NET and JavaScript.Get More Information: https://www.arction.com/lightningchart-js/
0 notes
Text
We’re Looking For Someone To Lead FiveThirtyEight’s Data Visualization Team
FiveThirtyEight’s hallmark is that we use data to inform our journalism. There are other things that define us — empiricism, transparency, an outsider’s perspective and a little bit of irreverence. But when it comes down to it, data is at the core of our mission.
And often the best way to communicate that data is visually — with tables, line charts, histograms, scatter plots, interactive dashboards, combinations of all that, whatever this is and more. Data visualization is central to FiveThirtyEight, and we’re looking for someone to lead our graphics and interactives team, oversee data visualization for the site and contribute to our overall editorial direction. This is a big, important role — held by one of the most senior editors in our newsroom, someone who reports directly to the managing editor and works across departments.
More specifically, the Deputy Editor, Graphics and Interactives, (that’s what we’re calling this position) will:
Oversee a team of journalists — visual, computational and database — charged with creating data-driven interactive features and charts. This includes “big swing” interactive features and dashboards, as well as smaller-scale graphics, both interactive and static, on a daily and weekly basis.
Help to plan and execute FiveThirtyEight’s long-term journalistic priorities.
Supervise members of the interactives team to ensure career development and performance in line with team and organizational goals and priorities.
Refine FiveThirtyEight’s style for data visualizations, graphics and long-term projects.
Should you apply? Definitely … IF you …
Have at least seven years of experience working on a wide variety of high-quality, intuitive interactive features that present a lot of data in a manner that is easy to use and understand, or have at least two years of experience as a manager — either of a team of visual and interactive journalists or of a team with similar skill sets in a related field.
Are proficient in many of the following: dynamic programing languages (such as Python and Ruby), web development technologies (HTML, CSS, JavaScript), web frameworks (Rails), mapping tools (ArcGIS, QGIS), visualization libraries (WebGL, D3).
Have knowledge of at least one statistical language (R, Stata, etc);
Have a portfolio that demonstrates an understanding of storytelling on multiple platforms, particularly mobile, as well as a clean, elegant and sophisticated aesthetic.
It might seem like we’re asking for a lot, but a successful candidate will get to lead a team of some of the most talented and creative journalists around, as well as work at the center of some of the biggest stories in the months ahead — the 2020 election, March Madness, the women’s World Cup, the NBA playoffs, fights over health care and immigration policy, etc. It’ll be a fun job.
To apply, please go here.
ABC News and FiveThirtyEight are equal opportunity employers. Applicants will receive consideration for employment without regard to race, color, religion, sex, national origin, sexual orientation, gender identity, disability or protected veteran status.
from News About Sports https://fivethirtyeight.com/features/were-looking-for-someone-to-lead-fivethirtyeights-data-visualization-team/
0 notes
Link
via FiveThirtyEight
FiveThirtyEight’s hallmark is that we use data to inform our journalism. There are other things that define us — empiricism, transparency, an outsider’s perspective and a little bit of irreverence. But when it comes down to it, data is at the core of our mission.
And often the best way to communicate that data is visually — with tables, line charts, histograms, scatter plots, interactive dashboards, combinations of all that, whatever this is and more. Data visualization is central to FiveThirtyEight, and we’re looking for someone to lead our graphics and interactives team, oversee data visualization for the site and contribute to our overall editorial direction. This is a big, important role — held by one of the most senior editors in our newsroom, someone who reports directly to the managing editor and works across departments.
More specifically, the Deputy Editor, Graphics and Interactives, (that’s what we’re calling this position) will:
Oversee a team of journalists — visual, computational and database — charged with creating data-driven interactive features and charts. This includes “big swing” interactive features and dashboards, as well as smaller-scale graphics, both interactive and static, on a daily and weekly basis.
Help to plan and execute FiveThirtyEight’s long-term journalistic priorities.
Supervise members of the interactives team to ensure career development and performance in line with team and organizational goals and priorities.
Refine FiveThirtyEight’s style for data visualizations, graphics and long-term projects.
Should you apply? Definitely … IF you …
Have at least seven years of experience working on a wide variety of high-quality, intuitive interactive features that present a lot of data in a manner that is easy to use and understand, or have at least two years of experience as a manager — either of a team of visual and interactive journalists or of a team with similar skill sets in a related field.
Are proficient in many of the following: dynamic programing languages (such as Python and Ruby), web development technologies (HTML, CSS, JavaScript), web frameworks (Rails), mapping tools (ArcGIS, QGIS), visualization libraries (WebGL, D3).
Have knowledge of at least one statistical language (R, Stata, etc);
Have a portfolio that demonstrates an understanding of storytelling on multiple platforms, particularly mobile, as well as a clean, elegant and sophisticated aesthetic.
It might seem like we’re asking for a lot, but a successful candidate will get to lead a team of some of the most talented and creative journalists around, as well as work at the center of some of the biggest stories in the months ahead — the 2020 election, March Madness, the women’s World Cup, the NBA playoffs, fights over health care and immigration policy, etc. It’ll be a fun job.
To apply, please go here.
ABC News and FiveThirtyEight are equal opportunity employers. Applicants will receive consideration for employment without regard to race, color, religion, sex, national origin, sexual orientation, gender identity, disability or protected veteran status.
0 notes
Text
The Top 3D JavaScript Libraries For Web Designers
Modern JavaScript is surprisingly powerful. Especially with support from WebGL libraries and SVG/Canvas elements.
With the right tools you can build pretty much anything for the web including browser-based games and native applications. Many of the newest groundbreaking features run on 3D, and in this post I’ve curated my list of the best 3D JS libraries currently available for web developers.
Three.js
There is no doubt that Three.js deserves to be at the top of this list. It can be somewhat complex to learn from scratch but it’s also one of the better 3D libraries out there.
It’s managed by a core group and released for free on GitHub. ThreeJS primarily works on canvas elements, SVG elements, and the WebGL library for rendering.
Learning the ropes is a challenge and will require at least mid-level JavaScript knowledge. But you can find the complete setup in the Three.js documentation.
If you’re serious about doing 3D on the web, this library is for you. It’s not the only choice, but it’s probably the most popular choice for a beginner to start building stuff fast.
Babylon.js
Another powerful library I like is Babylon.js. This one again relies on WebGL and runs solely in JavaScript.
It’s a bit more popular than other libraries but doesn’t have the same reach as Three.js.
Still it’s widely regarded as a powerful choice for web developers who want to create browser-based web games. On the homepage you can find a ton of demo previews and tips on how to get started with 3D game design.
There’s also a bunch of important links to resources like the GitHub repo and the Babylon JS tutorials.
All of those tutorials were designed by the Babylon team, so they’re an excellent place to start learning this library.
Cannon.js
For something a little off the beaten path check out Cannon.js. This doesn’t push the usual 3D concepts but instead works as a JavaScript-based physics engine for gaming.
Canon is meant to load fast so you can render elements quickly on the page. It supports most modern browsers and comes with a powerful API for building your own physics ideas off of this.
It works great with Canvas elements and with WebGL apps. The only tricky part is studying the library and getting over the initial learning curve.
Take a peek at the GitHub demos page to see how Cannon.js looks in the browser and why it’s so great.
CopperLicht
With a name like CopperLicht you might not know what to expect. But this is a powerful 3D JavaScript rendering engine built solely for web-based JS games.
Again it’s 100% open source and free to use for any project. The company that built CopperLicht does have some premium software & tools but these are not necessary for learning the CopperLicht library.
In fact, learning all the features will be tough since it supports an array of 3D functions like shadows/lighting, special effects, and 3D page element interactions.
The tutorials page is the best place to start and if you take this route be willing to take it slowly. There is a steep learning curve to get CopperLicht under your belt, although the payoff is well worth it.
Phoria.js
For web-based motion and 3D effects on the screen you might try Phoria.js. It’s really more of a graphics library but Phoria is rooted in 3D rendering inside HTML5 canvas elements.
The main site runs a bunch of demos and it’s a pretty reasonable library for creating 3D graphics. The learning curve isn’t too tough, and you’ll find a bunch of code snippets on the site that you can copy/paste.
Plus it doesn’t even use WebGL, so you don’t need to worry about that library. Although you will need to be comfortable working on the canvas element, but that just comes with practice.
Scene.js
For something that does run on WebGL check out Scene.js. Currently in version 4.2 this massive open source library lets you render elements in 3D for any modern browser.
It’s supported by a large team of developers and has years of major updates making it one of the best 3D rendering scripts you can use. However, this calls itself more of a visualization library, so it’s not just for rendering basic graphics.
Instead this could be used for much more complex tasks like designing multiple views of objects from different angles, or even creating basic 3D game graphics.
The homepage has a bunch of links to great examples if you’re curious to see how this works.
D3.js
While surfing the web you’ll often find charts and graphs that rely on 3D effects. Many of these run on D3.js which is a powerful JavaScript library for rendering data in 3D.
It’s also a totally free open source project with a very helpful GitHub page. The goal is to use SVG & canvas elements inside HTML to create dynamic data that can animate, rotate, and ultimately display information visually.
Take a look at the wiki entry on the GitHub page for more info. This includes some basic setup details along with documentation for anyone willing to dive into the D3 library.
LightGL.js
I don’t see much mention of LightGL.js around the web but it’s an excellent choice for 3D rendering in the browser.
This free open source library runs on the WebGL framework, and it’s meant to be the fastest, lightest library you can use. This works at a lower level than most abstraction libraries so it does require a stronger understanding of JavaScript.
Most developers just want simplicity so that could be why fewer people are sharing it around the water cooler.
But if you’re comfortable working in JavaScript then LightGL will give you a lot more control over your codebase.
Seen.js
For its complete lack of dependencies I had to include Seen.js in this list. Again this runs on the HTML5 canvas element but it works in vanilla JavaScript without any other required libraries.
It’s totally free for all developers and free to customize under the Apache 2.0 license. Some of the demos are pretty crazy considering they’re built solely in JavaScript.
Anyone who’s willing to push the boundaries of basic 3D visualization might take a look at Seen. It may not have a large following like Three.js but it’s a great canvas/SVG alternative that doesn’t rely heavily on WebGL.
If you are curious to start with WebGL then take a peek at our example gallery of 30 awesome WebGL experiments.
from Web Designing https://1stwebdesigner.com/3d-javascript-libraries/
0 notes