#bayesian theorem
Explore tagged Tumblr posts
Visit Tumblr Blog
Explore Tumblr blogs with no restrictions, modern design and the best experience.
Last Seen Tumblr Blogs


Fun Fact
The average Tumblr user visits about 67 pages every month.
Text
#quotes#kindle quotes#psychology#bayesian#statistics#prediction#bayes’ theorem#Tom Chivers#the brain is a Bayesian machine
2 notes
·
View notes
Text

i used to be a rationalist. roko's basilisk... bayesian theorems... ai research at yudkowsky's. you would have not liked me back then
6K notes
·
View notes
Note
hey,how you do all your research on shifting/manifestation? its rlly impressive
hi! thanks so much, i’m glad you enjoy my posts! ₊˚⊹♡ if you’re referring to the scientific evidence i bring up in my posts, i mainly use 🔗 PUBMED and other research websites to find peer-reviewed scientific papers!
occasionally, i’ll also refer to some science-based youtube channels such as:
🔗 DEVI SIETARAM (PhD chemical engineering)
🔗 SABINE HOSSENFELDER (PhD physics)
🔗 SCISHOW PSYCH (science communication channel)
regardless, i always do my best to ensure that all the scientific information i mention is ultimately backed by peer-reviewed research for reliability!
the further you go down the rabbit hole of scientific research that correlates with shifting/law of assumption concepts, the more undeniable it feels! here are some of the TOPICS i typically read about:
(non-local) consciousness research
the observer effect
neuroplasticity
post-materialist science (regarding consciousness as fundamental, not matter)
quantum superposition
placebo effect
bayesian brain theory
neuroconstructivism
quantum immortality
bell’s theorem + aspect’s experiments
the delayed-choice quantum eraser experiment
the double slit experiment
studies on monks and their unusual brain wave activity during deep meditation (gamma waves)
lucid dream + regular dream research
out of body experiences
…just to name a few! 🥹🫶
sending so much love and light <3
#askprincessmanifestation#law of assumption#loassblog#affirm and manifest 🫧 🎀✨ ִִֶָ ٠˟#loassumption#loa tumblr#how to manifest#affirm and persist#affirmations#4d reality#living in the end#loass success#loablr#lawofassumption#loa blog#loa advice#law of manifestation#loass#neville goddard#law of assumption community#shifting motivation#shiftingrealities#shifting tips#shifting realities#shifting community#shiftblr#shifting blog#reality shifting#shifting#void state
110 notes
·
View notes
Text
i am learning what a confidence interval is, because my undergrad lectures were for physicists and i read cosmology and gravitational waves literature, so i only really get exposed to Bayesian model selection, parameter estimation, &c.. therefore, they seem kind of unfamiliar. there's a 95% chance that this random interval (i.e. interval-valued random variable) contains the true parameter. but that's marginalised over all possible data, and from any particular realisation, Bayes's theorem might tell you that you should have a very different level of belief about whether the confidence interval contains the true parameter.
one can contrast these guys with the Bayesian 95% posterior credible interval, which you can also think of as a random interval, but one defined such that when i see the data, i will believe with 95% certainty under this model (and my prior) that this interval contains the true parameter
there isn't really an interesting take here; i will need to do some work to try to convince myself that one might want a confidence interval rather than a posterior credible interval.
14 notes
·
View notes
Text

Bayesian Active Exploration: A New Frontier in Artificial Intelligence
The field of artificial intelligence has seen tremendous growth and advancements in recent years, with various techniques and paradigms emerging to tackle complex problems in the field of machine learning, computer vision, and natural language processing. Two of these concepts that have attracted a lot of attention are active inference and Bayesian mechanics. Although both techniques have been researched separately, their synergy has the potential to revolutionize AI by creating more efficient, accurate, and effective systems.
Traditional machine learning algorithms rely on a passive approach, where the system receives data and updates its parameters without actively influencing the data collection process. However, this approach can have limitations, especially in complex and dynamic environments. Active interference, on the other hand, allows AI systems to take an active role in selecting the most informative data points or actions to collect more relevant information. In this way, active inference allows systems to adapt to changing environments, reducing the need for labeled data and improving the efficiency of learning and decision-making.
One of the first milestones in active inference was the development of the "query by committee" algorithm by Freund et al. in 1997. This algorithm used a committee of models to determine the most meaningful data points to capture, laying the foundation for future active learning techniques. Another important milestone was the introduction of "uncertainty sampling" by Lewis and Gale in 1994, which selected data points with the highest uncertainty or ambiguity to capture more information.
Bayesian mechanics, on the other hand, provides a probabilistic framework for reasoning and decision-making under uncertainty. By modeling complex systems using probability distributions, Bayesian mechanics enables AI systems to quantify uncertainty and ambiguity, thereby making more informed decisions when faced with incomplete or noisy data. Bayesian inference, the process of updating the prior distribution using new data, is a powerful tool for learning and decision-making.
One of the first milestones in Bayesian mechanics was the development of Bayes' theorem by Thomas Bayes in 1763. This theorem provided a mathematical framework for updating the probability of a hypothesis based on new evidence. Another important milestone was the introduction of Bayesian networks by Pearl in 1988, which provided a structured approach to modeling complex systems using probability distributions.
While active inference and Bayesian mechanics each have their strengths, combining them has the potential to create a new generation of AI systems that can actively collect informative data and update their probabilistic models to make more informed decisions. The combination of active inference and Bayesian mechanics has numerous applications in AI, including robotics, computer vision, and natural language processing. In robotics, for example, active inference can be used to actively explore the environment, collect more informative data, and improve navigation and decision-making. In computer vision, active inference can be used to actively select the most informative images or viewpoints, improving object recognition or scene understanding.
Timeline:
1763: Bayes' theorem
1988: Bayesian networks
1994: Uncertainty Sampling
1997: Query by Committee algorithm
2017: Deep Bayesian Active Learning
2019: Bayesian Active Exploration
2020: Active Bayesian Inference for Deep Learning
2020: Bayesian Active Learning for Computer Vision
The synergy of active inference and Bayesian mechanics is expected to play a crucial role in shaping the next generation of AI systems. Some possible future developments in this area include:
- Combining active inference and Bayesian mechanics with other AI techniques, such as reinforcement learning and transfer learning, to create more powerful and flexible AI systems.
- Applying the synergy of active inference and Bayesian mechanics to new areas, such as healthcare, finance, and education, to improve decision-making and outcomes.
- Developing new algorithms and techniques that integrate active inference and Bayesian mechanics, such as Bayesian active learning for deep learning and Bayesian active exploration for robotics.
Dr. Sanjeev Namjosh: The Hidden Math Behind All Living Systems - On Active Inference, the Free Energy Principle, and Bayesian Mechanics (Machine Learning Street Talk, October 2024)
youtube
Saturday, October 26, 2024
#artificial intelligence#active learning#bayesian mechanics#machine learning#deep learning#robotics#computer vision#natural language processing#uncertainty quantification#decision making#probabilistic modeling#bayesian inference#active interference#ai research#intelligent systems#interview#ai assisted writing#machine art#Youtube
6 notes
·
View notes
Text
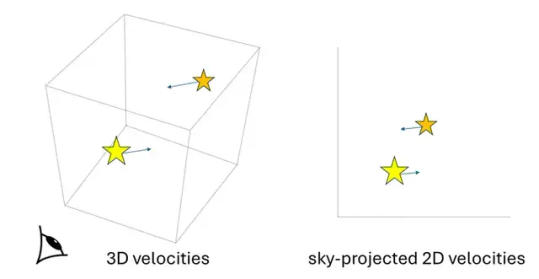
New method of measuring gravity with 3D velocities of wide binary stars is developed and confirms modified gravity at low acceleration
Wide binary stars with separation greater than about 2000 astronomical units are interesting natural laboratories that allow a direct probe of gravity at low acceleration weaker than about 1 nanometer per second squared. Astrophysicist Kyu-Hyun Chae at Sejong University (Seoul, South Korea) has developed a new method of measuring gravity with all three components of the velocities (3D velocities) of stars (Figure 1), as a major improvement over existing statistical methods relying on sky-projected 2D velocities. The new method based on the Bayes theorem derives directly the probability distribution of a gravity parameter (a parameter that measures the extent to which the data departs from standard gravitational dynamics) through the Markov Chain Monte Carlo simulation of the relative 3D velocity between the stars in a binary.
For the significance of the new method, Chae says, “The existing methods to infer gravity have the limitation that only the sky-projected velocities are used. Moreover, they have some limitations in accounting for the uncertainties of various factors including stellar masses to derive the probability distribution of a gravity parameter. The new method overcomes all these limitations. It is a sort of revolutionary and ultimate method for wide binaries whose motions can only be ‘snapshot-observed’ (that is, observed only at a specific phase of the orbital motion: because of the very long orbital periods of these binaries, a direct consequence of the low accelerations involved, one can only measure the positions and velocities of the stars at one moment, which is far less informative than having, ideally, data on a full orbit or at least a segment of it).” Chae adds, “However, the new method requires accurate and precise values of the third velocity component, that is, the line-of-sight (radial) velocity. In other words, only wide binaries with precisely measured radial velocities can be used.”
On the significance of the methodology, Xavier Hernandez, who initiated wide binary gravity tests in 2012, says, “The latest paper by Dr. K.-H. Chae on wide binaries presents a fully rigorous Bayesian approach which will surely become the standard in the field. Further, this latest paper presents also a proof of concept in going from 2-dimensional projected velocities to full 3D relative velocities between the two components of a wide binary. The level of accuracy reached from making full use of all available information is impressive.”
For the first application of the new method, Chae used about 300 wide binaries with relatively precise radial velocities selected from the European Space Agency’s Gaia data release 3. Although the first results are limited by the fact that Gaia’s reported radial velocities are not as precise as the sky-projected velocities, the derived probability distributions of gravity agree well with the recent results published by Chae and independently by Hernandez’s group as well. For wide binaries whose stars orbit each other with an internal acceleration greater than about 10 nanometers per second squared, the inferred gravity is precisely Newtonian, but for an internal acceleration lower than about 1 nanometer per second squared (or separation greater than about 2000 au), the inferred gravity is about 40 to 50 percent stronger than Newton. The significance of the deviation is 4.2sigma meaning that standard gravity is outside the 99.997 percent probability range. What is striking is that the deviation agrees with the generic prediction of modified gravity theories under the theoretical framework called modified Newtonian dynamics (MOND, sometimes referred to as Milgromian dynamics), introduced about 40 years ago by Mordehai (Moti) Milgrom.
On the first results based on the new method, Chae says, “It is encouraging that a direct inference of the probability distribution of gravity can be obtained for wide binaries that are bound by extremely weak internal gravity. This methodology may play a decisive role in the coming years in measuring gravity at low acceleration. It is nice that the first results agree well with the results for the past 2 years obtained by Hernandez’s group and myself with the existing methods.”
Pavel Kroupa, professor at the University of Bonn in Germany, says, “This is an impressive study of gravitation using very wide binaries as probes taken to a new level of accuracy and clarity by Prof. Dr. Kyu-Hyun Chae. This work greatly advances this topic, and the data, which will be improving over time, are already showing an increasingly significant deviation from Newtonian gravitation with an impressive consistency with the expectations from Milgromian gravitation. This has a major fundamentally important impact on theoretical physics and cosmology.”
Milgrom expresses his thoughts on the general significance of the wide binary results. “This new result by Prof. Chae strengthens in important ways earlier findings by him and others. They demonstrate a departure from the predictions of Newtonian dynamics in low-acceleration binary stars in our Galaxy. Such a departure from standard dynamics would be existing in itself. But it is even more exciting because it enters and appears in the same way as the departure from Newtonian dynamics appears in galaxies. It appears in the analysis only at or below a certain acceleration scale that is found to agree with the fundamental acceleration of MOND, and the magnitude of the anomaly they find is also consistent with the generic predictions of existing MOND theories. In galaxies, the observed (and MOND-predicted) anomaly is much larger, and is established very robustly, but much of the community support the view that it is due to the presence of dark matter; so, to them the galactic anomalies do not bespeak a conflict with standard dynamics. But, an anomaly as found by Prof. Chae, while more modest, cannot be accounted for by dark matter, and thus would indeed necessarily spell a breakdown of standard dynamics.”
Chae and his collaborators including Dongwook Lim and Young-Wook Lee at Yonsei University (Seoul, South Korea) and Byeong-Cheol Lee at Korea Astronomy and Space Science Institute (Daejeon, South Korea) are now obtaining precise radial velocities from their new measurements using observation facilities such as GEMINI North Observatory (with the instrument MAROON-X) and Las Cumbres Observatory, and from archival data outside Gaia as well. Hernandez and his collaborators are carrying out the speckle photometry of target wide binaries to identify any systems with a hidden third star. Hernandez comments on this point, “This methodology requires using pure binaries that are free of any hidden companion stars. This highlights the relevance of upcoming results from dedicated ground-based follow-up studies which will unambiguously rule out dubious systems containing hidden third components and hence permit to reach the full potential of the new method.” When all these observation results are combined, decisive results on the low-acceleration anomaly are expected.
On the near future prospect Chae says, “With new data on radial velocities, most of which have already been obtained, and results from speckle photometric observations, the Bayesian inference is expected to measure gravity sufficiently precisely, not only to distinguish between Newton and MOND well above 5sigma, but also to narrow theoretical possibilities of gravitational dynamics. I expect exciting opportunities for theoretical physics with new results in the coming years.”
IMAGE: 3D velocities versus sky-projected 2D velocities of a wide binary system. The new method uses the 3D velocities while all existing methods use the 2D velocities. Credit Kyu-Hyun Chae
2 notes
·
View notes
Text
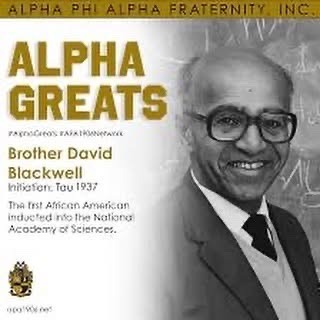
Dr. David Harold Blackwell (April 24, 1919 – July 8, 2010) was a statistician and mathematician who made significant contributions to game theory, probability theory, information theory, and Bayesian statistics. He is one of the eponyms of the Rao–Blackwell theorem. He was the first African American inducted into the National Academy of Sciences, the first African American tenured faculty member at UC Berkeley, and the seventh African American to receive a Ph.D. in Mathematics.
He was a pioneer in textbook writing. He wrote one of the first Bayesian textbooks, his 1969 Basic Statistics. By the time he retired, he had published over 90 books and papers on dynamic programming, game theory, and mathematical statistics.
He entered the University of Illinois at Urbana-Champaign with the intent to study elementary school mathematics and become a teacher. He earned his BS, MS, and Ph.D. in Mathematics all by the age of 22. He was a member of Alpha Phi Alpha Fraternity.
He took a position at UC Berkeley as a visiting professor in 1954 and was hired as a full professor in the newly created Statistics Department in 1955, becoming the Statistics department chair in 1956. He spent the rest of his career at UC Berkeley, retiring in 1988. #africanhistory365 #africanexcellence #alphaphialpha
2 notes
·
View notes
Text
What Are Key Techniques in Modeling?

In modeling, we embrace various key techniques to predict outcomes and understand complex systems. We utilize probability distributions to allocate probabilities among potential results. Parameter estimation methods, like Maximum Likelihood Estimation, help us refine our models. Additionally, simulation techniques allow us to create realistic scenarios and analyze interactions within them. Finally, advanced statistical tools empower our analyses, making sense of data patterns. Stick with us, and we’ll explore these concepts even further.
Overview of Modeling Techniques

When we explore modeling techniques, it’s crucial to understand that these methods not only quantify uncertainty but also help us represent complex processes in a manageable way.
Modeling random variables enables us to simulate scenarios that mirror reality, allowing for clearer predictions. We rely on historical data and known distributions to estimate key characteristics such as means and variances. In doing so, we build a robust framework for understanding random phenomena.
Each technique serves specific purposes and has its unique strengths. By familiarizing ourselves with these techniques, we enhance our ability to analyze complex situations and make informed decisions, paving the way for innovative solutions across various fields.
Understanding Probability Distributions

Probability distributions serve as the backbone of statistical modeling, allowing us to understand and quantify the likelihood of various outcomes in uncertain situations. They allocate probabilities among possible outcomes, helping us analyze random variables effectively.
Understanding these distributions gives us insights into random phenomena, forming the basis for statistical inference and hypothesis testing. By grasping their principles, we can make informed predictions and decisions based on data.
Parameter Estimation Methods

Understanding probability distributions sets the stage for effective parameter estimation, which helps us accurately characterize the behavior of random variables.
Alternatively, we can use the Method of Moments, aligning sample moments with theoretical ones.
Bayesian Estimation is another powerful approach, allowing us to incorporate prior knowledge and update our beliefs through Bayes’ theorem.
Finally, we quantify uncertainty around our estimates through confidence intervals and hypothesis tests.
Simulation Techniques and Their Uses

As we explore simulation techniques, it’s essential to recognize their versatility in modeling dynamic environments.
Simulation encompasses various types, including physics, cloth, smoke, fire, and liquids. These techniques allow us to create realistic scenarios where multiple elements interact, generating animations and objects through simulation rather than manual input.
This is particularly useful for depicting complex movements, like water splashes or car accidents, where precision is vital. Rather than focusing solely on shape, simulations emphasize parameter adjustments, providing a more technical approach to modeling.
Advanced Statistical Analysis Tools

While we explore advanced statistical analysis tools, it’s essential to recognize their power in extracting meaningful insights from data.
Tools like regression analysis allow us to understand relationships between variables, whether through linear or nonlinear models. Bayesian approaches enhance our analyses by incorporating prior knowledge, making them particularly useful when data is scarce.
By leveraging these tools, we can make informed decisions based on empirical evidence.
Client Feedback and Reviews
At Maps Studio, we appreciate feedback from our clients! In this section, we will display real reviews from platforms like GMB that highlight how our studio has helped aspiring models master key techniques in modeling. Stay tuned for the upcoming screenshots that showcase their voices! To learn more, check out Maps Studio.
Frequently Asked Questions
How Do I Choose the Right Modeling Software?
When choosing modeling software, we should consider our specific needs, the complexity of projects, and our skill level. Trying out different options can help us find the best fit for our creative and technical requirements.
What Is the Importance of Model Validation?
Model validation essential for ensuring our models accurately represent reality. It helps us identify errors, enhances reliability, and builds confidence in our results. By validating, we strengthen our conclusions and improve decision-making processes together.
Can Modeling Techniques Be Integrated With Machine Learning?
Absolutely, we can integrate modeling techniques with machine learning. By combining traditional methods with machine learning algorithms, we enhance our ability to analyze data and improve predictions, leading to more accurate and efficient outcomes in various applications.
How Do I Improve My Modeling Skills?
To improve our modeling skills, we should practice regularly, seek feedback, explore various techniques, and study real-world examples. Engaging with communities and utilizing tutorials also helps us enhance our understanding and creativity in modeling.
Conclusion
In exploring these key modeling techniques, we’ve uncovered the powerful intersection of creativity and analysis. By mastering methods like modeling and statistical analysis, we can transform our ideas into vivid realities and gain deeper insights into complex data. As we continue our journey, let’s embrace these tools to enhance our artistic projects and analytical endeavors. Together, we can push the boundaries of what’s possible, making our work not only more precise but also more impactful.
Visit Mapsstudio for more information about photography.
Note: We love sharing creative inspiration, photography tips, and industry insights to help you capture life’s best moments! However, the services, styles, and equipment mentioned in our articles are for informational purposes only and may not reflect our current offerings. For the latest on our photography services and portfolio, visit Maps studio. Let’s create something beautiful together!
#maps nyc modeling#maps modeling studio reviews#maps modeling studio#map design studio#modeling photography studio#maps studios boston#maps studio nyc#maps modeling studio photos#photography tips#modeling techniques#Modeling Skills
0 notes
Text
Speaker recognition refers to the process used to recognize a speaker from a spoken phrase (Furui, n.d. 1). It is a useful biometric tool with wide applications e.g. in audio or video document retrieval. Speaker recognition is dominated by two procedures namely segmentation and classification. Research and development have been ongoing to design new algorithms or to improve on old ones that are used for doing segmentation and classification. Statistical concepts dominate the field of speaker recognition and they are used for developing models. Machines that are used for speaker recognition purposes are referred to as automatic speech recognition (ASR) machines. ASR machines are either used to identify a person or to authenticate the person’s claimed identity (Softwarepractice, n.d., p.1). The following is a discussion of various improvements that have been suggested in the field of speaker recognition. Two processes that are of importance in doing speaker recognition are audio classification and segmentation. These two processes are carried out using computer algorithms. In developing an ideal procedure for the process of audio classification, it is important to consider the effect of background noise. Because of this factor, an auditory model has been put forward by Chu and Champagne that exhibits excellent performance even in a noisy background. To achieve such robustness in a noisy background the model inherently has a self-normalization mechanism. The simpler form of the auditory model is expressed as a three-stage processing progression through which an audio signal goes through an alteration to turn into an auditory spectrum, which is models inside neural illustration. Shortcomings associated with the use of this model are that it involves nonlinear processing and high computational requirements. These shortcomings necessitate the need for a simpler version of the model. A proposal put forward by the Chu and Champagne (2006)suggests modifications on the model that create a simpler version of it that is linear except in getting the square-root value of energy (p. 775). The modification is done on four of the original processing steps namely pre-emphasis, nonlinear compression, half-wave rectification, and temporal integration. To reduce its computational complexity the Parseval theorem is applied which enables the simplified model to be implemented in the frequency domain. The resultant effect of these modifications is a self-normalized FFT-based model that has been applied and tested in speech/music/noise classification. The test is done with the use of a support vector machine (SVM) as the classifier. The result of this test indicates that a comparison of the original and proposed auditory spectrum to a conventional FFT-based spectrum suggests a more robust performance in noisy environments (p.775). Additionally, the results suggest that by reducing the computational complexity, the performance of the conventional FFT-based spectrum is almost the same as that of the original auditory spectrum (p.775). One of the important processes in speaker recognition and in radio recordings is speech/music discrimination.. The discrimination is done using speech/music discriminators. The discriminator proposed by Giannakopoulos et al. involves a segmentation algorithm (V-809). Audio signals exhibit changes in the distribution of energy (RMS) and it is on this property that the audio segmentation algorithm is founded on. The discriminator proposed by Giannakopoulos et al involves the use of Bayesian networks (V-809). A strategic move, which is ideal in the classification stage of radio recordings, is the adoption of Bayesian networks. Each of the classifiers is trained on a single and distinct feature, thus, at any given classification nine features are involved in the process. By operating in distinct feature spaces, the independence between the classifiers is increased. This quality is desirable, as the results of the classifiers have to be combined by the Bayesian network in place. The nine commonly targeted features, which are extracted from an audio segment, are Spectral Centroid, Spectral Flux, Spectral Rolloff, Zero Crossing Rate, Frame Energy and 4 Mel-frequency cepstral coefficients. The new feature selection scheme that is integrated on the discriminator is based on the Bayesian networks (Giannakopoulos et al, V-809). Three Bayesian network architectures are considered and the performance of each is determined. The BNC Bayesian network has been determined experimentally, and found to be the best of the three owing to reduced error rate (Giannakopoulos et al, V-812). This proposed discriminator has worked on real internet broadcasts of the British Broadcasting Corporation (BBC) radio stations (Giannakopoulos et al, V-809). An important issue that arises in speaker recognition is the ability to determine the number of speakers involved in an audio session. Swamy et al. (2007) have put forward a mechanism that is able to determine the number of speakers (481). In this mechanism, the value is determined from multispeaker speech signals. According to Swamy et al., one pair of microphones that are spatially separated is sufficient to capture the speech signals (481). A feature of this mechanism is the time delay experienced in the arrival of these speech signals. This delay is because of the spatial separation of the microphones. The mechanism has its basis on the fact that different speakers will exhibit different time delay lengths. Thus, it is this variation in the length of the time delay, which is exploited in order to determine the number of speakers. In order to estimate the length of time delay, a cross-correlation procedure is undertaken. The procedure cross-correlates to the Hilbert envelopes, which correspond to linear prediction residuals of the speech signals. According to Zhang and Zhou (2004), audio segmentation is one of the most important processes in multimedia applications (IV-349). One of the typical problems in audio segmentation is accuracy. It is also desirable that the segmentation procedure can be done online. Algorithms that have attempted to deal with these two issues have one thing in common. The algorithms are designed to handle the classification of features at small-scale levels. These algorithms additionally result in high false alarm rates. Results obtained from experiments reveal that the classification of large-scale audio is easily compared to small-scale audio. It is this fact that has necessitated an extensive framework that increases robustness in audio segmentation. The proposed segmentation methodology can be described in two steps. In the first step, the segmentation is described as rough and the classification is large-scale. This step is taken as a measure of ensuring that there is integrality with respect to the content segments. By accomplishing this step you ensure that audio that is consecutive and that is from one source is not partitioned into different pieces thus homogeneity is preserved. In the second step, the segmentation is termed subtle and is undertaken to find segment points. These segment points correspond to boundary regions, which are the output of the first step. Results obtained from experiments also reveal that it is possible to achieve a desirable balance between the false alarm and low missing rate. The balance is desirable only when these two rates are kept at low levels (Zhang & Zhou, IV-349). According to Dutta and Haubold (2009), the human voice conveys speech and is useful in providing gender, nativity, ethnicity and other demographics about a speaker (422). Additionally, it also possesses other non-linguistic features that are unique to a given speaker (422). These facts about the human voice are helpful in doing audio/video retrieval. In order to do a classification of speaker characteristics, an evaluation is done on features that are categorized either as low-, mid- or high – level. MFCCs, LPCs, and six spectral features comprise the low-level features that are signal-based. Mid-level features are statistical in nature and used to model the low-level features. High-level features are semantic in nature and are found on specific phonemes that are selected. This describes the methodology that has been put forward by Dutta and Haubold (Dutta &Haubold, 2009, p.422). The data set that is used in assessing the performance of the methodology is made up of about 76.4 hours of annotated audio. In addition, 2786 segments that are unique to speakers are used for classification purposes. The results from the experiment reveal that the methodology put forward by Dutta and Haubold yields accuracy rates as high as 98.6% (Dutta & Haubold, 422). However, this accuracy rate is only achievable under certain conditions. The first condition is that test data is for male or female classification. The second condition to be observed is that in the experiment only mid-level features are used. The third condition is that the support vector machine used should posses a linear kernel. The results also reveal that mid- and high- level features are the most effective in identifying speaker characteristics. To automate the processes of speech recognition and spoken document retrieval the impact of unsupervised audio classification and segmentation has to be considered thoroughly. Huang and Hansen (2006) propose a new algorithm for audio classification to be used in automatic speech recognition (ASR) procedures (907). GMM networks that are weighted form the core feature of this new algorithm. Captured within this algorithm are the VSF and VZCR. VSF and VZCR are, additionally, extended-time features that are crucial to the performance of the algorithm. VSF and VZCR perform a pre-classification of the audio and additionally attach weights to the output probabilities of the GMM networks. After these two processes, the WGN networks implement the classification procedure. For the segmentation process in automatic speech recognition (ASR) procedures, Huang and Hansen (2006) propose a compound segmentation algorithm that captures 19 features (p.907). The figure below presents the features proposed Figure 1. Proposed features. Number required Feature name 1 2-mean distance metric 1 perceptual minimum variance distortionless response ( PMVDR) 1 Smoothed zero-crossing rate (SZCR) 1 False alarm compensation procedure 14 Filterbank log energy coefficients (FBLC) The 14 FBLCs proposed are implemented in 14 noisy environments where they are used to determine the best overall robust features with respect to these conditions. Turns lasting up to 5 seconds can be enhanced for short segment. In such case 2-mean distance metric is can be installed. The false alarm compensation procedure has been determined to boost efficiency of the rate at a cost effective manner. A comparison involving Huang and Hansen’s proposed classification algorithm against a GMM network baseline algorithm for classification reveals a 50% improvement in performance. Similarly, a comparison involving Huang and Hansen’s proposed compound segmentation algorithm against a baseline Mel-frequency cepstral coefficients (MFCC) and traditional Bayesian information criterion (BIC) algorithm reveals a 23%-10% improvement in all aspects (Huang and Hansen, 2006, p. 907). The data set used for the comparison procedure comprises of broadcast news evaluation data gotten from DARPA. DARPA is short for Defense Advanced Research Projects Agency. According to Huang and Hansen (2006), these two proposed algorithms achieve satisfactory results in the National Gallery of the Spoken Word (NGSW) corp, which is a more diverse, and challenging test. The basis of speaker recognition technology in use today is predominated by the process of statistical modeling. The statistical model formed is of short-time features that are extracted from acoustic speech signals. Two factors come into play when determining the recognition performance; these are the discrimination power associated with the acoustic features and the effectiveness of the statistical modeling techniques. The work of Chan et al is an analysis of the speaker discrimination power as it relates to two vocal features (1884). These two vocal features are either vocal source or conventional vocal tract related. The analysis draws a comparison between these two features. The features that are related to the vocal source are called wavelet octave coefficients of residues (WOCOR) and these have to be extracted from the audio signal. In order to perform the extraction process linear predictive (LP) residual signals have to be induced. This is because the linear predictive (LP) residual signals are compatible with the pitch-synchronous wavelet transform that perform the actual extraction. To determine between WOCOR and conventional MFCC features, which are least discriminative when a limit is placed on the amount of audio data consideration, is made to the degree of sensitivity to speech. Being less sensitive to spoken content and more discriminative in the face of a limited amount of training data are the two advantages that make WOCOR suitable for use in the task of speaker segmentation in telephone conversations (Chan et al, 1884). Such a task is characterized by building statistical speaker models upon short segments of speech. Additionally, experiments undertaken also reveal a significant reduction of errors associated with the segmentation process when WOCORs are used (Chan et al, 1884). Automatic speaker recognition (ASR) is the process through which a person is recognized from a spoken phrase by the aid of an ASR machine (Campbell, 1997, p.1437). Automatic speaker recognition (ASR) systems are designed and developed to operate in two modes depending on the nature of the problem to be solved. In one of the modes, they are used for identification purposes and in the other; they are used for verification or authentication purposes. In the first mode, the process is known as automatic speaker verification (ASV) while in the second the process is known as automatic speaker identification (ASI). In ASV procedures, the person’s claimed identity is authenticated by the ASR machine using the person’s voice. In ASI procedures unlike the ASV ones there is no claimed identity thus it is up to the ASR machine to determine the identity of the individual and the group to which the person belongs. Known sources of error in ASV procedures are shown in the table below Tab.2 Sources of verification errors. Misspoken or misread prompted phases Stress, duress and other extreme emotional states Multipath, noise and any other poor or inconsistent room acoustics The use of different microphones for verification and enrolment or any other cause of Chanel mismatch Sicknesses especially those that alter the vocal tract Aging Time varying microphone placement According to Campbell, a new automatic speaker recognition system is available and the recognizer is known to perform with 98.9% correct identification levels (p.1437 Signal acquisition is a basic building block for the recognizer. Feature extraction and selection is the second basic unit of the recognizer. Pattern matching is the third basic unit of the recognizer. A decision criterion is the fourth basic unit of the proposed recognizer. According to Ben-Harush et al. (2009), speaker diarization systems are used in assigning temporal speech segments in a conversation to the appropriate speaker (p.1). The system also assigns non-speech segments to non-speech. The problem that speaker diarization systems attempt to solve is captured in the query “who spoke when?” An inherent shortcoming in most of the diarization systems in use today is that they are unable to handle speech that is overlapped or co-channeled. To this end, algorithms have been developed in recent times seeking to address this challenge. However, most of these require unique conditions in order to perform and necessitate the need for high computational complexity. They also require that an audio data analysis with respect to time and frequency domain be undertaken. Ben-Harush et al. (2009) have proposed a methodology that uses frame based entropy analysis, Gaussian Mixture Modeling (GMM) and well known classification algorithms to counter this challenge (p.1). To perform overlapped speech detection, the methodology suggests an algorithm that is centered on a single feature. This single feature is an entropy analysis of the audio data in the time domain. To identify speech segments that are overlapped the methodology uses the combined force of Gaussian Mixture Modeling (GMM) and well-known classification algorithms. The methodology proposed by Ben-Harush et al is known to detect 60.0 % of frames containing overlapped speech (p.1). This value is achieved when the segmentation is at baseline level (p.1). It is capable of achieving this value while it maintains the rate of false alarm at 5 (p.1). Overlapped speech (OS) contributes to degrading the performance of automatic speaker recognition systems. Conversations over the telephone or during a meeting possess high quantities of overlapped speech. Du et al (200&) brings out audio segmentation as a problem in TV series, movies and other forms of practical media (I-205). Practical media exhibits audio segments of varying lengths but of these, short ones are easily noticeable due to their number. Through audio segmentation, an audio stream is broken down into parts that are homogenous with respect to speaker identity, acoustic class and environmental conditions..Du et al. (2007) has formulated an approach to unsupervised audio segmentation to be used in all forms of practical media. Included in this approach is a segmentation-stage at which potential acoustic changes are detected. Also included is a refinement-stage during which the detected acoustic changes are refined by a tri-model Bayesian Information Criterion (BIC). Results from experiments suggest that the approach possesses a high capability for detecting short segments (Du et al, I-205). Additionally, the results suggest that the tri-model BIC is effective in improving the overall segmentation performance (Du et al, I-205). According to Hosseinzadeh and Krishnan (2007), the concept of speaker recognition processes seven spectral features. The first of these spectral features is the Spectral centroid (SC). Hosseinzadeh and Krishnan (2007, p.205), state “the second spectral feature is Spectral bandwidth (SBW), the third is spectral band energy (SBE), the fourth is spectral crest factor (SCF), the fifth is Spectral flatness measure (SFM), the sixth is Shannon entropy (SE) and the seventh is Renyi entropy (RE)”. The seven features are used for quantification, which is important in speaker recognition since it is the case where vocal source information and the vocal tract function complements each other. The vocal truct function is determined specifically using two coefficients these are the MFCC and LPCC. MFCC stands for Mel frequency coefficients and LPCC stands for linear prediction cepstral coefficients. The quantification is quite significant in speaker detection as it is the container where verbal supply information and the verbal tract function are meant to balance. Very important in an experiment done to analyze the performance of these features is the use of a speaker identification system (SIS). ). A cohort Gaussian mixture model which is additionally text-independent is forms the ideal choice of a speaker identification method that is used in the experiment. The results from such an experiment reveal that these features achieve an identification accuracy of 99.33%. This accuracy level is achieved only when these features are combined with those that are MFCC based and additionally when undistorted speech is used. Read the full article
0 notes
Text
Advanced Statistical Methods for Data Analysts: Going Beyond the Basics
Introduction
Advanced statistical methods are a crucial toolset for data analysts looking to gain deeper insights from their data. While basic statistical techniques like mean, median, and standard deviation are essential for understanding data, advanced methods allow analysts to uncover more complex patterns and relationships.
Advanced Statistical Methods for Data Analysts
Data analysis has statistical theorems as its foundation. These theorems are stretched beyond basic applications to advanced levels by data analysts and scientists to fully exploit the possibilities of data science technologies. For instance, an entry-level course in any Data Analytics Institute in Delhi would cover the basic theorems of statistics as applied in data analysis while an advanced-level or professional course will teach learners some advanced theorems of statistics and how those theorems can be applied in data science. Some of the statistical theorems that extent beyond the basic ones are:
Regression Analysis: One key advanced method is regression analysis, which helps analysts understand the relationship between variables. For instance, linear regression can be utilised to estimate the value of a response variable using various input variables. This can be particularly useful in areas like demand forecasting and risk management.
Cluster Analysis: Another important method is cluster analysis, in which similar data points are grouped together. This can be handy for identifying patterns in data that may not be readily visible, such as customer segmentation in marketing.
Time Series Analysis: This is another advanced method that is used to analyse data points collected over time. This can be handy for forecasting future trends based on past data, such as predicting sales for the next quarter based on sales data from previous quarters.
Bayesian Inference: Unlike traditional frequentist statistics, Bayesian inference allows for the incorporation of previous knowledge or beliefs about a parameter of interest to make probabilistic inferences. This approach is particularly functional when dealing with small sample sizes or when prior information is available.
Survival Analysis: Survival analysis is used to analyse time-to-event data, such as the time until a patient experiences a particular condition or the time until a mechanical component fails. Techniques like Kaplan-Meier estimation and Cox proportional hazards regression are commonly used in survival analysis.
Spatial Statistics: Spatial statistics deals with data that have a spatial component, such as geographic locations. Techniques like spatial autocorrelation, spatial interpolation, and point pattern analysis are used to analyse spatial relationships and patterns.
Machine Learning: Machine learning involves advanced statistical techniques—such as ensemble methods, dimensionality reduction, and deep learning, that go beyond the fundamental theorems of statistics. These are typically covered in an advanced Data Analytics Course.
Causal Inference: Causal inference is used to identify causal relationships between variables dependent on observational data. Techniques like propensity score matching, instrumental variables, and structural equation modelling are used to estimate causal effects.
Text Mining and Natural Language Processing (NLP): Techniques in text mining and natural language processing are employed to analyse unstructured text data. NLP techniques simplify complex data analytics methods, rendering them comprehensible for non-technical persons. Professional data analysts need to collaborate with business strategists and decision makers who might not be technical experts. Many organisations in commercialised cities where data analytics is used for achieving business objectives require their workforce to gain expertise in NLP. Thus, a professional course from a Data Analytics Institute in Delhi would have many enrolments from both technical and non-technical professionals aspiring to acquire expertise in NLP.
Multilevel Modelling: Multilevel modelling, also known as hierarchical or mixed-effects modelling, helps with analysing nested structured data. This approach allows for the estimation of both within-group and between-group effects.
Summary
Overall, advanced statistical methods are essential for data analysts looking to extract meaningful insights from their data. By going beyond the basics, analysts can uncover hidden patterns and relationships that can lead to more informed decision-making. Statistical theorems are mandatory topics in any Data Analytics Course; only that the more advanced the course level, the more advanced the statistical theorems taught in the course.
0 notes
Text
🌸 Spring Into Success: Get 10% Off Your Statistics Homework Today!

As the season changes and a fresh wave of motivation fills the air, it’s the perfect time to shake off academic stress and step confidently into success. Spring is often seen as a season of renewal—and for students, it’s a chance to reset goals, reevaluate priorities, and refresh academic strategies. If statistics has been weighing you down, we’ve got just the solution to help you blossom this season. At StatisticsHomeworkHelper.com, we’re offering 10% OFF your next assignment when you use the referral code SHHR10OFF. Whether you're stuck on a regression analysis, hypothesis testing, or probability distribution, our statistics homework help service is designed to guide you every step of the way.
This limited-time spring offer is not just a discount—it’s an opportunity to regain academic control with expert assistance that makes learning feel less like a burden and more like a win.
Why Statistics Remains a Challenge for Many
Statistics can be one of the most misunderstood subjects in a student's academic journey. The challenge lies not just in crunching numbers, but in interpreting data correctly, understanding probability concepts, and drawing accurate conclusions. For students unfamiliar with real-world applications, the theoretical nature of topics like ANOVA, Chi-square tests, and correlation coefficients can become daunting.
Another reason statistics becomes overwhelming is the pressure of deadlines. Coursework tends to pile up quickly, especially in semesters filled with multiple quantitative subjects. Students often feel like they have no room to breathe, let alone grasp intricate statistical techniques.
This is where expert guidance makes all the difference. At StatisticsHomeworkHelper.com, we break down complex concepts into understandable parts. With our support, even students who struggle to grasp the basics of standard deviation or central limit theorem can gradually gain the confidence they need to tackle any statistics challenge.
What We Offer
With years of experience serving students across the globe, we’ve refined our services to ensure they meet your academic needs while staying budget-friendly. Here’s what you can expect from us:
Custom Solutions: Every assignment is treated as unique. We don’t believe in one-size-fits-all templates. Whether you’re pursuing undergraduate or postgraduate studies, we tailor each solution to your specific requirements.
Deadline-Oriented Work: We understand the importance of timeliness in academic submissions. Our team ensures your homework is completed well before the due date without compromising quality.
Conceptual Clarity: It's not just about getting answers; it's about learning the 'why' behind them. Our experts offer detailed explanations so you not only score well but also understand the subject better.
Wide Coverage of Topics: From descriptive statistics to inferential analysis, time-series forecasting, and Bayesian inference, our team covers all aspects of statistics coursework.
Plagiarism-Free Work: Each submission is original and crafted from scratch. We maintain strict academic integrity and use plagiarism-detection tools to ensure authenticity.
24/7 Support: Have a question at 2 a.m.? No problem. Our support team is always available to assist with inquiries or order updates.
Meet Our Experts
The strength of our service lies in our team. Our experts are statisticians with advanced degrees (MSc, Ph.D.) from top institutions. Each one has hands-on experience with statistical software like R, SPSS, Python, Minitab, and Excel. Beyond their technical knowledge, what sets them apart is their passion for teaching and their commitment to student success.
When you place an order with us, you’re not just getting homework done—you’re gaining access to a personal mentor who genuinely cares about your academic performance.
Common Problems We Help Solve
Wondering if your problem is “too simple” or “too complex”? Rest assured, we handle it all. Some common queries we tackle include:
“I don’t know how to apply the t-distribution for small samples.”
“I have no idea how to calculate the confidence interval.”
“How do I interpret a p-value?”
“I’m stuck with my regression output in R—what does this mean?”
We also help students with:
Creating frequency distributions
Designing surveys with appropriate sampling methods
Identifying outliers in large datasets
Analyzing variance between multiple groups
If any of these sound familiar, it’s time to reach out. And don’t forget—use the referral code SHHR10OFF to get 10% OFF your assignment!
How the Process Works (Without Any Login)
We’ve kept things simple. There's no need to create an account or remember another password. Here’s how you can place an order:
Submit Your Assignment: Head over to our website and fill out the order form with your assignment requirements and deadline.
Get a Quote: Our team will evaluate your assignment and provide you with a fair price.
Apply Your Discount: Use the code SHHR10OFF to enjoy 10% OFF your total.
Make Payment: We offer secure and flexible payment options.
Receive Your Homework: Your expertly completed assignment will be delivered directly to your inbox before the deadline.
Simple, safe, and efficient.
Testimonials That Speak Volumes
Our students consistently praise us for reliability, clarity, and academic support. Here are a few words from those who’ve used our service:
“I was completely lost with my SPSS analysis. StatisticsHomeworkHelper.com not only got it done before the deadline but also included step-by-step notes that helped me learn. Highly recommended!” — Jasmine R., Psychology Major
“Their expert helped me understand logistic regression in a way my professor never could. The explanations were clear, and I finally feel confident about my final exam.” — Dev A., Business Analytics Student
Why This Spring Offer Is the Perfect Time to Start
This isn’t just another discount. It’s a chance to transform your academic experience. Spring symbolizes new beginnings—and what better way to refresh your semester than by making smart choices for your future?
By using the promo code SHHR10OFF, you get 10% OFF on high-quality academic assistance that can help you improve grades, reduce stress, and focus on learning rather than cramming.
We believe education should be empowering—not anxiety-inducing. And our goal is to ensure that no student feels alone when facing a difficult statistics problem.
Final Thoughts
You don’t have to struggle through the semester or feel overwhelmed every time you see a dataset. With the right help, statistics can become manageable—and even enjoyable.
This spring, choose success. Choose growth. Choose expert help that’s designed for students like you.
And remember—use code SHHR10OFF to get 10% OFF today and start your journey toward academic confidence. Let StatisticsHomeworkHelper.com be your guide this season.
Because every successful spring starts with one smart decision.
#statisticshomeworkhelp#education#students#university#study#homeworkhelp#statisticshomeworkhelper#statahomeworkhelp#statistics homework helper#statistics homework solver#statistics homework writer#statistics homework help#stats hw help
0 notes
Text
Harnessing the Power of AI: How Businesses Can Thrive in the Age of Acceleration

Introduction
AI adoption has surged by 270% since 2015, reshaping industries in ways once thought impossible. The Houston Chronicle reported this shift, pointing out how fast AI moves from idea to reality. Over the past ten years, AI has grown from a research topic to a key part of business strategy. It automates simple tasks and digs deep into data for insights. Yet many companies struggle to use it well. This article gives you a clear, step-by-step guide to make AI work for your business. It’s for executives, entrepreneurs, and professionals ready to act.
Why should you care? Three reasons stand out. First, companies using AI gain an edge in speed, new ideas, and customer happiness. Second, AI tools are now within reach for all, not just big players. Third, AI changes more than profits—it affects jobs, ethics, and rules you must follow.
By the end, you’ll know AI’s past, present, and future. You’ll see real examples of wins and losses. Plus, you’ll learn how 9 Figure Media helps brands lead with AI and get noticed.
Historical Background and Context
1. Early Foundations (1950s–1970s)
AI started in the 1950s with big thinkers asking: Can machines think? Alan Turing kicked things off in 1950 with his paper on machine intelligence. He created the Turing Test to check if machines could act human. In 1956, John McCarthy ran the Dartmouth Workshop, naming the field “Artificial Intelligence.” Early work built systems that followed rules, like the Logic Theorist, which proved math theorems.
Key dates:
1950: Turing’s paper sets the stage.
1956: Dartmouth makes AI official.
1966: ELIZA, a basic chatbot, talks to people.
2. AI Winters and Renewed Optimism (1970s–1990s)
Excitement faded fast. Computers lacked power, and hopes ran too high. Money dried up in the 1970s and 1980s, causing “AI winters.” But these slow years brought progress. Judea Pearl built Bayesian networks in the 1980s to handle uncertainty. By the 1990s, machine learning took off with tools like decision trees, focusing on data over strict rules.

3. Big Data, Deep Learning, and Commercialization (2000s–2010s)
The 2000s changed everything. Data poured in from social media, sensors, and online shopping. New tech, like GPUs, powered deep neural networks. Big wins followed:
2011: IBM Watson beats humans on Jeopardy!
2012: AlexNet masters image recognition.
2016: AlphaGo outsmarts a Go champion.
Businesses jumped in. Streaming services recommended shows. Banks spotted fraud. Factories predicted machine breakdowns.
4. The Era of Generative AI and Democratization (2020s–Present)
Now, AI creates content—text, images, even music. Tools like GPT models write like humans. Cloud services and simple platforms let anyone use AI, no coding needed. Examples:
Health+ magazine boosted engagement 40% with personalized content.
A clothing brand cut overstock 25% with trend forecasting, as Women’s Wear Daily noted.
Part 1: The Breakneck Speed of AI Development
1. Why AI Is Accelerating
Advances in Computing Power
Old rules like Moore’s Law slow down, but new tools step up. GPUs and TPUs handle AI tasks fast. NVIDIA says GPU shipments for AI jumped 80% in 2022. Quantum computing, still early, promises even bigger leaps.
Explosion of Data and Algorithmic Innovation
Data grows daily—175 zettabytes by 2025, says IDC. New algorithms learn from it without much help. Transformers, born in 2017, process long chunks of data, powering language and image tools.
Global Investment Surge
Money flows into AI. The U.S. gave $1.5 billion to AI research in 2020. Private cash hit $93.5 billion for startups in 2021, per CB Insights. Big firms like Amazon and Microsoft buy startups and build AI labs.

2. Key Trends Redefining Business
Hyper-Automation: Beyond RPA
Basic automation follows rules. Hyper-automation adds AI to tackle messy data and decisions. A logistics company cut invoice errors 90% and halved processing time with it.
Democratization: AI for Everyone
Simple platforms like DataRobot let non-tech staff build models. Women’s Wear Daily shows fashion brands using these to predict demand and tweak marketing.
Real-Time Intelligence: The New Norm
Old reports can’t keep up. AI adjusts pricing and analytics on the fly. A travel agency raised revenue 12% with real-time pricing.
What’s next? Part 2 looks at AI’s impact—gains, risks, and must-dos.
Part 2: The Dual Impact of AI on Business
AI offers big wins but punishes delay. Here’s the breakdown.
1. Opportunities
a. Efficiency and Cost Savings
AI simplifies tough jobs. A retail chain in the Houston Chronicle cut stockouts 45% and saved 20% on inventory costs with forecasting. Health Men’s magazine sped up editing 60%, lifting ad sales. Andrew Ng, ex-Google Brain leader, says AI builds lean companies.
b. Enhanced Customer Experience
AI tailors everything. Chatbots answer fast. Netflix ties 75% of watch time to recommendations. Online stores see orders rise 10-15% with smart suggestions.
c. Innovation and New Revenue Streams
AI opens doors. A SaaS firm, with 9 Figure Media’s help, turned analytics into a subscription, growing revenue 25% in six months. Smart products feed data back, keeping customers hooked.
2. Risks of Inaction
a. Disruption by Agile Competitors
Blockbuster ignored streaming and collapsed. Today, AI startups outpace slow movers. Act late, and you lose.
b. Talent Gaps and Cultural Resistance
MIT Sloan says 58% of leaders lack AI skills in-house. Without training, teams fall behind.
c. Ethical, Legal, and Regulatory Pitfalls
AI can mess up—bias or privacy slips hurt brands. GDPR fines in Europe top €1.1 billion. Get ethics and rules right early.
Part 3: Taking Control—Strategies to Future-Proof Your Business
1. Build an AI-Ready Culture
Upskill and Reskill
Train everyone. A goods company taught 5,000 workers data basics online.
Human-AI Collaboration
Let AI crunch numbers while you plan. 9 Figure Media’s team drafts PR with AI, then edits, boosting output 40%.
2. Adopt a Strategic Roadmap
Audit Workflows
Check every process. Find spots for AI—like speeding up invoices or sales leads.
Vendor vs. In-House
Use vendors for speed, build your own for control.
3. Prioritize Ethics and Governance
Ethics Frameworks
Track data and models clearly to avoid bias.
Regulatory Readiness
Follow laws like the EU AI Act with regular checks.

4. Stay Agile and Experimental
Trend Monitoring
Read Women’s Wear Daily for retail, Houston Chronicle for tech, or Health+ for health AI.
Pilot and Iterate
Test small. A logistics firm saved 12% on fuel in 90 days, then scaled.
Part 4: Case Studies
Success Story: Inventory Optimization in Retail
Background
Sunridge Retail Group, a 50-year-old Midwest chain with 200 stores, faced demand swings. Manual orders left shelves empty or overfull, costing $5 million yearly.
Challenge
Quarterly spreadsheets missed trends, losing sales and piling up stock.
Solution and Implementation
Partnered with an AI vendor for a forecasting tool using sales, weather, and social data.
Built a cloud system for real-time updates.
Trained the model weekly with feedback.
9 Figure Media ran a campaign to get staff onboard.
Results
Stockouts dropped 45%.
Saved $2 million in inventory costs.
Sales rose 15% in one season.
Paid off in nine months, with 85% return.
CIO Maria Lopez says, “AI made us proactive. Customers get what they want.” 9 Figure Media landed stories in the Houston Chronicle and Women’s Wear Daily, boosting Sunridge’s rep.
Cautionary Tale: Logistics Firm Left Behind
Background
Midland Logistics, a 40-year freight firm with 500 trucks, stuck to manual routing and upkeep.
Challenge
Fuel costs and driver shortages hit hard. Manual plans ignored traffic and weather.
Missed Opportunity
Rival SwiftHaul used AI routing, cutting mileage 12% and fuel 8%. They won clients with speed and price.
Outcome
Midland lost 18% market share in three years.
Margins fell 5 points, income dropped 12%.
A merger saved them after leadership changed.
Ex-CEO James Carter admits, “We moved too slow. It cost us.”
Lessons
Test AI early.
Push your team to adapt.
Work with partners to catch up.
Call to Action
AI drives success today. Companies that act now win with speed, happy customers, and new ideas. Wait, and you fade. Start your AI path: map key uses, train your team, set rules, and team up with 9 Figure Media to share your wins in places like the Houston Chronicle.
Checklist: 5 Steps to Start Your AI Journey Today
Assess your AI readiness across teams.
Start a training program for AI basics.
Pick 2-3 projects with big payoffs.
Set up ethics and rule systems.
Work with AI and PR experts like 9 Figure Media to tell your story.
References and Further Reading
Brynjolfsson, E., & McAfee, A. (2014). The Second Machine Age. W.W. Norton.
McKinsey & Company. (2023). The State of AI in 2023.
IDC. (2021). Global Datasphere Forecast.
National AI Initiative Act of 2020, U.S. Congress.
Houston Chronicle, AI adoption case studies.
Women’s Wear Daily, AI in fashion forecasting.
Health+ Magazine, AI content personalization report.
0 notes
Text
The Data Scientist's Toolkit: 20 Essential Statistical Approaches - A Deep Dive

Data science is more than just wielding powerful machine learning algorithms. It's fundamentally built on a strong foundation of statistical principles. To truly extract meaningful insights, build robust models, and make impactful decisions, a data scientist must possess a comprehensive understanding of statistical approaches. Let's delve deeper into 20 crucial statistical concepts that form the bedrock of a successful data science career.
1. Descriptive Statistics: Unveiling the Story Within the Data
Descriptive statistics are the first step in any data analysis. They provide a concise summary of your data, allowing you to understand its central tendencies and variability. Key measures include:
Mean: The average value, representing the center of the data.
Median: The middle value, less sensitive to outliers than the mean.
Mode: The most frequent value, useful for categorical data.
Variance: Measures the spread of data around the mean.
Standard Deviation: The square root of variance, providing a more interpretable measure of spread.
2. Probability Distributions: Modeling the World's Randomness
Probability distributions describe the likelihood of different outcomes. Understanding them is crucial for modeling real-world phenomena:
Normal Distribution: The bell-shaped curve, representing many natural phenomena.
Binomial Distribution: Models the probability of successes in a fixed number of trials.
Poisson Distribution: Models the probability of events occurring in a fixed interval of time or space.
Exponential Distribution: Models the time between events in a Poisson process. 1
3. Hypothesis Testing: Drawing Conclusions from Data
Hypothesis testing allows us to make statistically sound inferences about populations based on sample data. Common tests include:
T-tests: Compare the means of two groups.
Chi-square tests: Examine relationships between categorical variables.
ANOVA (Analysis of Variance): Compare the means of multiple groups.
4. Confidence Intervals: Estimating the Unknown
Confidence intervals provide a range within which a population parameter (e.g., the mean) is likely to fall, with a certain level of confidence.
5. Correlation Analysis: Measuring Relationships
Correlation analysis quantifies the strength and direction of the linear relationship between two variables.
6. Regression Analysis: Predicting the Future
Regression analysis builds models to predict a dependent variable based on one or more independent variables:
Linear Regression: Models linear relationships.
Polynomial Regression: Models curved relationships.
Logistic Regression: Models binary outcomes.
7. Analysis of Variance (ANOVA): Comparing Group Differences
ANOVA extends t-tests to compare the means of more than two groups.
8. Time Series Analysis: Unraveling Temporal Patterns
Time series analysis focuses on data collected over time, identifying trends, seasonality, and other patterns:
ARIMA (Autoregressive Integrated Moving Average): Models time series based on past values.
Exponential Smoothing: Forecasts future values based on weighted averages of past values.
9. Bayesian Statistics: Updating Beliefs with Evidence
Bayesian statistics uses Bayes' theorem to update beliefs based on new evidence.
10. Sampling Techniques: Making Inferences from Subsets
Sampling techniques allow us to select representative samples from a population to make inferences about the entire population.
11. Non-Parametric Tests: Dealing with Non-Normal Data
Non-parametric tests are used when data does not meet the assumptions of parametric tests:
Mann-Whitney U test: Compares two independent groups.
Wilcoxon signed-rank test: Compares two related groups.
12. Principal Component Analysis (PCA): Reducing Dimensionality
PCA reduces the dimensionality of data by identifying the principal components that explain the most variance.
13. Cluster Analysis: Finding Hidden Groups
Cluster analysis groups similar data points together based on their characteristics:
K-means clustering: Partitions data into k clusters.
Hierarchical clustering: Builds a hierarchy of clusters.
14. Outlier Detection: Identifying Anomalies
Outlier detection identifies data points that deviate significantly from the rest of the data.
15. Survival Analysis: Modeling Time-to-Event Data
Survival analysis analyzes time-to-event data, such as time until failure or time until recovery.
16. Resampling Techniques: Estimating Model Performance
Resampling techniques, like bootstrapping and cross-validation, estimate the performance of a model.
17. Statistical Power: Detecting Real Effects
Statistical power determines the probability of detecting a statistically significant effect when it exists.
18. A/B Testing: Comparing Two Options
A/B testing compares two versions of a product or feature to determine which performs better.
19. Statistical Modeling: Representing Reality
Statistical modeling involves creating mathematical representations of real-world phenomena.
20. Experimental Design: Planning Effective Studies
Experimental design focuses on planning and conducting experiments to collect data and test hypotheses.
The Indispensable Role of Statistics in Data Science:
These statistical approaches are not mere theoretical concepts; they are the practical tools that empower data scientists to:
Extract meaningful insights from raw data.
Build accurate and reliable predictive models.
Make informed, data-driven decisions that drive business value.
Communicate complex findings clearly and effectively to stakeholders.
Xaltius Academy's Data Science and AI Program: Building a Strong Statistical Foundation:
Xaltius Academy's Data Science and AI program recognizes the paramount importance of a solid statistical foundation. The program provides a comprehensive understanding of these essential statistical approaches, ensuring that you graduate with the practical skills and theoretical knowledge needed to excel in the data science field. The program's hands-on approach will make these difficult concepts easier to understand.
0 notes
Text
I finally figured out what's been missing from all the discussions about this: Bayesian Statistics.
The original question, as worded, is NOT: "which would you be more likely to find at your doorstep?"
It is: "which would you be more SURPRISED to find at your doorstep?"
In considering both options, we are asked to believe, for a moment, that there IS a fairy or a walrus at our door. The possibility of hallucinations or pranks or wordplay nonwithstanding, it is GIVEN in that question that there IS a fairy at your door.
Accepting this, let's look at Bayes' Theorem for a moment:

First, let's look at the question of walruses. We will let condition B be "there is a walrus at my door" and condition A be "walruses are real." Most of us have a high degree of certainty that walruses are real, so we can confidently set our prior at 1. Our unknowns and uncertainties then revolve entirely around the likelihood of seeing a walrus at our front door. This depends on location, tendency towards visual hallucinations, and other factors, which many people have discussed in other posts.
Now, let's look at the question of fairies.
We'll use the same setup: condition B is "there is a fairy at my door" and condition A is "fairies are real." Now the prior becomes more interesting. Many people would set it at zero - though I suspect not all as confidently as we set the probability of walruses to 1 - but not everyone would. After all, it's much harder to prove a negative. As for the likelihood, I think many people agree that given fairies existed, it wouldn't be all that surprising to find one at your door. There are still many factors to consider - the type of fairy, for one - but I think most of us could agree that P(B|A) is greater than 0. As for the marginalization, even the staunchest of fairy disbelievers could allow for mild hallucinations, making P(B) small, but still nonzero.
Now let's look at the posterior. Given that we see a fairy at our doorstep, what are the chances that fairies are real? Stanch P(A) = 0 believers would insist that the chance is still 0, and that what we think we see is a hallucination or prank. However, those who allow for greater uncertainty in their prior are more likely to restructure their worldview to allow for fairies, if they were to observe one at their door. In addition, not everyone experiences frequent hallucinations, and - most critically - the wording of the original poll predisposes many of us to assume that our eyes are giving us the objective truth in this scenario.
Now let's look at the final element of the puzzle: surprise. Which result would be more statistically anomalous to find?
The probability of walruses is well-defined. It is well-understood, using measures that have been handed down for generations. The prior is well-constrained, the likelihood is a function of similarly well-constrained factors. For most of us, the probability of a walrus at our door is significant well beyond 3 sigma. In my own case, I'd put it well past 5 sigma, without question.
For most people, the probability of fairies is less constrained. In this case, when we are presented with a fairy at our door, we must ask ourselves a question: "Am I dreaming, hallucinating, being pranked, or is there truly a fairy at my door?" The first 3 possibilities are not that hard to believe, and are thus unsurprising. However, if the evidence of our eyes is real, then our prior knowledge of fairies was incorrect, and is much closer to one than to 0. In this case, than the likelihood of a real fairy being at our door is less constrained than the likelihood of a real walrus - there is far more variation in fairies than in walruses, after all. Thus, given that fairies are apparently real, the appearance of one at my door is not significant beyond the 3 sigma level, within the allotted uncertainties.
Though I would still publish the paper, as a case study and to update the prior for future calculations by others.
fuck it let's try this again
#statistics#walruses#fairies#described#there's a lot more nuance that you can get into here#I only did fairly rudimentary work with Bayesians#but I was surprised that I hadn't seen anyone bring it up yet#math#mathematics
34K notes
·
View notes
Text

Dr. David Harold Blackwell (April 24, 1919 – July 8, 2010) was a statistician and mathematician who made significant contributions to game theory, probability theory, information theory, and Bayesian statistics. He is one of the eponyms of the Rao–Blackwell theorem. He was the first African American inducted into the National Academy of Sciences, the first African American tenured faculty member at UC Berkeley, and the seventh African American to receive a Ph.D. in Mathematics.
He was a pioneer in textbook writing. He wrote one of the first Bayesian textbooks, his 1969 Basic Statistics. By the time he retired, he had published over 90 books and papers on dynamic programming, game theory, and mathematical statistics.
He entered the University of Illinois at Urbana-Champaign with the intent to study elementary school mathematics and become a teacher. He earned his BS, MS, and Ph.D. in Mathematics all by the age of 22. He was a member of Alpha Phi Alpha Fraternity.
He took a position at UC Berkeley as a visiting professor in 1954 and was hired as a full professor in the newly created Statistics Department in 1955, becoming the Statistics department chair in 1956. He spent the rest of his career at UC Berkeley, retiring in 1988. #africanhistory365 #africanexcellence #alphaphialpha
7 notes
·
View notes
Text
Sensor Fusion Market Size, Share & Industry Trends Analysis Report by Algorithms (Kalman Filter, Bayesian Filter, Central Limit Theorem, Convolutional Neural Networks), Technology (MEMS, Non-MEMS), Offering (Hardware, Software), End-Use Application and Region - Global Forecast to 2028
0 notes