#datagaps
Explore tagged Tumblr posts
Visit Tumblr Blog
Explore Tumblr blogs with no restrictions, modern design and the best experience.
Last Seen Tumblr Blogs


Fun Fact
The most popular pages on Tumblr are about Minecraft, GIFs, and David J. Peterson.
Text
Automate Tableau Regression Testing with Datagaps BI Validator
Introduction
In today's data-driven world, the accuracy and reliability of business intelligence (BI) reports are paramount. As Tableau gains prominence for visualizing data, ensuring the integrity of these reports through effective regression testing becomes increasingly critical.
Challenges of Tableau Regression Testing
Tableau users often grapple with several challenges during regression testing. Issues such as handling complex data volumes, managing frequent updates, ensuring visualization accuracy, and maintaining consistent performance metrics pose significant hurdles.
Datagaps BI Validator: Your Solution
Enter Datagaps BI Validator—a robust tool tailored to streamline and enhance Tableau regression testing processes. From data comparison and UI consistency checks to comprehensive validation across multiple environments, BI Validator empowers organizations to maintain data accuracy effortlessly.
Key Features and Benefits
Automated Comparison: Automatically compare Tableau worksheet data and UI elements to detect discrepancies.
Detailed Reporting: Generate comprehensive reports with visual indicators to pinpoint changes between versions.
Integration and Automation: Seamlessly integrate with CI/CD pipelines for continuous testing and validation.
Comprehensive Validation: Validate data integrity, calculations, and visualizations across different Tableau environments.
Proactive Issue Detection: Receive alerts and notifications to promptly address discrepancies, ensuring data quality.
Expertise and Support: Leverage Datagaps' expertise in BI validation for unmatched accuracy and reliability.
Conclusion
Datagaps BI Validator empowers organizations to conquer Tableau regression testing challenges efficiently. By automating processes and providing actionable insights, BI Validator ensures that Tableau reports are always accurate, reliable, and up-to-date. Take charge of your data integrity with Datagaps BI Validator today.
Referred by Datagaps
#DataOpsSuiteBIValidator
Request a demo today
Demo: https://www.datagaps.com/request-a-demo/#utm_source=youtube&utm_medium=yt_video&utm_campaign=yt_request_demo&utm_id=yt_request_demo
#BI #PowerBI #BIValidator #Tableau #Datagaps
2 notes
·
View notes
Text
🎉 Congratulations to Keerthi for getting placed as a Devops Engineer at #DATAGAPS 🎯 Your dedication & hard work have paid off! Wishing you continued success in your career! 👏 💡 At Naresh i Technologies, we provide: ✅ Industry-focused training ✅ Weekly Assignments ✅ Mock interviews & HR support ✅ Placement Assistance 🎯 Tag a friend who should start their journey with us! ❤️ Follow Us For More : https://www.instagram.com/nareshitech
0 notes
Text
Canada in the Dark

“Last summer, The Globe embarked on an effort to understand the scale of the problem and what it means for society. We started calling people up: dozens of social scientists, business executives, non-profit organizations, ordinary citizens, medical patients and activists, along with past and present insiders at Statistics Canada, the country’s main data-gathering agency. We studied the public-data regimes of countries from the United States to Germany to New Zealand. We pored over Canadian government reports on federal data policy and over scores of Statscan data sets – many of which include the acknowledgment that they were discontinued years ago.”
“What we found out became our series, Canada in the dark. We learned that Canadian society has no way of answering key questions about itself, in fields ranging from energy and the environment to the condition of seniors in nursing homes. Often these are basic questions – about such things as gasoline sales or mortality rates – that our peer countries can answer with ease. We learned that these gaps are costing the Canadian economy money, and have very likely cost people their lives.”
“In the coming months, we will be publishing more than a dozen stories by Globe reporters looking at dangerous and expensive data gaps in health, housing, domestic violence, the labour force, organized crime and more.”
The Globe and Mail, January 26, 2019:”Flying blind: Why does Canada know so little about itself?” by Eric Andrew-Gee and Tavia Grant
What we don’t know...
“Consider that we don’t have a clear national picture of the vaccination rate in particular towns and cities. We don’t know the Canadian marriage or divorce rate. We don’t know how much drug makers pay the Canadian doctors who are charged with prescribing their products. We don’t have detailed data on the level of lead in Canadian children’s blood. We don’t know the rate at which Canadian workers get injured. We don’t know the number of people who are evicted from their homes. We don’t even know how far Canadians drive – a seeming bit of trivia that can tell us about an economy’s animal spirits, as well as the bite that green policies are having.”
“Our ignorance is decades in the making, with causes that cut to the heart of Canada’s identity as a country: provincial responsibility for health and education that keeps important information stuck in silos and provides little incentive for provinces to keep easily comparable numbers about themselves; a zeal for protecting personal privacy on the part of our statistical authorities that shades into paranoia; a level of complacency about the scale of our problems that keeps us from demanding transparency and action from government; and a squeamishness about race and class that prevents us from finding out all we could about disparities between the privileged and the poor.“
The Globe and Mail, January 26, 2019: “In the dark: The cost of Canada’s data deficit,” by Eric Andrew-Gee and Tavia Grant
Missing data
“Statscan’s cavalier approach to preserving data extended to the agency’s most basic functions. Some parts of past censuses and other reports are simply gone, either because files have gone missing, been accidentally shredded or dumped, or have just physically deteriorated. These include bits of the 1961 census – not just a historical relic but a cache of valuable data for researchers looking at long-term trends.“
The Globe and Mail, January 26, 2019: “What went wrong at Statscan? A history of secrecy, small-time thinking and statistics,” by Tavia Grant and Eric Andrew-Gee
0 notes
Text
0 notes
Text
Data Validation Testing
At a recent TDWI virtual summit on “Data Integration and Data Quality”, I attended a session titled “Continuous Data Validation: Five Best Practices” by Andrew Cardno.
In this session, Andrew Cardno, one of the adjunct faculty at TDWI talked about the importance of validating data from the whole to the part, which means that the metrics or total should be validated before reconciling the detailed data or drill-downs. For example, revenue totals by product type should be the same in Finance, CRM, and Reporting systems.
Attending this talk reminded me of a Data Warehouse project I worked on at one of the federal agencies. The source system was a Case Management system with a Data Warehouse for reporting. We noticed that one of the key metrics “Number of Cases by Case Type” yielded different results when queried on the source database, the data warehouse, and the reports. Such discrepancies undermine the trust in the reports and the underlying data. The reason for the mismatch can be an unwanted filter or wrong join or error during the ETL process.
When it comes to the federal agency this report is sent to congress and they have a congressional mandate to ensure that the numbers are correct. For other industries such as Healthcare and Financial, compliance requirements require the data to be consistent across multiple systems in the enterprise. It is essential to reconcile the metrics and the underlying data across various systems in the enterprise.
Andrew talks about two primary methods for performing Data Validation testing techniques to help instill trust in the data and analytics.
Glassbox Data Validation Testing
Blackbox Data Validation Testing
I will go over these Data Validation testing techniques in more detail below and explain how the Datagaps DataOps suite can help automate Data Validation testing.
#data validation#data validation testing#Glassbox Data Validation Testing#Blackbox Data Validation Testing
0 notes
Text
ETL Testing Service Market Size 2021 With Top Countries, Competitive Landscape, Industry Development and Revenue Analysis To 2027 by Value Market Research
The global ETL Testing Service Market report contains overall the details analysis based on few parameters like drivers, restraints, competitive analysis, latest trends and opportunities, geographical outlook, and competitive panel for the forecast timespan of 2021 to 2027. Therefore, these written statements reflect the overall market conditions and various other factors that are associated with the market that will definitely guide concerned parties in making a strategic decision.
The research report also covers the comprehensive profiles of the key players in the market and an in-depth view of the competitive landscape worldwide. The major players in the etl testing service market include 99 Percentage, Guru99, QualiTest, Codoid, RTTS, Infosys, Outsource2india, Flatworld Solutions, Datagaps, QA Mentor, QuerySurge and Others. This section consists of a holistic view of the competitive landscape that includes various strategic developments such as key mergers & acquisitions, future capacities, partnerships, financial overviews, collaborations, new product developments, new product launches, and other developments.
Get more information on "Global ETL Testing Service Market Research Report" by requesting FREE Sample Copy at
https://www.valuemarketresearch.com/contact/etl-testing-service-market/download-sample
0 notes
Text
Closing our data gap will be good for our health
To ignore the numbers is to ignore patients' wellbeing
André Picard, The Globe and Mail
January 28, 2019
“Know your numbers” is a common admonition for patients with conditions such as heart disease, diabetes and prostate cancer. Tracking your blood pressure, hemoglobin A1C or prostate-specific antigen is a practical way of monitoring your health and preventing complications.
“Know your numbers” is also pretty sound advice for clinicians, institutions and health systems writ large. If you don’t track the needs of patients, the way they are treated and their outcomes, it’s hard to imagine how you can provide effective or cost-efficient care.
Yet, as an important new Globe and Mail series underscores, access to data is abysmal in Canada. And nowhere is the data gap more glaring and more harmful than in our publicly-funded health care system.
We do a much better job of tracking how we die than how we live.
For example, we don’t have a good handle on how many children have been vaccinated and, more importantly, where those who have not been vaccinated live and go to school. We know a lot of people are waiting for a spot in nursing homes and long-term care homes, but we don’t really know how many people are living in those facilities currently, whether they need to be there, and whether they are getting appropriate care.
Heck, we don’t even have commonly accepted terminology: Around the country these residential care facilities have names such as lodges, assisted living, supportive housing, personal care homes, nursing homes and long-term care facilities.
If you don’t know the numbers, or if the numbers are not comparable, you can’t implement sound public policies. With the era of Big Data looming large, Canada’s health care data gap risks becoming a deadly chasm.
Big Data is a popular buzzword but what it means, quite simply, is using large data sets to reveal patterns, trends and associations, and then using the information for policy purposes. This sort of predictive analysis should improve access, reduce harm, and cut costs.
For example, hospitals in Paris used a decade’s worth of admission records to create an algorithm that makes daily and hourly predictions of how many patients are expected at each hospital, and staffing is adjusted accordingly to avoid long waits and overcrowding.
Big Data is also expected to revolutionize how we treat conditions such as cancer. Currently, there are recommendations and guidelines for how to treat patients with various sorts of cancer, based largely on clinical trials.
What is lacking is a robust feedback loop. If you can track exactly how each patient is treated – what type of surgery, the chemotherapy drugs, the symptoms, and the recovery times – the data can be used to refine treatment protocols for future patients.
Data tracking is desperately needed in the drug field; last year, Canadians spent $33.7-billion on prescription drugs but we know very little about the effectiveness of those prescriptions.
In the (hopefully-not-too-distant) future, data will be used to drive value-based health care – meaning that providers are paid for outcomes. For example, a drug company would be compensated only if their new drug to cure hepatitis C actually works. The goal of new technology is to produce better outcomes. But these advances are predicated on having good data.
Canada has excellent data-collection agencies in the health field: the Canadian Institute for Health Information, the Institute for Clinical Evaluative Sciences, the BC Centre for Disease Control, and the Manitoba Centre for Health Policy, to name just a few.
But these groups too often have to operate with one hand tied behind their backs because of poor integration of data collection into clinical work, lack of national standards, sub-standard information systems in the provinces, and miserly funding.
In Canada, we also have an unhealthy obsession with privacy. Of course, individual health data should be private and secure. But now, more than ever, collecting data is important not only to our individual health, but to the health of others, so it is essential that we distinguish between privacy and secrecy.
The explosion in data has medical, ethical, legal and policy implications. But a publicly-funded system, if it is going to be patient-centered, has to embrace transparency.
Our disdain for data is actually disdain for patients.
It is also one of the main reasons Canada’s health system ranks poorly in terms of equity, accessibility and cost-efficiency. We need to know our numbers, but must also act on them.
0 notes
Text
ETL Testing Service Market(2020-2027) | Flatworld Solutions, QualiTest, Outsource2india
Latest Global ETL Testing Service Market research report is an in-depth study of the industry including basic structures. This report features market revenue, share, development and market size. Also accentuate ETL Testing Service industry contribution, product picture and provision. It examines a competitive summary of worldwide market forecast between period 2020 to 2025.
The Global ETL Testing Service market report gives information covering market competition, creation, revenue, export, import, supply, utilization, market overview, market examination by applications and market impact factors analysis. These reports are resulting with market intelligence, economy and value. The report offers operational advisory and business intelligence on ‘ETL Testing Service Market’, emphasizing on emerging business models, problematic advancements alongside point of reference investigation and achievement contextual analyses. It additionally covers the demand-supply gap, difficulties and specialty sections in the ecosystem
Get Free Sample Copy for more Professional and Technical insights at: https://www.globalinforeports.com/request-sample/1086022
Leading Players are:
Flatworld Solutions, QualiTest, Outsource2india, Guru99, Infosys, 99 Percentage, Codoid, QA Mentor, RTTS, Datagaps
The ETL Testing Service report uttered an entire view of this market by substituting it when it comes to application as well as region. Trends examines regional segmentation integrates prospective and present requirement for them from the North America, Europe, Asia Pacific, South America, Middle East & Africa. The report covers the major applications of industry in the leading region.
Major Types are:
Data Quality Testing
Data Transformation Testing
Data Accuracy Testing
Data Completeness Testing
Major Applications are:
Small and Medium-sized Enterprises (SMEs)
Large Enterprises
Avail Discount on Report @ https://www.globalinforeports.com/check-discount/1086022
This Report will address some of the most important questions which are listed below:
Which is the main local/country for the development of the market? What is the anticipated growth rate of the leading regions during the forecast period?
What is the market size of the ETL Testing Service market at the worldwide level?
Which mode of distribution channel is most preferred by the manufacturers of ETL Testing Service?
What the key factors driving, inhibiting the growth of the market and what is the degree of impact of the drivers and restraints?
What is the impact of the regulations on the growth of the ETL Testing Service market?
How are the emerging markets for ETL Testing Service expected to act in the coming years?
Who are the major players working in the global ETL Testing Service market? What is the present market position of the key players? Who are the rising players in this industry?
The ETL Testing Service report stipulates economic scenarios with all the thing value, the principal area, benefits, distributions, limitations, creation, petition, market enhancement, and figure and so forth. The ETL Testing Service report introduces speculation attainability evaluation, a task SWOT investigation, and venture yield evaluation.
Have Any Query? Ask Our Industry Experts @ https://www.globalinforeports.com/send-an-enquiry/1086022
Customization of this Report: This ETL Testing Service report could be customized to the customer's requirements. Please contact our sales professional ([email protected]), we will ensure you obtain the report which works for your needs.
0 notes
Text
The Unspoken, Gaps in Data Part 2
In our previous blog we focused more on why gaps can be bad for your systems. Should you need to refresh yourself on these details, please click the relevant link.
There are various different methods on filling gaps in data and there is no right or wrong method of filling gaps, as it is always a compromise. The following methods are just some of the ways you could fill the gaps in data:
· Carry values forward. Meaning you’re taking the previous value and bringing it forward to fill the gap.
· You could use data that was received at the same time. Data from a day, week or year before, and use that to fill the gap.
· Other more complicated methods involve the following. Taking averages of points in previous years for the same point. Or doing more with season + day type averages. Each day has an associated day type (weekend + weekday for a simple example) and season of the year. This allows averages to be built that are more reflective of seasonal variations and usage and are less prone to suffering from the impact of more extreme individual values.
· Back filling data by Interpolation using incrementing data sets. For example, if your incremental counter ended on 100 units at the start of the gap and started on 180 units at the end of the gap that means we used 80 units. And, 80 units is over a 4-day period, so therefore it’s 20 units per day. This we feel to be the most accurate method as the data is there and is accurate as it is actually what has been utilised.
The best position is not to have gaps, but when there is, we created a system that allows us to detect gaps in data before importing it into your own Energy Management Systems; or any other system you may use.
Using MCE (Meniscus Calculation Engine), we extract the data into our systems where the calculations are set up to automatically identify the data. E-mailed Management reports are generated by MCE and the information is sent to you or directly to the Data Collector to ensure that the gaps are filled with the correct data.
If you’re having problems with gaps in your data, give us a call. Let us find a method that works for you.
---------------------------------------------------------------------------------------------------
http://www.meniscus.co.uk/ Meniscus – Delivering data analytics to the connected world
0 notes
Text
Leading Tableau Test Automation Tools — Comparison and Market Leadership
Automated testing for Tableau dashboards and analytics content is a growing niche, with a few specialized commercial tools vying for leadership.
We compare the top solutions — Datagaps BI Validator, Wiiisdom Ops (formerly Kinesis CI), QuerySurge, and others — based on their marketing presence, enterprise adoption, feature set (especially for functional/regression testing), CI/CD integration, and industry reputation.
Datagaps BI Validator (DataOps Suite)
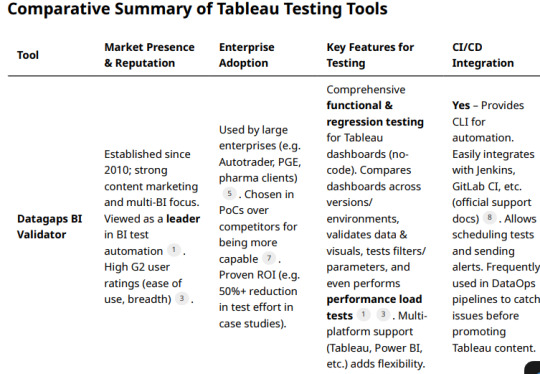
Industry sources describe BI Validator as a “leading no-code BI testing tool” . It has recognition on review platforms; for example, G2 reviewers give the overall Datagaps suite a solid rating (around 4.0–4.6/5) and specifically praise the Tableau-focused module
Industry sources describe BI Validator as a “leading no-code BI testing tool” . It has recognition on review platforms; for example, G2 reviewers give the overall Datagaps suite a solid rating (around 4.0–4.6/5) and specifically praise the Tableau-focused module.
Customer Adoption: BI Validator appears to have broad enterprise adoption. Featured customers include Autotrader, Portland General Electric, and University of California, Davis.
A case study mentions a “Pharma Giant” cutting Tableau upgrade testing time by 55% using BI Validator.
Users on forums often recommend Datagaps; one BI professional who evaluated both Datagaps and Kinesis-CI reported that Datagaps was “more capable” and ultimately their choice . Such feedback indicates a strong reputation for reliability in complex enterprise scenarios.
Feature Set: BI Validator offers end-to-end testing for Tableau covering:
Functional regression testing: It can automatically compare workbook data, visuals, and metadata between versions or environments (e.g. before vs. after a Tableau upgrade) . A user notes it enabled automated regression testing of newly developed Tableau content as well as verifying dashboard outputs during database migrations . It tests dashboards, reports, filters, parameters, even PDF exports for changes.
Data validation: It can retrieve data from Tableau reports and validate against databases. One review specifically highlights using BI Validator to check Tableau report data against the source DB efficiently . The tool supports virtually any data source (“you name the datasource, Datagaps has support for it”
UI and layout testing: The platform can compare UI elements and catalog/metadata across environments to catch broken visuals or missing fields post-migration.
Performance testing: Uniquely, BI Validator can simulate concurrent user loads on Tableau Server to test performance and robustness . This allows stress testing of dashboards under multi-user scenarios, complementing functional tests. (This is analogous to Tableau’s TabJolt, but integrated into one suite.) Users have utilized its performance/stress testing feature to benchmark Tableau with different databases.
Datagaps provides a well-rounded test suite (data accuracy, regression, UI regression, performance) tailored for BI platforms. It is designed to be easy to use (no coding; clean UI) — as one enterprise user noted, the client/server toolset is straightforward to install and navigate.
CI/CD Integration: BI Validator is built with DataOps in mind and integrates with CI/CD pipelines. It offers a command-line interface (CLI) and has documented integration with Jenkins and GitLab CI, enabling automated test execution as part of release pipelines . Test plans can be scheduled and triggered automatically, with email notifications on results . This allows teams to include Tableau report validation in continuous integration flows (for example, running a battery of regression tests whenever a data source or workbook is updated). The ability to run via CLI means it can work with any CI orchestrator (Jenkins, Azure DevOps, etc.), and users have leveraged this to incorporate automated Tableau testing in their DevOps processes.
Wiiisdom Ops (formerly Kinesis CI)
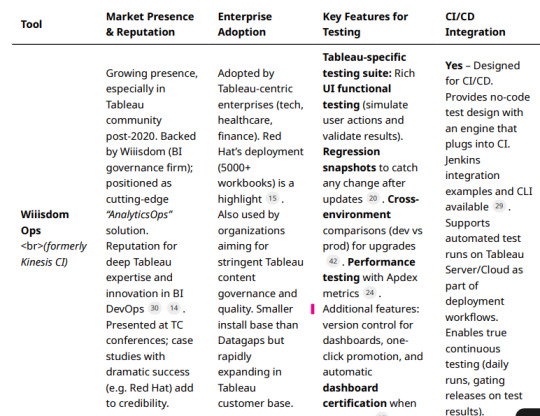
Wiiisdom (known for its 360Suite in the SAP BusinessObjects world) has since rebranded Kinesis CI as Wiiisdom Ops for Tableau and heavily markets it as a cornerstone of “AnalyticsOps” (bringing DevOps practices to analytics).
The product is positioned as a solution to help enterprises “trust their Tableau dashboards” by automating testing and certification . Wiiisdom has been active in promoting this tool via webinars, Tableau Conference sessions, e-books, and case studies — indicating a growing marketing presence especially in the Tableau user community. Wiiisdom Ops/Kinesis has a solid (if more niche) reputation. It’s Tableau-exclusive focus is often viewed as strength in depth.
The acquiring company’s CEO noted that Kinesis-CI was a “best-in-breed” technology and a “game-changer” in how it applied CI/CD concepts to BI testing . While not as widely reviewed on generic software sites, its reputation is bolstered by public success stories: for instance, Red Hat implemented Wiiisdom Ops for Tableau and managed to reduce their dashboard testing time “from days to minutes,” while handling thousands of workbooks and data sources . Such testimonials from large enterprises (Red Hat, and also Gustave Roussy Institute in healthcare ) enhance Wiiisdom Ops’ credibility in the industry.
Customer Adoption: Wiiisdom Ops is used by Tableau-centric organizations that require rigorous testing. The Red Hat case study is a flagship example, showing adoption at scale (5,000+ Tableau workbooks) . Other known users include certain financial institutions and healthcare organizations (some case studies are mentioned on Wiiisdom’s site). Given Wiiisdom’s long history with BI governance, many of its existing customers (in the Fortune 500, especially those using Tableau alongside other BI tools) are likely evaluating or adopting Wiiisdom Ops as they extend governance to Tableau.
While overall market share is hard to gauge, the tool is gaining traction specifically among Tableau enterprise customers who need automated testing integrated with their development lifecycle. The acquisition by Wiiisdom also lends it a broader sales network and support infrastructure, likely increasing its adoption since 2021.
Feature Set: Wiiisdom Ops (Kinesis CI) provides a comprehensive test framework for Tableau with a focus on functional, regression, and performance testing of Tableau content.
QuerySurge (BI Tester for Tableau)
Marketing & Reputation: QuerySurge is a well-known data testing automation platform, primarily used for ETL and data warehouse testing. While not Tableau-specific, it offers a module called BI Tester that connects to BI tools (including Tableau) to validate the data in reports. QuerySurge is widely used in the data quality and ETL testing space (with many Fortune 500 users) and is often mentioned as a top solution for data/ETL testing.
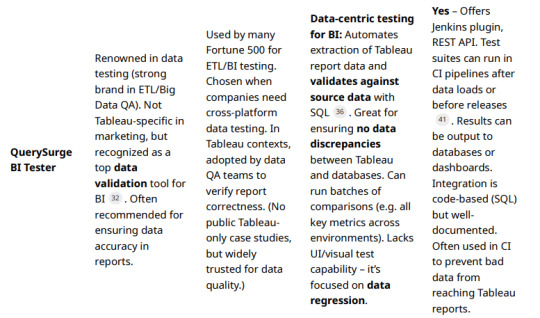
Its marketing emphasizes ensuring data accuracy in the “last mile” of BI. However, QuerySurge’s brand is stronger in the data engineering community than specifically in Tableau circles, since it does not perform UI or functional testing of dashboards (it focuses on data correctness beneath the BI layer).
Customer Adoption: QuerySurge has a broad user base across industries for data testing, and some of those users leverage it for Tableau report validation. It’s known that organizations using multiple BI tools (Tableau, Cognos, Power BI, etc.) might use QuerySurge centrally to validate that data shown in reports matches the data in the warehouse. The vendor mentions “dozens of teams” using its BI integrations to visualize test results in tools like Tableau and Power BI , suggesting an ecosystem where QuerySurge ensures data quality and BI tools consume those results.
Notable QuerySurge clients include large financial institutions, insurance companies, and tech firms (as per their case studies), though specific Tableau-centric references are not heavily publicized. As a generic tool, its adoption overlaps with but is not exclusive to Tableau projects
Feature Set: For Tableau testing, QuerySurge’s BI Tester provides a distinct but important capability: datalevel regression testing for Tableau reports. Key features include.
Conclusion:
The Market Leader in Tableau Testing Considering the above, Datagaps BI Validator currently stands out as the best all-around commercial Tableau testing tool leading the market. It edges out others in terms of breadth of features and proven adoption.
Enterprises appreciate its ability to handle everything from data validation to UI regression and performance testing in one package .
Its multi-BI versatility also means a wider user base and community knowledge pool. Many practitioners point to BI Validator as the most “efficient testing tool for Tableau” in practice . That said, the “best” choice can depend on an organization’s specific needs. Wiiisdom Ops (Kinesis) is a very close competitor, especially for organizations focusing solely on Tableau and wanting seamless CI/CD pipeline integration and governance extras.
Wiiisdom Ops has a strong future outlook given its Tableaufocused innovation and success stories like Red Hat (testing time cut from days to minutes) . It might be considered the leader in the Tableau-only segment, and it’s rapidly gaining recognition as Tableau customers pursue DevOps for analytics.
QuerySurge, while not a one-stop solution for Tableau, is the leader for data quality assurance in BI and remains indispensable for teams that prioritize data correctness in reports . It often complements either Datagaps or Wiiisdom by covering the data validation aspect more deeply. In terms of marketing presence and industry buzz, Datagaps and Wiiisdom are both very active:
Datagaps publishes thought leadership on BI testing and touts AI-driven DataOps, whereas Wiiisdom evangelizes AnalyticsOps and often partners with Tableau ecosystem events. Industry analysts have started to note the importance of such tools as BI environments mature.
In conclusion, Datagaps BI Validator is arguably the market leader in Tableau test automation today — with the strongest combination of features, enterprise adoption, and cross-platform support . Wiiisdom Ops (Kinesis CI) is a close runner-up, leading on Tableau-centric continuous testing and rapidly improving its footprint . Organizations with heavy data pipeline testing needs also recognize QuerySurge as an invaluable tool for ensuring Tableau outputs are trustworthy .
All these tools contribute to higher confidence in Tableau dashboards by catching errors and regressions early. As analytics continues to be mission-critical, adopting one of these leading solutions is becoming a best practice for enterprises to safeguard BI quality and enable faster, error-free Tableau deployments
#datagaps#dataops#bivalidator#dataquality#tableau testing#automation#wiiisdom#querysurge#etl testing#bi testing
0 notes
Text
In today’s world, data is considered one of the most valuable assets any business can have. However, to truly unlock the power of data, it’s not enough to simply collect it—organizations need to ensure that the data they are working with is accurate, consistent, and reliable. That’s where Data Quality Observability comes in.
Data Quality Observability is the ability to monitor, understand, and proactively manage the state of data across an entire ecosystem. With the growing complexity of data pipelines and the increasing reliance on data-driven decisions, organizations can no longer afford to ignore the health of their data. Data quality observability helps businesses identify issues before they impact operations, making it a critical part of any data strategy.
#datagaps#data quality#data#dataops#dataops suite#data quality observability#QA tester#Data Analysts#BI Experts
0 notes
Text
How Databricks Unity Catalog and Datagaps Automate Governance and Validation

Data quality is the backbone of accurate analytics, regulatory compliance, and efficient business operations. As organizations scale their data ecosystems, maintaining high data integrity becomes more challenging.
The seamless integration between Databricks Unity Catalog and Datagaps DataOps Suite provides a powerful framework for automated governance and validation, ensuring that data remains accurate, complete, and compliant at all times.
In our previous discussion, we highlighted how Datagaps enhances metadata management, lineage tracking, and automation within Unity Catalog. This article takes the next step by diving into data quality assurance – a crucial component of enterprise-wide data governance.
By leveraging Datagaps Data Quality Monitor, organizations can implement automated validation strategies, reduce manual effort, and integrate real-time data quality scores into Unity Catalog for proactive governance. Let’s explore how these technologies work together to ensure high-quality, reliable data that drives better decision-making and compliance.
The Growing Need for Automated Data Quality Assurance
Modern enterprises manage vast amounts of structured and unstructured data across multiple platforms. Ensuring data accuracy, completeness, and consistency is no longer just a best practice – it’s a necessity for regulatory compliance and business intelligence.
Databricks Unity Catalog provides a centralized governance framework for managing metadata, access controls, and data lineage across an organization. By integrating with Datagaps Data Quality Monitor, enterprises can automate data validation, reduce errors, and gain deeper insights into data health and integrity.
6 Key Data Quality Dimensions

Effective data quality management revolves around six fundamental dimensions:
Accuracy – Ensuring data reflects real-world values without discrepancies.
Completeness – Verifying that all required fields and records are present.
Consistency – Maintaining uniformity across multiple data sources and systems.
Timeliness – Ensuring data is up-to-date and available when needed.
Uniqueness – Eliminating duplicate records and redundant data entries.
Validity – Enforcing compliance with defined formats, business rules, and constraints.
By addressing these dimensions, organizations can improve the trustworthiness of their data assets, enhance AI/ML outcomes, and comply with industry regulations.
Automating Data Quality Validation with White-Box and Black-Box Testing
Ensuring data integrity at scale requires a systematic approach to validation. Two widely used methodologies are:
1. White-Box Testing
Examines internal data transformations, lineage, and business rules.
Ensures that every step in the ETL (Extract, Transform, Load) process adheres to defined standards.
Provides deeper insights into data processing logic to catch issues at the source.
2. Black-Box Testing
Focuses on output validation by comparing actual results against expected benchmarks.
Useful for detecting anomalies, missing records, and schema mismatches.
Works well for regulatory compliance and end-to-end data pipeline testing.
A hybrid approach combining both techniques ensures robust validation and proactive anomaly detection.
How Unity Catalog and Datagaps Data Quality Monitor Work Together
1. Unified Governance and Automated Validation
Databricks Unity Catalog centralizes metadata management, access control, and lineage tracking.
Datagaps Data Quality Monitor extends these capabilities with automated quality checks, reducing manual efforts.
2. Mapping Manager Utility: Simplifying Test Case Automation
One of the standout features of Datagaps Data Quality Monitor is the Mapping Manager Utility, which:
Extracts mapping configurations from Databricks Unity Catalog.
Automatically generates white-box and black-box test cases.
Reduces the need for manual intervention, increasing efficiency and scalability.
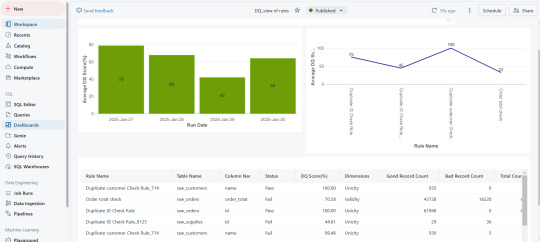
3. Real-Time Data Quality Scores for Proactive Governance
After test execution, a data quality score is generated.
These scores are seamlessly integrated into Databricks Unity Catalog, allowing real-time monitoring.
Organizations can visualize data quality insights through dashboards and take corrective actions before issues impact business operations.
Key Use Cases
ETL and Data Pipeline Validation – Ensuring data transformations adhere to defined business rules.
Regulatory Compliance and Audit Readiness – Mitigating risks associated with inaccurate reporting.
Enterprise Data Lakehouse Governance – Enhancing consistency across distributed datasets.
AI/ML Data Preprocessing – Ensuring clean, high-quality data for better model performance.
Automated Data Quality Checks – Reducing manual data validation efforts for faster, more reliable insights.
Scalability for Large Datasets – Efficiently managing high-volume, high-velocity enterprise data.
Faster QA Cycles – Automating test case execution for rapid turnaround.
Lower Operational Resources – Reducing human intervention, saving time and resources.
The Business Impact: Why This Integration Matters
Enhanced Automation – Eliminates manual quality checks and increases efficiency.
Real-Time Monitoring – Provides instant visibility into data quality metrics.
Stronger Compliance – Supports industry standards and regulations effortlessly.
Scalability – Designed for large-scale, complex data ecosystems.
Cost Efficiency – Reduces operational overhead and improves ROI on data management initiatives.
Ensuring data quality at scale requires a combination of automated governance, real-time monitoring, and seamless integration. The connection between Databricks Unity Catalog and Datagaps Data Quality Monitor provides a comprehensive solution to achieve this goal.
With automated test case generation, continuous data validation, and integrated governance, organizations can ensure their data is always accurate, complete, and compliant—laying the foundation for data-driven decision-making and regulatory confidence.
0 notes
Text
#dataquality#Databricks#cloud data testing#DataOps#Datagaps#Catalog#Unity Catalog#Datagaps BI Validator
0 notes
Text
Automating Tableau Reports Validation: The Easy Path to Trusted Insights
Automating Tableau Reports Validation is essential to ensure data accuracy, consistency, and reliability across multiple scenarios. Manual validation can be time-consuming and prone to human error, especially when dealing with complex dashboards and large datasets. By leveraging automation, organizations can streamline the validation process, quickly detect discrepancies, and enhance overall data integrity.
Going ahead, we’ll explore automation of Tableau reports validation and how it is done.
Importance of Automating Tableau Reports Validation
Automating Tableau report validation provides several benefits, ensuring accuracy, efficiency, and reliability in BI reporting.
Automating the reports validation reduces the time and effort, which allows analysts to focus on insights rather than troubleshooting the errors
Automation prevents data discrepancies and ensures all reports are pulling in consistent data
Many Organizations deal with high volumes of reports and dashboards. It is difficult to manually validate each report. Automating the reports validation becomes critical to maintain efficiency.
Organizations update their Tableau dashboards very frequently, sometimes daily. On automating the reports validation process, a direct comparison is made between the previous and current data to detect changes or discrepancies. This ensures metrics remain consistent after each data refresh.
BI Validator simplifies BI testing by providing a platform for automated BI report testing. It enables seamless regression, stress, and performance testing, making the process faster and more reliable.
Tableau reports to Database data comparison ensures that the records from the source data are reflected accurately in the visuals of Tableau reports.
This validation process extracts data from Tableau report visuals and compares it with SQL Server, Oracle, Snowflake, or other databases. Datagaps DataOps Suite BI Validator streamlines this by pulling report data, applying transformations, and verifying consistency through automated row-by-row and aggregate comparisons (e.g., counts, sums, averages).
The errors detected usually identify missing, duplicate or mismatched records.
Automation ensures these issues are caught early, reducing manual effort and improving trust in reporting.
Tableau Regression
In the DataOps suite, Regression testing is done by comparing the benchmarked version of tableau report with the live version of the report through Tableau Regression component.
This Tableau regression component can be very useful for automating the testing of Tableau reports or Dashboards during in-place upgrades or changes.
A diagram of a process AI-generated content may be incorrect.
Tableau Upgrade
Tableau Upgrade Component in BI validator helps in automated report testing by comparing the same or different reports of same or different Tableau sources.
The comparison is done in the same manner as regression testing where the differences between the reports can be pointed out both in terms of text as well as appearance.
Generate BI DataFlows is a handy and convenient feature provided by Datagaps DataOps suite to generate multiple dataflows at once for Business Intelligence components like Tableau.
Generate BI DataFlows feature is beneficial in migration scenarios as it enables efficient data comparison between the original and migrated platforms and supports the validations like BI source, Regression and Upgrade. By generating multiple dataflows based on selected reports, users can quickly detect discrepancies or inconsistencies that may arise during the migration process, ensuring data integrity and accuracy while minimizing potential errors. Furthermore, when dealing with a large volume of reports, this feature speeds up the validation process, minimizes manual effort, and improves overall efficiency in detecting and resolving inconsistencies.
As seen from the image, the wizard starts by generating the Dataflow details. The connection details like the engine, validation type, Source-Data Source and Target-Data Source are to be provided by users.
Note: BI source validation and Regression validation types do not prompt for Target-Data source
Let’s take a closer look at the steps involved in “Generate BI Dataflows”
Reports
The Reports section prompts users to select pages from the required reports in the validation process. For Data Compare validation and Upgrade Validation, both source and target pages will be required. For other cases, only the source page will be needed.
Here is a sample screenshot of the extraction of source and target pages from the source and target report respectively
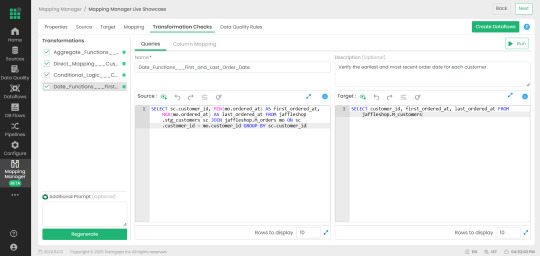
Visual Mapping and Column Mapping (only in Data Compare Validation)
The "Visual Mapping" section allows users to load and compare source and target pages and then establish connections between corresponding tables.
It consists of three sections namely Source Page, Target Page, and Mapping.
In the source page and target page, respective Tableau worksheets are loaded and on selecting the worksheets option, users can preview the data.
After loading the source and target pages, in the mapping section, the dataset columns of source and target will be automatically mapped for each mapping.
After Visual Mapping, the "Column Mapping" section displays the columns of the source dataset and target dataset that were selected for the data comparison. It provides a count of the number of dataset columns that are mapped and unmapped in the "Mapped" and "Unmapped" tabs respectively.
Filters (for the rest of the validation types)
The filters section enables users to apply the filters and parameters on the reports to help in validating them. These filters can either be applied and selected directly through reports or they can be parameterized as well.
Options section varies depending on the type of validation selected by the user. Options section is the pre final stage of generating the flows where some of the advanced options and comparison options are prompted to be selected as per the liking of the user to get the results as they like.
Here’s a sample screenshot of options section before generating the dataflows
This screenshot indicates report to report comparison options to be selected.
Generate section helps to generate multiple dataflows with the selected type of validation depending on the number of selected workbooks for tableau.
The above screenshot indicates that four dataflows are set to be generated on clicking the Generate BI Dataflows button. These dataflows are the same type of validation (Tableau Regression Validation in this case)
Stress Test Plan
To automate the stress testing and performance testing of Tableau Reports, Datagaps DataOps suite BI Validator comes with a component called Stress Test Plan to simulate the number of users actively accessing the reports to analyze how Tableau reports and dashboards perform under heavy load. Results of the stress test plan can be used to point out performance issues, optimize data models and queries to ensure the robustness of the Tableau environment to handle heavy usage patterns. Stress Test Plan allows users to perform the stress testing for multiple views from multiple workbooks at once enabling the flexibility and automation to check for performance bottlenecks of Tableau reports.
For more information on Stress Test Plan, check out “Tableau Performance Testing”.
Integration with CI/CD tools and Pipelines
In addition to these features, DataOps Suite comes with other interesting features like application in built pipelines where the set of Tableau BI dataflows can be run automatically in a certain order either in sequence or parallel.
Also, there’s an inbuilt scheduler in the application where the users can schedule the run of these pipelines involving these BI dataflows well in advance. The jobs can be scheduled to run once or repeatedly as well.
Achieve the seamless and automated Tableau report validation with the advanced capabilities of Datagaps DataOps Suite BI Validator.
0 notes