#its at /usr/local/bin/bash
Explore tagged Tumblr posts
Visit Tumblr Blog
Explore Tumblr blogs with no restrictions, modern design and the best experience.
Last Seen Tumblr Blogs


Fun Fact
Tumblr has 4 main sources of revenue.
Text
Hey, uh, why does the *Official Docker* bash image on DockerHub not have bash at /bin/bash? What the fuck?
14 notes
·
View notes
Text
Setting a GNOME extension to run at the greeter
I recently installed Linux on my old Surface Book, a touchscreen device. I want to be able to use the entire interface with the keyboard unplugged. This means I must use the onscreen keyboard frequently - but the default GNOME OSK (onscreen keyboard) is doo doo trash, and I don't want it. You will need root access for this tutorial.
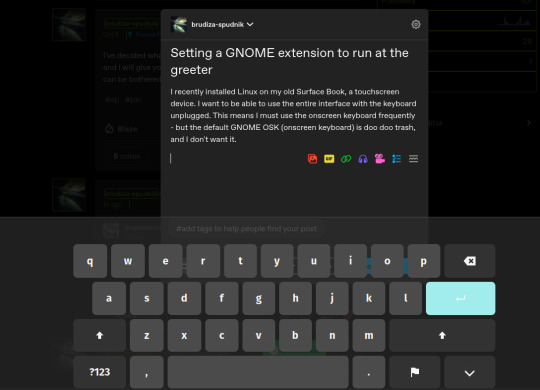

Compare the default GNOME OSK (left) to the new and improved one (right).
This tutorial involves copying a standard GNOME extension into a folder that's readable by any user, then enabling it for use by the GDM user, which governs GNOME's greeter (login screen).
The extension I will be installing using this method is the above keyboard, [email protected] (which can be found via GNOME's extension manager). This is done with the purpose of accessing this significantly improved onscreen keyboard even at the login screen - without this tutorial, the extension does not load until after you have logged in. This method can be done with any extension, although I'm told the GDM user is more restricted than the actual user so some things may not work.
Step 1: Set up the extension in userspace.
Modifying the extension config after it's copied over will be a pain in the ass. Get all your configs ready using the extension's own menus or config files. No rush, as you can still do this bit up until step 5.
Step 2: Move the extension from user-install to system-install.
In order for the GDM user to access the extension it must be in the system-installed folder. For my OS (Zorin) it will be in good company.
sudo mv -r ~/.local/share/gnome-shell/extensions/[email protected] /usr/share/gnome-shell/extensions/
You can also copy it instead of moving it, but you have to rename the user-install folder (in ~/.local) to break it. Otherwise the system would rather use the user-installed one, and will ignore the system-installed one on boot. I think.
Make sure that the gdm user can actually access the files as well:
sudo chmod -R a+rX /usr/share/gnome-shell/extensions/[email protected]
Step 3: Modify the extension metadata file to let it run on the login screen.
sudo nano /usr/share/gnome-shell/extensions/[email protected]/metadata.json
look for the line that says
"session-modes": ["user"],
If the line doesn't exist, just add it. You need it to say
"session-modes": ["user", "gdm", "unlock-dialog"],
Step 4: Enable the extension for the gdm user.
To do this and the following step, you must be able to log in as the gdm user. There are multiple ways to do this, but the way I used is via `machinectl`. If you try to run this command on its own it should tell you what package you need to install to actually use it. I do not know the ramifications of installing this, nor do I know its compatibility; all I can say is it worked for me. If you are uncertain you will have to carve your own path here.
Once it is installed, log into the gdm user from a terminal:
machinectl shell gdm@ /bin/bash
and enter your sudo password.
At this point I recommend checking the current list of enabled extensions:
gsettings get org.gnome.shell enabled-extensions
On my computer, this came back saying "@as []", which means it's blank. To enable your desired extension:
gsettings set org.gnome.shell enabled-extensions "['[email protected]', 'if the above command did NOT come back blank just put the rest in here.']"
Step 5: Transfer the settings from the userspace install to the system install.
Right now, the extension should be working on the login screen. To make sure, press ctrl + alt + delete to log out, or restart your computer. You will notice that while the extension is functioning, none of your settings saved. To fix this you must use dconf to dump and then reimport the settings. Get back to a regular user terminal and run:
dconf dump /org/gnome/shell/extensions/[email protected]/ > extension.ini
Now you have your settings in a nice neat file. The gdm user can't access this though since it's in your user folder. My quick and dirty solution:
sudo mv ~/extension.ini /extension.ini sudo chmod 777 /extension.ini
If you want it in a better place than the system root folder you can put it there. I don't really care.
Now you log into the GDM user and import the settings file there.
machinectl shell gdm@ /bin/bash dconf load /org/gnome/shell/extensions/[email protected]/ < /extension.ini
Now log out of the gdm user and clean up after yourself.
sudo rm /extension.ini
Now restart or log out and you will see that your extension is now functioning with all its settings.
Huge thank you to Pratap on the GNOME Discourse site. This post is basically just a tutorialized adaptation of the thread I followed to do this.
3 notes
·
View notes
Text
How to Test Cron Jobs: A Complete Guide

Cron jobs are essential in many systems for scheduling tasks, automating processes, and running scripts at specified intervals. Whether you're maintaining a web server, automating backups, or running routine data imports, cron jobs keep your operations running smoothly. But like any automated task, they must be thoroughly tested to ensure reliability and accuracy.
In this article, we’ll explore how to test cron jobs effectively, covering different testing strategies, common tools, and best practices to ensure your cron jobs perform flawlessly in production.
What Are Cron Jobs?
A cron job is a time-based task scheduler in Unix-like operating systems, allowing users to schedule scripts or commands to run at specified times or intervals. They are defined in the crontab file, where each job is scheduled using a specific syntax for minute, hour, day of the month, month, and day of the week.
Here’s a quick example of a cron job entry:
javascript
Copy code
0 2 * * * /usr/bin/backup.sh
This cron job runs the backup.sh script every day at 2:00 AM.
Given the importance of cron jobs, especially in production environments, it is crucial to test them thoroughly to avoid unexpected failures or data loss.
Why Is Testing Cron Jobs Important?
While cron jobs automate routine tasks, they can fail silently if not tested correctly. Testing cron jobs ensures they are running as expected, perform their tasks efficiently, and handle potential errors gracefully. Here are a few reasons why testing cron jobs is critical:
Prevent Downtime: Cron jobs often run crucial tasks like database backups or system health checks. If these fail, it can lead to downtime or data loss.
Detect Errors Early: Testing helps catch issues such as incorrect file paths, permission errors, or script syntax problems before they occur in production.
Ensure Timing Accuracy: Testing verifies that jobs run at the intended intervals, whether they’re hourly, daily, or monthly.
Monitor Resource Usage: Testing helps you monitor how cron jobs affect system resources, such as CPU and memory.
How to Test Cron Jobs Effectively
Testing cron jobs involves multiple steps, ranging from local development testing to production monitoring. Below are the various strategies you can use to test your cron jobs:
1. Testing Cron Jobs Locally
Before deploying cron jobs to production, it’s best to test them in a local environment to catch issues early.
a. Manually Trigger Cron Scripts
You can manually execute the script or command intended for the cron job. This allows you to observe the behavior without waiting for the scheduled time.
bash
Copy code
bash /path/to/your/script.sh
Manually running the script helps identify immediate errors like incorrect paths, permission issues, or missing dependencies.
b. Use at Command to Simulate Scheduling
The at command is useful for testing scheduled jobs by setting a one-time task at a specific time without modifying the crontab. For example:
bash
Copy code
echo "/path/to/your/script.sh" | at now + 1 minute
This will run the script one minute after you submit the command, simulating how it would behave under cron.
c. Log Outputs for Debugging
It’s important to log the output of your cron jobs to detect issues. You can use echo or redirect output to a log file.
bash
Copy code
echo "Cron job started at $(date)" >> /path/to/logfile.log
Logging makes it easier to debug and monitor performance when the cron job runs in production.
2. Testing Cron Jobs in Staging or Production
After local testing, it’s time to test cron jobs in a staging environment to mimic production as closely as possible.
a. Use Temporary Cron Jobs for Testing
Instead of waiting for the scheduled time, you can modify your cron job schedule to run every minute for testing purposes. Here’s an example:
javascript
Copy code
* * * * * /path/to/script.sh
Once the test is complete, revert the schedule to its intended intervals.
b. Monitor Logs in Real Time
Use the tail command to monitor logs in real time while the cron job runs:
bash
Copy code
tail -f /path/to/logfile.log
This lets you observe the output as the cron job executes, helping you catch any issues immediately.
c. Check Exit Status Codes
Cron jobs run scripts, and these scripts should always return an exit status code to indicate success or failure. You can check the exit status using $? after the script executes:
bash
Copy code
/path/to/script.sh
if [ $? -eq 0 ]; then
echo "Success"
else
echo "Failure"
fi
If the job fails, debug the script based on the status code and error messages.
3. Tools for Testing Cron Jobs
There are various tools available to help automate and monitor cron job testing:
a. cronitor.io
Cronitor is a monitoring service designed to track scheduled jobs. It can alert you if a job fails or doesn’t run as expected.
b. Healthchecks.io
Healthchecks.io is a service that helps you monitor cron jobs by sending a ping when they run. If a ping is missed, Healthchecks.io will alert you, allowing for easy detection of failed jobs.
c. Monit
Monit is a powerful tool for monitoring cron jobs, among other system services. It automatically restarts failed jobs or processes, providing high availability.
d. Supervisor
Supervisor is a process control system that allows you to monitor and restart cron jobs if they fail. It’s especially useful in production environments where uptime is critical.
4. Automated Testing for Cron Jobs
Automating cron job testing ensures that jobs run smoothly after every code change or server update. Here’s how you can automate testing for cron jobs:
a. Unit Testing the Script
Before running your script as a cron job, you can unit test it using testing frameworks like Jest (for JavaScript) or PyTest (for Python). Unit testing ensures that individual parts of the script work as expected.
b. Integration Testing
Test how the cron job integrates with other parts of your system, such as databases or APIs. Automated integration testing ensures that data retrieval and processing happen correctly.
c. Use CI/CD Pipelines
If your cron jobs are part of a larger system, integrate them into your CI/CD pipeline. Tools like Jenkins or GitLab CI can trigger cron job scripts and check for errors after every deployment, ensuring that everything works as expected in the live environment.
Best Practices for Testing Cron Jobs
Here are a few best practices to ensure your cron jobs perform reliably:
Isolate Cron Jobs: Keep each cron job independent to reduce the chances of one job affecting another.
Use Version Control: Keep your cron job scripts in a version control system like Git to track changes and roll back if necessary.
Monitor Regularly: Set up regular monitoring to track your cron jobs in production and catch issues early.
Handle Errors Gracefully: Ensure that your scripts handle errors and failures gracefully, logging them for future reference.
Conclusion
Testing cron jobs is critical for ensuring the reliability and stability of your automated tasks. By following the steps outlined in this guide, you can catch potential issues before they impact your production environment. Whether you’re running backups, performing database maintenance, or scheduling routine tasks, proper testing will help you maintain smooth and efficient operations. By using tools like Cronitor, Healthchecks.io, and CI/CD pipelines, you can automate and monitor cron jobs with ease. Testing your cron jobs thoroughly and following best practices will ensure that they run without any unexpected failures or interruptions.
0 notes
Text
12 Terminal Commands
Every Web Developer Should Know
The terminal is one of the foremost vital productivity tools in a developer's arsenal. Mastering it will have an awfully positive impact on your work flow, as several everyday tasks get reduced to writing a straightforward command and striking Enter. In this article we've ready for you a set of UNIX system commands that may assist you get the foremost out of your terminal. a number of them square measure inbuilt, others square measure free tools that square measure reliable and may be put in but a moment.
Curl
Curl may be a program line tool for creating requests over HTTP(s), FTP and dozens of different protocols you will haven't detected concerning. It will transfer files, check response headers, and freely access remote information.
In net development curl is usually used for testing connections and dealing with RESTful APIs.
# Fetch the headers of a URL. curl -I http://google.com HTTP/1.1 302 Found Cache-Control: private Content-Type: text/html; charset=UTF-8 Referrer-Policy: no-referrer Location: http://www.google.com/?gfe_rd=cr&ei=0fCKWe6HCZTd8AfCoIWYBQ Content-Length: 258 Date: Wed, 09 Aug 2017 11:24:01 GMT # Make a GET request to a remote API. curl http://numbersapi.com/random/trivia 29 is the number of days it takes Saturn to orbit the Sun.
Curl commands can get much more complicated than this. There are tons of options for controlling headers, cookies, authentication,and more.
Tree
Tree may be a little instruction utility that shows you a visible illustration of the files during a directory. It works recursively, going over every level of nesting and drawing a formatted tree of all the contents. this fashion you'll quickly skim and notice the files you're trying to find.
tree . ├── css │ ├── bootstrap.css │ ├── bootstrap.min.css ├── fonts │ ├── glyphicons-halflings-regular.eot │ ├── glyphicons-halflings-regular.svg │ ├── glyphicons-halflings-regular.ttf │ ├── glyphicons-halflings-regular.woff │ └── glyphicons-halflings-regular.woff2 └── js ├── bootstrap.js └── bootstrap.min.js
There is also the option to filter the results using a simple regEx-like pattern:
tree -P '*.min.*' . ├── css │ ├── bootstrap.min.css ├── fonts └── js └── bootstrap.min.js
Tmux
According to its Wiki, Tmux may be a terminal electronic device, that translated in human language would mean that it is a tool for connecting multiple terminals to one terminal session.
It helps you to switch between programs in one terminal, add split screen panes, and connect multiple terminals to a similar session, keeping them in adjust. Tmux is particularly helpful once functioning on a far off server, because it helps you to produce new tabs while not having to log in once more.
Disk usage - du
The du command generates reports on the area usage of files and directories. it's terribly straightforward to use and may work recursively, rummaging every directory and returning the individual size of each file. A common use case for du is once one in every of your drives is running out of area and you do not understand why. Victimization this command you'll be able to quickly see what proportion storage every folder is taking, therefore finding the most important memory saver.
# Running this will show the space usage of each folder in the current directory. # The -h option makes the report easier to read. # -s prevents recursiveness and shows the total size of a folder. # The star wildcard (*) will run du on each file/folder in current directory. du -sh * 1.2G Desktop 4.0K Documents 40G Downloads 4.0K Music 4.9M Pictures 844K Public 4.0K Templates 6.9M Videos
There is also a similar command called
df
(Disk Free) which returns various information about the available disk space (the opposite of du).
Git
Git is far and away the foremost standard version system immediately. It’s one among the shaping tools of contemporary internet dev and that we simply could not leave it out of our list. There area unit many third-party apps and tools on the market however most of the people choose to access unpleasant person natively although the terminal. The unpleasant person CLI is basically powerful and might handle even the foremost tangled project history.
Tar
Tar is the default Unix tool for working with file archives. It allows you to quickly bundle multiple files into one package, making it easier to store and move them later on.
tar -cf archive.tar file1 file2 file3
Using the -x option it can also extract existing .tar archives.
tar -xf archive.tar
Note that almost all alternative formats like .zip and .rar can't be opened by tar and need alternative command utilities like unfasten.
Many trendy operating system systems run associate expanded version of tar (GNU tar) that may additionally perform file size compression:
# Create compressed gzip archive. tar -czf file.tar.gz inputfile1 inputfile2 # Extract .gz archive. tar -xzf file.tar.gz
If your OS doesn't have that version of tar, you can use
gzip
,
zcat
or
compress
to reduce the size of file archives.
md5sum
Unix has many inbuilt hashing commands together with
md5sum
,
sha1sum
and others. These program line tools have varied applications in programming, however most significantly they'll be used for checking the integrity of files. For example, if you've got downloaded associate degree .iso file from associate degree untrusted supply, there's some likelihood that the file contains harmful scripts. To form positive the .iso is safe, you'll generate associate degree md5 or alternative hash from it.
md5sum ubuntu-16.04.3-desktop-amd64.iso 0d9fe8e1ea408a5895cbbe3431989295 ubuntu-16.04.3-desktop-amd64.iso
You can then compare the generated string to the one provided from the first author (e.g. UbuntuHashes).
Htop
Htop could be a a lot of powerful different to the intrinsic prime task manager. It provides a complicated interface with several choices for observation and dominant system processes.
Although it runs within the terminal, htop has excellent support for mouse controls. This makes it a lot of easier to navigate the menus, choose processes, and organize the tasks thought sorting and filtering.
Ln
Links in UNIX operating system square measure the same as shortcuts in Windows, permitting you to urge fast access to bound files. Links square measure created via the ln command and might be 2 types: arduous or symbolic. Every kind has totally different properties and is employed for various things (read more).
Here is associate example of 1 of the various ways that you'll be able to use links. as an instance we've a directory on our desktop referred to as Scripts. It contains showing neatness organized bash scripts that we have a tendency to ordinarily use. on every occasion we wish to decision one in every of our scripts we'd need to do this:
~/Desktop/Scripts/git-scripts/git-cleanup
Obviously, this is isn't very convinient as we have to write the absolute path every time. Instead we can create a symlink from our Scripts folder to /usr/local/bin, which will make the scripts executable from all directories.
sudo ln -s ~/Desktop/Scripts/git-scripts/git-cleanup /usr/local/bin/
With the created symlink we can now call our script by simply writing its name in any opened terminal.
git-cleanup
SSH
With the ssh command users will quickly hook up with a foreign host and log into its UNIX operating system shell. This makes it doable to handily issue commands on the server directly from your native machine's terminal.
To establish a association you just got to specify the proper science address or URL. The primary time you hook up with a replacement server there'll be some style of authentication.
ssh username@remote_host
If you want to quickly execute a command on the server without logging in, you can simply add a command after the url. The command will run on the server and the result from it will be returned.
ssh username@remote_host ls /var/www some-website.com some-other-website.com
There is a lot you can do with SSH like creating proxies and tunnels, securing your connection with private keys, transferring files and more.
Grep
Grep is the standard Unix utility for finding strings inside text. It takes an input in the form of a file or direct stream, runs its content through a regular expression, and returns all the matching lines.
This command comes in handy once operating with massive files that require to be filtered. Below we tend to use grep together with the date command to look through an oversized log file and generate a brand new file containing solely errors from nowadays.
// Search for today's date (in format yyyy-mm-dd) and write the results to a new file. grep "$(date +"%Y-%m-%d")" all-errors-ever.log > today-errors.log
Another nice command for operating with strings is
sed
. It’s additional powerful (and additional complicated) than grep and may perform nearly any string-related task together with adding, removing or replacement strings.
Alias
Many OS commands, together with some featured during this article, tend to urge pretty long when you add all the choices to them. to create them easier to recollect, you'll produce short aliases with the alias bash inbuilt command:
# Create an alias for starting a local web server. alias server="python -m SimpleHTTPServer 9000" # Instead of typing the whole command simply use the alias. server Serving HTTP on 0.0.0.0 port 9000 ...
The alias are offered as long as you retain that terminal open. to create it permanent you'll add the alias command to your .bashrc file. We will be happy to answer your questions on designing, developing, and deploying comprehensive enterprise web, mobile apps and customized software solutions that best fit your organization needs.
As a reputed Software Solutions Developer we have expertise in providing dedicated remote and outsourced technical resources for software services at very nominal cost. Besides experts in full stacks We also build web solutions, mobile apps and work on system integration, performance enhancement, cloud migrations and big data analytics. Don’t hesitate to
get in touch with us!
1 note
·
View note
Text
How To Install Prometheus on Debian 11| Debian 10 Linux?. Prometheus is a free and open source monitoring system that enables you to collect time-series data metrics from any target systems. Its web interface enables you to perform powerful queries, visualize collected data, and to configure alerts. In this guide, we will cover the installation of Prometheus and node_exporter on Debian 11 / Debian 10. Since this is a binary installation method, there is no required dependency to continue with the setup. Step 1: Create Prometheus system user / group We’ll create a dedicated Prometheus system user and group. The -r or –system option is used for this purpose. sudo groupadd --system prometheus sudo useradd -s /sbin/nologin --system -g prometheus prometheus This creates a system user which doesn’t need /bin/bash shell, that’s why we used -s /sbin/nologin. Step 2: Create configuration and data directories Prometheus needs directories to store data and configuration files. Create all required directories using the commands below. sudo mkdir /var/lib/prometheus for i in rules rules.d files_sd; do sudo mkdir -p /etc/prometheus/$i; done Step 3: Download and Install Prometheus on Debian 11 / Debian 10 Let’s download the latest release of Prometheus archive and extract it to get binary files. You can check releases from Prometheus releases Github page. sudo apt-get update sudo apt-get -y install wget curl mkdir -p /tmp/prometheus && cd /tmp/prometheus curl -s https://api.github.com/repos/prometheus/prometheus/releases/latest|grep browser_download_url|grep linux-amd64|cut -d '"' -f 4|wget -qi - Extract the file. tar xvf prometheus*.tar.gz cd prometheus*/ Move the prometheus binary files to /usr/local/bin/ Since /usr/local/bin/ is in your PATH, let’s copy binary files to it. sudo mv prometheus promtool /usr/local/bin/ Move prometheus configuration template to /etc directory. sudo mv prometheus.yml /etc/prometheus/prometheus.yml Also move consoles and console_libraries to /etc/prometheus directory: sudo mv consoles/ console_libraries/ /etc/prometheus/ cd ~/ rm -rf /tmp/prometheus Step 4: Create/Edit a Prometheus configuration file. Prometheus configuration file will be located under /etc/prometheus/prometheus.yml. cat /etc/prometheus/prometheus.yml The default configuration file looks similar to below. # my global config global: scrape_interval: 15s # Set the scrape interval to every 15 seconds. Default is every 1 minute. evaluation_interval: 15s # Evaluate rules every 15 seconds. The default is every 1 minute. # scrape_timeout is set to the global default (10s). # Alertmanager configuration alerting: alertmanagers: - static_configs: - targets: # - alertmanager:9093 # Load rules once and periodically evaluate them according to the global 'evaluation_interval'. rule_files: # - "first_rules.yml" # - "second_rules.yml" # A scrape configuration containing exactly one endpoint to scrape: # Here it's Prometheus itself. scrape_configs: # The job name is added as a label `job=` to any timeseries scraped from this config. - job_name: 'prometheus' # metrics_path defaults to '/metrics' # scheme defaults to 'http'. static_configs: - targets: ['localhost:9090'] Step 5: Create a Prometheus systemd Service unit file To be able to manage Prometheus service with systemd, you need to explicitly define this unit file. sudo tee /etc/systemd/system/prometheus.service Aug 31 19:14:07 debian-bullseye-01 prometheus[1890]: level=info ts=2021-08-31T19:14:07.190Z caller=main.go:839 fs_type=EXT4_SUPER_MAGIC Aug 31 19:14:07 debian-bullseye-01 prometheus[1890]: level=info ts=2021-08-31T19:14:07.190Z caller=main.go:842 msg="TSDB started" Aug 31 19:14:07 debian-bullseye-01 prometheus[1890]: level=info ts=2021-08-31T19:14:07.191Z caller=main.go:969 msg="Loading configuration file" filename=/etc/prometheus/prometheus.yml Aug 31 19:14:07 debian-bullseye-01 prometheus[1890]: level=info ts=2021-08-31T19:14:07.
192Z caller=main.go:1006 msg="Completed loading of configuration file" filename=/etc/prometheus/prometheus.yml> Aug 31 19:14:07 debian-bullseye-01 prometheus[1890]: level=info ts=2021-08-31T19:14:07.192Z caller=main.go:784 msg="Server is ready to receive web requests." Access Prometheus web interface on URL http://[ip_hostname]:9090. Step 6: Install node_exporter onDebian 11 / Debian 10 Download node_exporter archive. curl -s https://api.github.com/repos/prometheus/node_exporter/releases/latest| grep browser_download_url|grep linux-amd64|cut -d '"' -f 4|wget -qi - Extract downloaded file and move the binary file to /usr/local/bin. tar -xvf node_exporter*.tar.gz cd node_exporter*/ sudo cp node_exporter /usr/local/bin Confirm installation. $ node_exporter --version node_exporter, version 1.3.0 (branch: HEAD, revision: c65f870ef90a4088210af0319498b832360c3366) build user: root@4801f8f250a6 build date: 20211118-16:34:14 go version: go1.17.3 platform: linux/amd64 Create node_exporter service. sudo tee /etc/systemd/system/node_exporter.service
0 notes
Text
Linux memory monitor

#Linux memory monitor install
most useful 3 groups (CPU, memory and disk) contain: %usr, %system, %guest, %CPU, minflt/s, majflt/s, VSZ, RSS, %MEM, kB_rd/s, kB_wr/s, kB_ccwr/s. It's useful in case when you need extra metrics from the process(es), e.g. Pidstat (part of sysstat package) can produce output that can be easily parsed. Grafana part is the same, except metrics names. Minimal telegraf configuration looks like: Instead of Python script sending the metrics to Statsd, telegraf (and procstat input plugin) can be used to send the metrics to Graphite directly. Then opening Grafana at authentication as admin:admin, setting up datasource you can plot a chart like: $ python procmon.py -s localhost -f chromium -r 'chromium.*'
#Linux memory monitor install
Then in another terminal, after starting target process: $ sudo apt-get install python-statsd python-psutil # or via pip A handy all-in-one raintank/graphite-stack (from Grafana's authors) image and psutil and statsd client. It may seem an overkill for a simple one-off test, but for something like a several-day debugging it's, for sure, reasonable. pip install memory_profilerīy default this pops up a Tkinter-based ( python-tk may be needed) chart explorer which can be exported: It can also record process with its children processes (see mprof -help). The package provides RSS-only sampling (plus some Python-specific options). Psrecord $(pgrep proc-name2) -interval 1 -duration 60 -plot plot2.png & Psrecord $(pgrep proc-name1) -interval 1 -duration 60 -plot plot1.png & Sudo apt-get install python-matplotlib python-tk # for plotting or via pipįor single process it's the following (stopped by Ctrl+C): psrecord $(pgrep proc-name1) -interval 1 -plot plot1.pngįor several processes the following script is helpful to synchronise the charts: #!/bin/bash pip install psrecord # local user install Python psrecord package does exactly this. The following addresses history graph of some sort. Procpath plot -d ff.sqlite -q rss -p 123 -f rss.svgĬharts look like this (they are actually interactive Pygal SVGs): procpath record -i 1 -r 120 -d ff.sqlite '$.children[?("firefox" in RSS and CPU usage of a single process (or several) out of all recorded would look like: procpath plot -d ff.sqlite -q cpu -p 123 -f cpu.svg This records all processes with "firefox" in their cmdline (query by a PID would look like = 42)]') 120 times one time per second. It's a pure-Python CLI package including its couple of dependencies (no heavy Matplotlib), can potentially plot many metrics from procfs, JSONPath queries to the process tree, has basic decimation/aggregation (Ramer-Douglas-Peucker and moving average), filtering by time ranges and PIDs, and a couple of other things. Returning to the problem of process analysis frequently enough and not being satisfied with the solutions I described below originally, I decided to write my own.
0 notes
Text
Utime unix command line

(Not in tcsh.) Average resident set size of the process, in Kbytes.Īverage total (data+stack+text) memory use of the process, in Kbytes.Īverage size of the process's unshared data area, in Kbytes. Maximum resident set size of the process during its lifetime, in Kbytes. Percentage of the CPU that this job got, computed as (%U + %S) / %E. Total number of CPU-seconds that the process spent in user mode. Total number of CPU-seconds that the process spent in kernel mode. (Not in tcsh.) Elapsed real time (in seconds). All of those used by tcsh(1) are supported.Įlapsed real time (in minutes:seconds). The program time will always add a trailing newline itself. Ordinary characters are directly copied, tab, newline and backslash are escaped using , and \,Ī percent sign is represented by %%, and otherwise % indicates a conversion. The format string The format is interpreted in the usual printf-like way. When the -p option is given the (portable) output format %Iinputs+%Ooutputs (%Fmajor+%Rminor)pagefaults %Wswaps %Uuser %Ssystem %Eelapsed %PCPU (%Xtext+%Ddata %Mmax)k Specified using the -f option or the TIME environment variable. The output is formatted using a format string that can be Disregarding the name of the utility, GNU makes it output lots of useful information, not onlyĪbout time used, but also on other resources like memory, I/O and IPC calls (where available). The remaining ones for the text and formatting of the output.īelow a description of the GNU 1.7 version of time. The variables LANG, LC_ALL, LC_CTYPE, LC_MESSAGES, LC_NUMERIC, NLSPATH, and PATH are used. Otherwise it is 127 if command could not be found, 126 if it could be foundīut could not be invoked, and some other nonzero value (1-125) if something else went wrong. If command was invoked, the exit status is that of command. (with numbers in seconds) where the number of decimals in the output for %f is unspecified but is sufficient to express the clock tick accuracy, and at When in the POSIX locale, use the precise traditional format Real command, you may need to specify its pathname (something like /usr/bin/time). Note: some shells (e.g., bash(1)) have a built-in time command that provides less functionality than the command described here. The user CPU time (the sum of the tms_utime and tms_cutime values in a struct tms as returned by times(2)), and (iii) the systemĬPU time (the sum of the tms_stime and tms_cstime values in a struct tms as returned by times(2)). These statistics consist of (i) the elapsed real time between invocation and termination, (ii) Standard error giving timing statistics about this program run. When command finishes, time writes a message to The time command runs the specified program command with the given arguments.
1 note
·
View note
Text
Writing Lua scripts with meta
Sheridan Rawlins, Architect, Yahoo
Summary
In any file ending in .lua with the executable bit set (chmod a+x), putting a "shebang" line like the following lets you run it, and even pass arguments to the script that won't be swallowed by meta
hello-world.lua
#!/usr/bin/env meta print("hello world")
Screwdriver's meta tool is provided to every job, regardless of which image you choose.
This means that you can write Screwdriver commands or helper scripts as Lua programs.
It was inspired by (but unrelated to) etcd's bolt, as meta is a key-value store of sorts, and its boltcli which also provides a lua runner that interfaces with bolt.
Example script or sd-cmd
run.lua
#!/usr/bin/env meta meta.set("a-plain-string-key", "somevalue") meta.set("a-key-for-json-value", { name = "thename", num = 123, array = { "foo", "bar", "baz" } })
What is included?
A Lua 5.1 interpreter written in go (gopher-lua)
meta CLI commands are exposed as methods on the meta object
meta get
local foo_value = meta.get('foo')
meta set
-- plain string meta.set('key', 'value')` -- json number meta.set('key', 123)` -- json array meta.set('key', { 'foo', 'bar', 'baz' })` -- json map meta.set('key', { foo = 'bar', bar = 'baz' })`
meta dump
local entire_meta_tree = meta.dump()
Libraries (aka "modules") included in gopher-lua-libs - while there are many to choose from here, some highlights include:
argparse - when writing scripts, this is a nice CLI parser inspired from the python one.
Encoding modules: json, yaml, and base64 allow you to decode or encode values as needed.
String helper modules: strings, and shellescape
http client - helpful if you want to use the Screwdriver REST API possibly using os.getenv with the environment vars provided by screwdriver - SD_API_URL, SD_TOKEN, SD_BUILD_ID can be very useful.
plugin - is an advanced technique for parallelism by firing up several "workers" or "threads" as "goroutines" under the hood and communicating via go channels. More than likely overkill for normal use-cases, but it may come in handy, such as fetching all artifacts from another job by reading its manifest.txt and fetching in parallel.
Why is this interesting/useful?
meta is atomic
When invoked, meta obtains an advisory lock via flock.
However, if you wanted to update a value from the shell, you might perform two commands and lose the atomicity:
# Note, to treat the value as an integer rather than string, use -j to indicate json declare -i foo_count="$(meta get -j foo_count)" meta set -j foo_count "$((++foo_count))"
While uncommon, if you write builds that do several things in parallel (perhaps a Makefile run with make -j $(nproc)), making such an update in parallel could hit race conditions between the get and set.
Instead, consider this script (or sd-cmd)
increment-key.lua
#!/usr/bin/env meta local argparse = require 'argparse' local parser = argparse(arg[0], 'increment the value of a key') parser:argument('key', 'The key to increment') local args = parser:parse() local value = tonumber(meta.get(args.key)) or 0 value = value + 1 meta.set(args.key, value) print(value)
Which can be run like so, and will be atomic
./increment-key.lua foo 1 ./increment-key.lua foo 2 ./increment-key.lua foo 3
meta is provided to every job
The meta tool is made available to all builds, regardless of the image your build chooses - including minimal jobs intended for fanning in several jobs to a single one for further pipeline job-dependency graphs (i.e. screwdrivercd/noop-container)
Screwdrivers commands can help share common tasks between jobs within an organization. When commands are written in bash, then any callouts it makes such as jq must either exist on the images or be installed by the sd-cmd. While writing in meta's lua is not completely immune to needing "other things", at least it has proper http and json support for making and interpreting REST calls.
running "inside" meta can workaround system limits
Occasionally, if the data you put into meta gets very large, you may encounter Limits on size of arguments and environment, which comes from UNIX systems when invoking executables.
Imagine, for instance, wanting to put a file value into meta (NOTE: this is not a recommendation to put large things in meta, but, on the occasions where you need to, it can be supported). Say I have a file foobar.txt and want to put it into some-key. This code:
foobar="$(< foobar.txt)" meta set some-key "$foobar"
May fail to invoke meta at all if the args get too big.
If, instead, the contents are passed over redirection rather than an argument, this limit can be avoided:
load-file.lua
#!/usr/bin/env meta local argparse = require 'argparse' local parser = argparse(arg[0], 'load json from a file') parser:argument('key', 'The key to put the json in') parser:argument('filename', 'The filename') local args = parser:parse() local f, err = io.open(args.filename, 'r') assert(not err, err) local value = f:read("*a") -- Meta set the key to the contents of the file meta.set(args.key, value)
May be invoked with either the filename or, if the data is in memory with the named stdin device
# Direct from the file ./load-file.lua some-key foobar.txt # If in memory using "Here String" (https://www.gnu.org/software/bash/manual/bash.html#Here-Strings) foobar="$(< foobar.txt)" ./load-file.lua some-key /dev/stdin <<<"$foobar"
Additional examples
Using http module to obtain the parent id
get-parent-build-id.lua
#!/usr/bin/env meta local http = require 'http' local json = require 'json' SD_BUILD_ID = os.getenv('SD_BUILD_ID') or error('SD_BUILD_ID environment variable is required') SD_TOKEN = os.getenv('SD_TOKEN') or error('SD_TOKEN environment variable is required') SD_API_URL = os.getenv('SD_API_URL') or error('SD_API_URL environment variable is required') local client = http.client({ headers = { Authorization = "Bearer " .. SD_TOKEN } }) local url = string.format("%sbuilds/%d", SD_API_URL, SD_BUILD_ID) print(string.format("fetching buildInfo from %s", url)) local response, err = client:do_request(http.request("GET", url)) assert(not err, err) assert(response.code == 200, "error code not ok " .. response.code) local buildInfo = json.decode(response.body) print(tonumber(buildInfo.parentBuildId) or 0)
Invocation examples:
# From a job that is triggered from another job declare -i parent_build_id="$(./get-parent-build-id.lua)" echo "$parent_build_id" 48242862 # From a job that is not triggered by another job declare -i parent_build_id="$(./get-parent-build-id.lua)" echo "$parent_build_id" 0
Larger example to pull down manifests from triggering job in parallel
This advanced script creates 3 argparse "commands" (manifest, copy, and parent-id) to help copying manifest files from parent job (the job that triggers this one).
it demonstrates advanced argparse features, http client, and the plugin module to create a "boss + workers" pattern for parallel fetches:
Multiple workers fetch individual files requested by a work channel
The "boss" (main thread) filters relevent files from the manifest which it sends down the work channel
The "boss" closes the work channel, then waits for all workers to complete tasks (note that a channel will still deliver any elements before a receive() call reports not ok
This improves throughput considerably when fetching many files - from a worst case of the sum of all download times with one at a time, to a best case of just the maximum download time when all are done in parallel and network bandwidth is sufficient.
manifest.lua
#!/usr/bin/env meta -- Imports argparse = require 'argparse' plugin = require 'plugin' http = require 'http' json = require 'json' log = require 'log' strings = require 'strings' filepath = require 'filepath' goos = require 'goos' -- Parse the request parser = argparse(arg[0], 'Artifact operations such as fetching manifest or artifacts from another build') parser:option('-l --loglevel', 'Set the loglevel', 'info') parser:option('-b --build-id', 'Build ID') manifestCommand = parser:command('manifest', 'fetch the manifest') manifestCommand:option('-k --key', 'The key to set information in') copyCommand = parser:command('copy', 'Copy from and to') copyCommand:option('-p --parallelism', 'Parallelism when copying multiple artifacts', 4) copyCommand:flag('-d --dir') copyCommand:argument('source', 'Source file') copyCommand:argument('dest', 'Destination file') parentIdCommand = parser:command("parent-id", "Print the parent-id of this build") args = parser:parse() -- Setup logs is shared with workers when parallelizing fetches function setupLogs(args) -- Setup logs log.debug = log.new('STDERR') log.debug:set_prefix("[DEBUG] ") log.debug:set_flags { date = true } log.info = log.new('STDERR') log.info:set_prefix("[INFO] ") log.info:set_flags { date = true } -- TODO(scr): improve log library to deal with levels if args.loglevel == 'info' then log.debug:set_output('/dev/null') elseif args.loglevel == 'warning' or args.loglevel == 'warning' then log.debug:set_output('/dev/null') log.info:set_output('/dev/null') end end setupLogs(args) -- Globals from env function setupGlobals() SD_API_URL = os.getenv('SD_API_URL') assert(SD_API_URL, 'missing SD_API_URL') SD_TOKEN = os.getenv('SD_TOKEN') assert(SD_TOKEN, 'missing SD_TOKEN') client = http.client({ headers = { Authorization = "Bearer " .. SD_TOKEN } }) end setupGlobals() -- Functions -- getBuildInfo gets the build info json object from the buildId function getBuildInfo(buildId) if not buildInfo then local url = string.format("%sbuilds/%d", SD_API_URL, buildId) log.debug:printf("fetching buildInfo from %s", url) local response, err = client:do_request(http.request("GET", url)) assert(not err, err) assert(response.code == 200, "error code not ok " .. response.code) buildInfo = json.decode(response.body) end return buildInfo end -- getParentBuildId gets the parent build ID from this build’s info function getParentBuildId(buildId) local parentBuildId = getBuildInfo(buildId).parentBuildId assert(parentBuildId, string.format("could not get parendId for %d", buildId)) return parentBuildId end -- getArtifact gets and returns the requested artifact function getArtifact(buildId, artifact) local url = string.format("%sbuilds/%d/artifacts/%s", SD_API_URL, buildId, artifact) log.debug:printf("fetching artifact from %s", url) local response, err = client:do_request(http.request("GET", url)) assert(not err, err) assert(response.code == 200, string.format("error code not ok %d for url %s", response.code, url)) return response.body end -- getManifestLines returns an iterator for the lines of the manifest and strips off leading ./ function getManifestLines(buildId) return coroutine.wrap(function() local manifest = getArtifact(buildId, 'manifest.txt') local manifest_lines = strings.split(manifest, '\n') for _, line in ipairs(manifest_lines) do line = strings.trim_prefix(line, './') if line ~= '' then coroutine.yield(line) end end end) end -- fetchArtifact fetches the artifact "source" and writes to a local file "dest" function fetchArtifact(buildId, source, dest) log.info:printf("Copying %s to %s", source, dest) local sourceContent = getArtifact(buildId, source) local dest_file = io.open(dest, 'w') dest_file:write(sourceContent) dest_file:close() end -- fetchArtifactDirectory fetches all the artifacts matching "source" from the manifest and writes to a folder "dest" function fetchArtifactDirectory(buildId, source, dest) -- Fire up workers to run fetches in parallel local work_body = [[ http = require 'http' json = require 'json' log = require 'log' strings = require 'strings' filepath = require 'filepath' goos = require 'goos' local args, workCh setupLogs, setupGlobals, fetchArtifact, getArtifact, args, workCh = unpack(arg) setupLogs(args) setupGlobals() log.debug:printf("Starting work %p", _G) local ok, work = workCh:receive() while ok do log.debug:print(table.concat(work, ' ')) fetchArtifact(unpack(work)) ok, work = workCh:receive() end log.debug:printf("No more work %p", _G) ]] local workCh = channel.make(tonumber(args.parallelism)) local workers = {} for i = 1, tonumber(args.parallelism) do local worker_plugin = plugin.do_string(work_body, setupLogs, setupGlobals, fetchArtifact, getArtifact, args, workCh) local err = worker_plugin:run() assert(not err, err) table.insert(workers, worker_plugin) end -- Send workers work to do log.info:printf("Copying directory %s to %s", source, dest) local source_prefix = strings.trim_suffix(source, filepath.separator()) .. filepath.separator() for line in getManifestLines(buildId) do log.debug:print(line, source_prefix) if source == '.' or source == '' or strings.has_prefix(line, source_prefix) then local dest_dir = filepath.join(dest, filepath.dir(line)) goos.mkdir_all(dest_dir) workCh:send { buildId, line, filepath.join(dest, line) } end end -- Close the work channel to signal workers to exit log.debug:print('Closing workCh') err = workCh:close() assert(not err, err) -- Wait for workers to exit log.debug:print('Waiting for workers to finish') for _, worker in ipairs(workers) do local err = worker:wait() assert(not err, err) end log.info:printf("Done copying directory %s to %s", source, dest) end -- Normalize/help the buildId by getting the parent build id as a convenience if not args.build_id then SD_BUILD_ID = os.getenv('SD_BUILD_ID') assert(SD_BUILD_ID, 'missing SD_BUILD_ID') args.build_id = getParentBuildId(SD_BUILD_ID) end -- Handle the command if args.manifest then local value = {} for line in getManifestLines(args.build_id) do table.insert(value, line) if not args.key then print(line) end end if args.key then meta.set(args.key, value) end elseif args.copy then if args.dir then fetchArtifactDirectory(args.build_id, args.source, args.dest) else fetchArtifact(args.build_id, args.source, args.dest) end elseif args['parent-id'] then print(getParentBuildId(args.build_id)) end
Testing
In order to test this, bats testing system was used to invoke manifest.lua with various arguments and the return code, output, and side-effects checked.
For unit tests, an http server was fired up to serve static files in a testdata directory, and manifest.lua was actually invoked within this test.lua file so that the http server and the manifest.lua were run in two separate threads (via the plugin module) but the same process (to avoid being blocked by meta's locking mechanism, if run in two processes)
test.lua
#!/usr/bin/env meta -- Because Meta locks, run the webserver as a plugin in the same process, then invoke the actual file under test. local plugin = require 'plugin' local filepath = require 'filepath' local argparse = require 'argparse' local http = require 'http' local parser = argparse(arg[0], 'Test runner that serves http test server') parser:option('-d --dir', 'Dir to serve', filepath.join(filepath.dir(arg[0]), "testdata")) parser:option('-a --addr', 'Address to serve on', "localhost:2113") parser:argument('rest', "Rest of the args") :args '*' local args = parser:parse() -- Run an http server on the requested (or default) addr and dir local http_plugin = plugin.do_string([[ local http = require 'http' local args = unpack(arg) http.serve_static(args.dir, args.addr) ]], args) http_plugin:run() -- Wait for http server to be running and serve status.html local wait_plugin = plugin.do_string([[ local http = require 'http' local args = unpack(arg) local client = http.client() local url = string.format("http://%s/status.html", args.addr) repeat local response, err = client:do_request(http.request("GET", url)) until not err and response.code == 200 ]], args) wait_plugin:run() -- Wait for it to finish up to 2 seconds local err = wait_plugin:wait(2) assert(not err, err) -- With the http server running, run the actual file under test -- Run with a plugin so that none of the plugins used by _this file_ are loaded before invoking dofile local run_plugin = plugin.do_string([[ arg[0] = table.remove(arg, 1) dofile(arg[0]) ]], unpack(args.rest)) run_plugin:run() -- Wait for the run to complete and report errors, if any local err = run_plugin:wait() assert(not err, err) -- Stop the http server for good measure http_plugin:stop()
And the bats test looked something like:
#!/usr/bin/env bats load test-helpers function setup() { mk_temp_meta_dir export SD_META_DIR="$TEMP_SD_META_DIR" export SD_API_URL="http://localhost:2113/" export SD_TOKEN=SD_TOKEN export SD_BUILD_ID=12345 export SERVER_PID="$!" } function teardown() { rm_temp_meta_dir } @test "artifacts with no command is an error" { run "${BATS_TEST_DIRNAME}/run.lua" echo "$status" echo "$output" ((status)) } @test "manifest gets a few files" { run "${BATS_TEST_DIRNAME}/test.lua" -- "${BATS_TEST_DIRNAME}/run.lua" manifest echo "$status" echo "$output" ((!status)) grep foo.txt <<<"$output" grep bar.txt <<<"$output" grep manifest.txt <<<"$output" } @test "copy foo.txt myfoo.txt writes it properly" { run "${BATS_TEST_DIRNAME}/test.lua" -- "${BATS_TEST_DIRNAME}/run.lua" copy foo.txt "${TEMP_SD_META_DIR}/myfoo.txt" echo "$status" echo "$output" ((!status)) [[ $(<"${TEMP_SD_META_DIR}/myfoo.txt") == "foo" ]] } @test "copy bar.txt mybar.txt writes it properly" { run "${BATS_TEST_DIRNAME}/test.lua" -- "${BATS_TEST_DIRNAME}/run.lua" copy bar.txt "${TEMP_SD_META_DIR}/mybar.txt" echo "$status" echo "$output" ((!status)) [[ $(<"${TEMP_SD_META_DIR}/mybar.txt") == "bar" ]] } @test "copy -b 101010 -d somedir mydir writes it properly" { run "${BATS_TEST_DIRNAME}/test.lua" -- "${BATS_TEST_DIRNAME}/run.lua" -l debug copy -b 101010 -d somedir "${TEMP_SD_META_DIR}/mydir" echo "$status" echo "$output" ((!status)) ls -1 "${TEMP_SD_META_DIR}/mydir/somedir" ls -1 "${TEMP_SD_META_DIR}/mydir/somedir" | grep one.txt ls -1 "${TEMP_SD_META_DIR}/mydir/somedir" | grep two.txt (( $(<"${TEMP_SD_META_DIR}/mydir/somedir/one.txt") == 1 )) (( $(<"${TEMP_SD_META_DIR}/mydir/somedir/two.txt") == 2 )) } @test "copy -b 101010 -d . mydir gets all artifacts" { run "${BATS_TEST_DIRNAME}/test.lua" -- "${BATS_TEST_DIRNAME}/run.lua" -l debug copy -b 101010 -d . "${TEMP_SD_META_DIR}/mydir" echo "$status" echo "$output" ((!status)) ls -1 "${TEMP_SD_META_DIR}/mydir/somedir" ls -1 "${TEMP_SD_META_DIR}/mydir/somedir" | grep one.txt ls -1 "${TEMP_SD_META_DIR}/mydir/somedir" | grep two.txt (( $(<"${TEMP_SD_META_DIR}/mydir/somedir/one.txt") == 1 )) (( $(<"${TEMP_SD_META_DIR}/mydir/somedir/two.txt") == 2 )) [[ $(<"${TEMP_SD_META_DIR}/mydir/abc.txt") == abc ]] [[ $(<"${TEMP_SD_META_DIR}/mydir/def.txt") == def ]] (($(find "${TEMP_SD_META_DIR}/mydir" -type f | wc -l) == 5)) } @test "copy -b 101010 -d . -p 1 mydir gets all artifacts" { run "${BATS_TEST_DIRNAME}/test.lua" -- "${BATS_TEST_DIRNAME}/run.lua" -l debug copy -b 101010 -d . -p 1 "${TEMP_SD_META_DIR}/mydir" echo "$status" echo "$output" ((!status)) ls -1 "${TEMP_SD_META_DIR}/mydir/somedir" ls -1 "${TEMP_SD_META_DIR}/mydir/somedir" | grep one.txt ls -1 "${TEMP_SD_META_DIR}/mydir/somedir" | grep two.txt (( $(<"${TEMP_SD_META_DIR}/mydir/somedir/one.txt") == 1 )) (( $(<"${TEMP_SD_META_DIR}/mydir/somedir/two.txt") == 2 )) [[ $(<"${TEMP_SD_META_DIR}/mydir/abc.txt") == abc ]] [[ $(<"${TEMP_SD_META_DIR}/mydir/def.txt") == def ]] (($(find "${TEMP_SD_META_DIR}/mydir" -type f | wc -l) == 5)) } @test "parent-id 12345 gets 99999" { run "${BATS_TEST_DIRNAME}/test.lua" -- "${BATS_TEST_DIRNAME}/run.lua" parent-id -b 12345 echo "$status" echo "$output" ((!status)) (( $output == 99999 )) }
0 notes
Text
Gcc Expert 24 Driver For Mac
If you have the most recent Apple Command Line Tools (macOS 10.nn) for Xcode installed for your operating system version — which you get from developer.apple.com/download/more, then you need a package manager (e.g. homebrew) to install, and compile GCC and all of its dependencies. That compilation process will take at least an hour. After you initially install homebrew (brew):
LG Software, Firmware, & Drivers Download: Optimize your LG devices by downloading the latest drivers and firmware updates. Keep your LG products up-to-date. Driver Gcc Expert 24 Download Download; GCC EXPERT 24 DRIVERS FOR MAC - With the pinch wheels you will loose a little bit off the edges without any additional accessories. User-friendly interface The control panel of Expert II Series is very user-friendly; it comes with the special VLCD software, providing a simple and intuitive workflow for.
# In the bash shell (e.g. .bash_profile), gag Google Analytics in Homebrew.
export HOMEBREW_NO_ANALYTICS=1
brew update

brew upgrade
brew info gcc
brew install gcc
Gcc Expert 24 Software Download
brew cleanup (this removes previous application/dependency revisions saving considerable space)
Gcc Expert 24 Driver For Mac Pro

Gcc Drivers For Windows 10
The gcc application will be installed by default in /usr/local/bin.

Personally, I use Apple's clang/clang++ compilation tools rather than deal with GNU gcc.
Gcc Expert 24 Driver Download
Mar 28, 2018 5:56 PM
0 notes
Text
Unix Executable File Converter For Mac Free

Question or issue on macOS:
Mac Executable File
Unix Executable Mac
Run Unix Executable On Mac
Unix Executable File
I know it, forget it and relearn it again. Time to write it down.
Debian Compressed Archive File. This is a compression format used for Debian packets and other Unix systems. It’s represented as packaged binary files containing information about author privileges, format version numbers, configuration data and other documents needed for installing programs from a packet. I converted AIFF files to mp3 and they sound much better than converted with my old iTunes. The mp3s sound loud, clear, fresh and have a punchy bass. Heavy recommendation guaranteed:-) Ernst M. I just want to congratulate you for the MediaHuman Audio Converter. Variety of choices for audio quality, file extension type and multiple cpu core choice.
In the Terminal app on your Mac, use the cd command to move into the directory that contains the file you want to make executable. For example:% cd YourScriptDirectory. Enter the chmod command. For example:% chmod 755 YourScriptName.sh. After making the shell script file executable, you can run it by entering its pathname. Aneesoft Free RM Video Converter for Windows is an easy-to-use and totally free RM video converter that can convert all popular video fIles including HD video to RM formats. The freeware supports the most common video formats, including MKV, M4V. File Name:FreeRMVideoConverter.exe. Author: Aneesoft. Conversion of exe files to mp4 file format. EXE files are typically just program executables and not actually videos, so in most cases exe to mp4 conversion does not work. Flash videos are occasionally compiled as.exe files and this might be actually the only type that could be converted to MP4 format.
How to solve this problem?

Solution no. 1:
To run a non-executable sh script, use:
To run a non-executable bash script, use:
To start an executable (which is any file with executable permission); you just specify it by its path:
To make a script executable, give it the necessary permission:

When a file is executable, the kernel is responsible for figuring out how to execte it. For non-binaries, this is done by looking at the first line of the file. It should contain a hashbang:
The hashbang tells the kernel what program to run (in this case the command /usr/bin/env is ran with the argument bash). Then, the script is passed to the program (as second argument) along with all the arguments you gave the script as subsequent arguments.
That means every script that is executable should have a hashbang. If it doesn’t, you’re not telling the kernel what it is, and therefore the kernel doesn’t know what program to use to interprete it. It could be bash, perl, python, sh, or something else. (In reality, the kernel will often use the user’s default shell to interprete the file, which is very dangerous because it might not be the right interpreter at all or it might be able to parse some of it but with subtle behavioural differences such as is the case between sh and bash).
A note on /usr/bin/env
Most commonly, you’ll see hash bangs like so:

The result is that the kernel will run the program /bin/bash to interpret the script. Unfortunately, bash is not always shipped by default, and it is not always available in /bin. While on Linux machines it usually is, there are a range of other POSIX machines where bash ships in various locations, such as /usr/xpg/bin/bash or /usr/local/bin/bash.
To write a portable bash script, we can therefore not rely on hard-coding the location of the bash program. POSIX already has a mechanism for dealing with that: PATH. The idea is that you install your programs in one of the directories that are in PATH and the system should be able to find your program when you want to run it by name.
Sadly, you cannot just do this:
The kernel won’t (some might) do a PATH search for you. There is a program that can do a PATH search for you, though, it’s called env. Luckily, nearly all systems have an env program installed in /usr/bin. So we start env using a hardcoded path, which then does a PATH search for bash and runs it so that it can interpret your script:
This approach has one downside: According to POSIX, the hashbang can have one argument. In this case, we use bash as the argument to the env program. That means we have no space left to pass arguments to bash. So there’s no way to convert something like #!/bin/bash -exu to this scheme. You’ll have to put set -exu after the hashbang instead.
This approach also has another advantage: Some systems may ship with a /bin/bash, but the user may not like it, may find it’s buggy or outdated, and may have installed his own bash somewhere else. This is often the case on OS X (Macs) where Apple ships an outdated /bin/bash and users install an up-to-date /usr/local/bin/bash using something like Homebrew. When you use the env approach which does a PATH search, you take the user’s preference into account and use his preferred bash over the one his system shipped with.
Solution no. 2:
To start the shell-script ‘file.sh’:
Another option is set executable permission using chmod command:
Now run .sh file as follows:
Solution no. 3:
For the bourne shell:
For bash:
Solution no. 4:
If you want the script to run in the current shell (e.g. you want it to be able to affect your directory or environment) you should say:
or
Note that /path/to/script.sh can be relative, for instance . bin/script.sh runs the script.sh in the bin directory under the current directory.
Solution no. 5:
First, give permission for execution:- chmod +x script_name
If script is not executable:- For running sh script file:- sh script_name For running bash script file:- bash script_name
If script is executable:- ./script_name
NOTE:-you can check if the file is executable or not by using ‘ls -a’
Solution no. 6:
The file extension .command is assigned to Terminal.app. Double-clicking on any .command file will execute it.
Mac Executable File
Solution no. 7:
Unix Executable Mac
Little addition, to run an interpreter from the same folder, still using #!hashbang in scripts.
As example a php7.2 executable copied from /usr/bin is in a folder along a hello script.
To run it:
Run Unix Executable On Mac
Which behave just as equal as:
The proper solutions with good documentation can be the tools linuxdeploy and/or appimage, this is using this method under the hood.
Unix Executable File
Hope this helps!
0 notes
Text
Solid Work For Mac

Mac set environment variable for java. Hi all – i tried the above sequence of steps – below output: Michaels-MacBook-Pro: mhasse$ $ vim.bashprofile-bash: $: command not found. Trying to run a Java application on your Mac and need to set your JAVAHOME? Follow the instructions below to quickly and easily do it: Open Terminal Confirm you have JDK by typing “which java”. It should show something like /usr/bin/java. Check you have the needed version of Java, by typing “java -version”. I want to add an environment variable ENVVAR=12345 to my Mac, so that I can import it into a Python module using os.environ'ENVVAR' The most relevant tutorial I have found is this, but it doesn't quite do the trick for me. A lot of others tell you how to temporarily add environment variables to bash, but I don't think this is good enough. Mkyong.com: How to set JAVAHOME variable in Mac OSX. YouTube: How to set environment variables on mac, linux, solaris, rhel. YouTube: How to Set Environment Variables in Mac. I was able to locate the terminal and I think I created some multiple files. I'm getting messages like this. Setting environment variables. For the tcsh shell, the format for setting an environment variable is setenv KEY value. The following is an example which will set the JAVAHOME variable to /Library/Java/Home.
As of 2007 there doesn't appear to be an official Microsoft Access version available for Mac. Parallels works great, but it's not a good solution for programmatic access (and you have to buy Access and Windows to install on your Mac). Alternatives to Microsoft Access on the Mac File Maker Pro. FileMaker is probably the best known database application for the Mac. It has a feature set comparable to Microsoft Access, but with a strong focus on forms (layouts) as the primary way of accessing databases. Knack is the best database software for Mac users by some distance. Knack is everything. Install microsoft access on mac. Microsoft 365 for Mac. Do your best work with Office apps in Microsoft 365—anywhere, anytime, with anyone. For home For business Get Office apps for Mac. Start quickly with the most recent versions of Word, Excel, PowerPoint, Outlook, OneNote and OneDrive —combining the familiarity of Office and the unique Mac features you love. Microsoft access mac free download - Microsoft Virtual PC for Mac 7.0.3 Update, Microsoft Virtual PC for Mac Update, Parallels Desktop for Mac, and many more programs.
Download new versions, service packs, and add-ins for SOLIDWORKS, Simulation, PDM, and Free CAD Tools (eDrawings, Composer Player, SOLIDWORKS Explorer). We are often asked if it is possible to run SOLIDWORKS on a Mac computer - find out in this video. Don't forget to check out our blog here for more informati. Running Parallels on a Mac is really convenient as you can seamlessly switch between Windows and Mac OS when needed. Unfortunately, it really stretches the capabilities of most machines to run both Mac OS and Windows as well as a heavy-duty program like SOLIDWORKS at the same time. โปรแกรม solidworks มีของ mac ไหมคะ. วิศวะ ปี2 ค่ะ กำลังเรียน Autocad เทอมหน้าเรียน solid work แล้วกำลังจะซื้อโน้ตบุ๊คค่ะ เลยอยากมาให้ช่วยแนะนำ.
Solidworks For Macbook
We are often asked if it is possible to run SOLIDWORKS on a Mac computer – the answer is YES you can! Watch our video summary to find out how.
We know quite a few users running SOLIDWORKS successfully on a Mac, and SOLIDWORKS recently updated their system requirements to include virtualisation such as parallels. However, the limit of this support is that although it will install, it may not run well as Macs rarely have supported graphics cards.
We therefore would NOT recommend this setup above a Windows based professional workstation.
Although SOLIDWORKS will run on OS X there are some major considerations to be aware of. SOLIDWORKS cannot run directly on macOS, so first you will need to install Windows on your Mac using an application such as Boot Camp or Parallels. There are other considerations such as graphics performance and the applications you are using SOLIDWORKS for. Watch the video above for a guide to this, alternatively, visit the original Solid Solutions article here.
Other SOLIDWORKS Applications for Mac
SOLIDWORKS do develop several other applications that are available for macOS and iOS. This includes eDrawings Viewer for macOS, as well as eDrawings and eDrawings Professional for iOS. DraftSight is also available for macOS as a beta version.
If you’re currently using SOLIDWORKS and considering a move to Apple hardware, or if you’re currently an Apple user and are considering SOLIDWORKS, we suggest contacting your local reseller (UK and Ireland) to discuss the pros and cons of using SOLIDWORKS on mac OS before making any final decisions.
Learn more about hardware and system requirements. Find your local educational reseller here.
Solid Solutions Management Ltd was founded in 1998, originally as a SOLIDWORKS training and support provider. Now a Group with over 20 offices across the UK and Ireland, Solid Solutions is not only the leading SOLIDWORKS 3D CAD reseller in both regions, it also offers expert professional design solutions and consultancy services to more than 15,000+ customers. With over 200 employees and the largest SOLIDWORKS technical team in the world, Solid Solutions is focused on growth and on its customers’ development and success.
Latest posts by Solid Solutions Technical Team (see all)
Run SOLIDWORKS on a Mac - April 16, 2019
This is a fairly long-standing issue we come up against on the Innova Systems technical support desk, and also while talking to prospective customers about SOLIDWORKS. The simple answer is that SOLIDWORKS do not develop an Apple Mac version of the software, so we can’t install SOLIDWORKS natively.
We used to recommend the Bootcamp route, which involves installation of Bootcamp and then Microsoft Windows on the partition Bootcamp creates. The issue here is that if you need to access the Apple Mac Operating System (OS), you would need to shut down windows and boot up the Apple Mac OS, because they cannot be running simultaneously. This allows the full use of the hardware (RAM and graphics card) you have in your Apple Mac for Windows.
The alternative solution that we used to steer people away from is Parallels, a virtual machine software that allows you to run another OS inside the Mac OS (inside a window). The reason for not recommending this is that you are sharing the resource of the machine with two operating systems, thus not necessarily having the required resource to run a demanding program like SOLIDWORKS.
There were also historic problems with not being able to use the graphics card properly which would result in exceptionally slow performance when selecting things. This is due to most Macs not having certified graphics cards for SOLIDWORKS and parallels using a virtual graphics card driver or the default Windows driver. The virtual or generic drivers don’t offer the level of performance needed to run SOLIDWORKS correctly.
Innova Systems Technical Director, Ed Hawkins, explains
We have now installed and configured this on over 20 users’ Apple Mac computers and I have to say the response from these people has been amazing.
I have a mid 2014 MacBook Pro, which I’ve been using as a test bed. The specs are listed below:
You will note that this machine has Intel Iris Graphics (specific to the Mac) and not a certified graphics card for SOLIDWORKS.
So, I installed the latest version of Parallels (version 10) and a fresh copy of Windows 10 into the virtual environment and then set about making SOLIDWORKS work!
It’s pretty easy to get Windows installed, as Parallels guides you through that process very nicely. You can specify how much of the machine’s resource to give to the Windows OS – which is where a high spec Mac will stand you in better stead. It is always a good rule of thumb to assign half the available RAM to the Windows OS, so in my set up, I assigned 4GB of RAM.
The difficult bit is making the “Use Software OpenGL” button inside SOLIDWORKS become accessible. When you first install SOLIDWORKS, this button is ticked and greyed out, so we can’t turn it off. In our opinion, SOLIDWORKS is unusable at this point, as selecting geometry and navigating the software is too slow to be productive.
With a bit of effort, and some registry modifications, I was able to untick the OpenGL box, allowing us to use the graphics card to a much higher potential. The difference in performance was huge, and it allowed me to select and navigate the software much, much faster. One limitation that frustrated me early on was the lack of RealView Graphics (Accurate reflections and appearances), so I set about solving this problem too. I’m happy to report that RealView works perfectly on a properly specced Mac Book Pro!
Of course, this isn’t necessarily a new solution – Parallels has been around for some time, and installing Windows on a Mac for as long. The difference with our solution is that we can make SOLIDWORKS behave as well as a normal windows PC. No more slow selecting or poor rotational speed.
Above is a screenshot of the working set up, albeit in Window mode, not full screen. I have this running at a resolution of 2560 x 1600 in full screen mode and it is functioning very well. Please note: the specification of my Mac, and the resource I can assign to Windows is far from ideal. It would be recommended for people who are creating fairly simple parts with up to 100 features, and assemblies containing up to 500 components. Any more than that, and I think it would struggle.
In summary, the Parallels solution is now recommended by Innova Systems. We are confident of this working well in a production environment, but the spec of the Mac is key to the success. Along with our modifications to the registry in Windows, of course.
Video: See SOLIDWORKS running on Apple Mac
Video: How to run SOLIDWORKS on Apple Mac Computers

Get in touch with us to find out more
Are you based in the UK and interested in running SOLIDWORKS on your Apple Mac? We can demonstrate our configuration to you via a Team Viewer session, or if you prefer and are interested in purchasing SOLIDWORKS we can come out and show you live with some of your data.
Call us on (01223) 200690 or complete this form to organise a consultation
Solidworks For Macbook
Editor’s note: This post was originally published in August 2015 and has been updated to feature new information on our process.
0 notes
Text
12 Terminal Commands
Every Web Developer Should Know
The terminal is one of the foremost vital productivity tools in a developer's arsenal. Mastering it will have an awfully positive impact on your work flow, as several everyday tasks get reduced to writing a straightforward command and striking Enter. In this article we've ready for you a set of UNIX system commands that may assist you get the foremost out of your terminal. a number of them square measure inbuilt, others square measure free tools that square measure reliable and may be put in but a moment.
Curl
Curl may be a program line tool for creating requests over HTTP(s), FTP and dozens of different protocols you will haven't detected concerning. It will transfer files, check response headers, and freely access remote information.
In net development curl is usually used for testing connections and dealing with RESTful APIs.
# Fetch the headers of a URL. curl -I http://google.com HTTP/1.1 302 Found Cache-Control: private Content-Type: text/html; charset=UTF-8 Referrer-Policy: no-referrer Location: http://www.google.com/?gfe_rd=cr&ei=0fCKWe6HCZTd8AfCoIWYBQ Content-Length: 258 Date: Wed, 09 Aug 2017 11:24:01 GMT # Make a GET request to a remote API. curl http://numbersapi.com/random/trivia 29 is the number of days it takes Saturn to orbit the Sun.
Curl commands can get much more complicated than this. There are tons of options for controlling headers, cookies, authentication,and more.
Tree
Tree may be a little instruction utility that shows you a visible illustration of the files during a directory. It works recursively, going over every level of nesting and drawing a formatted tree of all the contents. this fashion you'll quickly skim and notice the files you're trying to find.
tree . ├── css │ ├── bootstrap.css │ ├── bootstrap.min.css ├── fonts │ ├── glyphicons-halflings-regular.eot │ ├── glyphicons-halflings-regular.svg │ ├── glyphicons-halflings-regular.ttf │ ├── glyphicons-halflings-regular.woff │ └── glyphicons-halflings-regular.woff2 └── js ├── bootstrap.js └── bootstrap.min.js
There is also the option to filter the results using a simple regEx-like pattern:
tree -P '*.min.*' . ├── css │ ├── bootstrap.min.css ├── fonts └── js └── bootstrap.min.js
Tmux
According to its Wiki, Tmux may be a terminal electronic device, that translated in human language would mean that it is a tool for connecting multiple terminals to one terminal session.
It helps you to switch between programs in one terminal, add split screen panes, and connect multiple terminals to a similar session, keeping them in adjust. Tmux is particularly helpful once functioning on a far off server, because it helps you to produce new tabs while not having to log in once more.
Disk usage - du
The du command generates reports on the area usage of files and directories. it's terribly straightforward to use and may work recursively, rummaging every directory and returning the individual size of each file. A common use case for du is once one in every of your drives is running out of area and you do not understand why. Victimization this command you'll be able to quickly see what proportion storage every folder is taking, therefore finding the most important memory saver.
# Running this will show the space usage of each folder in the current directory. # The -h option makes the report easier to read. # -s prevents recursiveness and shows the total size of a folder. # The star wildcard (*) will run du on each file/folder in current directory. du -sh * 1.2G Desktop 4.0K Documents 40G Downloads 4.0K Music 4.9M Pictures 844K Public 4.0K Templates 6.9M Videos
There is also a similar command called
df
(Disk Free) which returns various information about the available disk space (the opposite of du).
Git
Git is far and away the foremost standard version system immediately. It’s one among the shaping tools of contemporary internet dev and that we simply could not leave it out of our list. There area unit many third-party apps and tools on the market however most of the people choose to access unpleasant person natively although the terminal. The unpleasant person CLI is basically powerful and might handle even the foremost tangled project history.
Tar
Tar is the default Unix tool for working with file archives. It allows you to quickly bundle multiple files into one package, making it easier to store and move them later on.
tar -cf archive.tar file1 file2 file3
Using the -x option it can also extract existing .tar archives.
tar -xf archive.tar
Note that almost all alternative formats like .zip and .rar can't be opened by tar and need alternative command utilities like unfasten.
Many trendy operating system systems run associate expanded version of tar (GNU tar) that may additionally perform file size compression:
# Create compressed gzip archive. tar -czf file.tar.gz inputfile1 inputfile2 # Extract .gz archive. tar -xzf file.tar.gz
If your OS doesn't have that version of tar, you can use
gzip
,
zcat
or
compress
to reduce the size of file archives.
md5sum
Unix has many inbuilt hashing commands together with
md5sum
,
sha1sum
and others. These program line tools have varied applications in programming, however most significantly they'll be used for checking the integrity of files. For example, if you've got downloaded associate degree .iso file from associate degree untrusted supply, there's some likelihood that the file contains harmful scripts. To form positive the .iso is safe, you'll generate associate degree md5 or alternative hash from it.
md5sum ubuntu-16.04.3-desktop-amd64.iso 0d9fe8e1ea408a5895cbbe3431989295 ubuntu-16.04.3-desktop-amd64.iso
You can then compare the generated string to the one provided from the first author (e.g. UbuntuHashes).
Htop
Htop could be a a lot of powerful different to the intrinsic prime task manager. It provides a complicated interface with several choices for observation and dominant system processes.
Although it runs within the terminal, htop has excellent support for mouse controls. This makes it a lot of easier to navigate the menus, choose processes, and organize the tasks thought sorting and filtering.
Ln
Links in UNIX operating system square measure the same as shortcuts in Windows, permitting you to urge fast access to bound files. Links square measure created via the ln command and might be 2 types: arduous or symbolic. Every kind has totally different properties and is employed for various things (read more).
Here is associate example of 1 of the various ways that you'll be able to use links. as an instance we've a directory on our desktop referred to as Scripts. It contains showing neatness organized bash scripts that we have a tendency to ordinarily use. on every occasion we wish to decision one in every of our scripts we'd need to do this:
~/Desktop/Scripts/git-scripts/git-cleanup
Obviously, this is isn't very convinient as we have to write the absolute path every time. Instead we can create a symlink from our Scripts folder to /usr/local/bin, which will make the scripts executable from all directories.
sudo ln -s ~/Desktop/Scripts/git-scripts/git-cleanup /usr/local/bin/
With the created symlink we can now call our script by simply writing its name in any opened terminal.
git-cleanup
SSH
With the ssh command users will quickly hook up with a foreign host and log into its UNIX operating system shell. This makes it doable to handily issue commands on the server directly from your native machine's terminal.
To establish a association you just got to specify the proper science address or URL. The primary time you hook up with a replacement server there'll be some style of authentication.
ssh username@remote_host
If you want to quickly execute a command on the server without logging in, you can simply add a command after the url. The command will run on the server and the result from it will be returned.
ssh username@remote_host ls /var/www some-website.com some-other-website.com
There is a lot you can do with SSH like creating proxies and tunnels, securing your connection with private keys, transferring files and more.
Grep
Grep is the standard Unix utility for finding strings inside text. It takes an input in the form of a file or direct stream, runs its content through a regular expression, and returns all the matching lines.
This command comes in handy once operating with massive files that require to be filtered. Below we tend to use grep together with the date command to look through an oversized log file and generate a brand new file containing solely errors from nowadays.
// Search for today's date (in format yyyy-mm-dd) and write the results to a new file. grep "$(date +"%Y-%m-%d")" all-errors-ever.log > today-errors.log
Another nice command for operating with strings is
sed
. It’s additional powerful (and additional complicated) than grep and may perform nearly any string-related task together with adding, removing or replacement strings.
Alias
Many OS commands, together with some featured during this article, tend to urge pretty long when you add all the choices to them. to create them easier to recollect, you'll produce short aliases with the alias bash inbuilt command:
# Create an alias for starting a local web server. alias server="python -m SimpleHTTPServer 9000" # Instead of typing the whole command simply use the alias. server Serving HTTP on 0.0.0.0 port 9000 ...
The alias are offered as long as you retain that terminal open. to create it permanent you'll add the alias command to your .bashrc file. We will be happy to answer your questions on designing, developing, and deploying comprehensive enterprise web, mobile apps and customized software solutions that best fit your organization needs.
As a reputed Software Solutions Developer we have expertise in providing dedicated remote and outsourced technical resources for software services at very nominal cost. Besides experts in full stacks We also build web solutions, mobile apps and work on system integration, performance enhancement, cloud migrations and big data analytics. Don’t hesitate to
get in touch with us!
#b2bservices
#b2b ecommerce
#b2bsales
#b2b seo
#Ecommerce
0 notes
Text
12 Terminal Commands
Every Web Developer Should Know
The terminal is one of the foremost vital productivity tools in a developer's arsenal. Mastering it will have an awfully positive impact on your work flow, as several everyday tasks get reduced to writing a straightforward command and striking Enter. In this article we've ready for you a set of UNIX system commands that may assist you get the foremost out of your terminal. a number of them square measure inbuilt, others square measure free tools that square measure reliable and may be put in but a moment.
Curl
Curl may be a program line tool for creating requests over HTTP(s), FTP and dozens of different protocols you will haven't detected concerning. It will transfer files, check response headers, and freely access remote information.
In net development curl is usually used for testing connections and dealing with RESTful APIs.
# Fetch the headers of a URL. curl -I http://google.com HTTP/1.1 302 Found Cache-Control: private Content-Type: text/html; charset=UTF-8 Referrer-Policy: no-referrer Location: http://www.google.com/?gfe_rd=cr&ei=0fCKWe6HCZTd8AfCoIWYBQ Content-Length: 258 Date: Wed, 09 Aug 2017 11:24:01 GMT # Make a GET request to a remote API. curl http://numbersapi.com/random/trivia 29 is the number of days it takes Saturn to orbit the Sun.
Curl commands can get much more complicated than this. There are tons of options for controlling headers, cookies, authentication,and more.
Tree
Tree may be a little instruction utility that shows you a visible illustration of the files during a directory. It works recursively, going over every level of nesting and drawing a formatted tree of all the contents. this fashion you'll quickly skim and notice the files you're trying to find.
tree . ├── css │ ├── bootstrap.css │ ├── bootstrap.min.css ├── fonts │ ├── glyphicons-halflings-regular.eot │ ├── glyphicons-halflings-regular.svg │ ├── glyphicons-halflings-regular.ttf │ ├── glyphicons-halflings-regular.woff │ └── glyphicons-halflings-regular.woff2 └── js ├── bootstrap.js └── bootstrap.min.js
There is also the option to filter the results using a simple regEx-like pattern:
tree -P '*.min.*' . ├── css │ ├── bootstrap.min.css ├── fonts └── js └── bootstrap.min.js
Tmux
According to its Wiki, Tmux may be a terminal electronic device, that translated in human language would mean that it is a tool for connecting multiple terminals to one terminal session.
It helps you to switch between programs in one terminal, add split screen panes, and connect multiple terminals to a similar session, keeping them in adjust. Tmux is particularly helpful once functioning on a far off server, because it helps you to produce new tabs while not having to log in once more.
Disk usage - du
The du command generates reports on the area usage of files and directories. it's terribly straightforward to use and may work recursively, rummaging every directory and returning the individual size of each file. A common use case for du is once one in every of your drives is running out of area and you do not understand why. Victimization this command you'll be able to quickly see what proportion storage every folder is taking, therefore finding the most important memory saver.
# Running this will show the space usage of each folder in the current directory. # The -h option makes the report easier to read. # -s prevents recursiveness and shows the total size of a folder. # The star wildcard (*) will run du on each file/folder in current directory. du -sh * 1.2G Desktop 4.0K Documents 40G Downloads 4.0K Music 4.9M Pictures 844K Public 4.0K Templates 6.9M Videos
There is also a similar command called
df
(Disk Free) which returns various information about the available disk space (the opposite of du).
Git
Git is far and away the foremost standard version system immediately. It’s one among the shaping tools of contemporary internet dev and that we simply could not leave it out of our list. There area unit many third-party apps and tools on the market however most of the people choose to access unpleasant person natively although the terminal. The unpleasant person CLI is basically powerful and might handle even the foremost tangled project history.
Tar
Tar is the default Unix tool for working with file archives. It allows you to quickly bundle multiple files into one package, making it easier to store and move them later on.
tar -cf archive.tar file1 file2 file3
Using the -x option it can also extract existing .tar archives.
tar -xf archive.tar
Note that almost all alternative formats like .zip and .rar can't be opened by tar and need alternative command utilities like unfasten.
Many trendy operating system systems run associate expanded version of tar (GNU tar) that may additionally perform file size compression:
# Create compressed gzip archive. tar -czf file.tar.gz inputfile1 inputfile2 # Extract .gz archive. tar -xzf file.tar.gz
If your OS doesn't have that version of tar, you can use
gzip
,
zcat
or
compress
to reduce the size of file archives.
md5sum
Unix has many inbuilt hashing commands together with
md5sum
,
sha1sum
and others. These program line tools have varied applications in programming, however most significantly they'll be used for checking the integrity of files. For example, if you've got downloaded associate degree .iso file from associate degree untrusted supply, there's some likelihood that the file contains harmful scripts. To form positive the .iso is safe, you'll generate associate degree md5 or alternative hash from it.
md5sum ubuntu-16.04.3-desktop-amd64.iso 0d9fe8e1ea408a5895cbbe3431989295 ubuntu-16.04.3-desktop-amd64.iso
You can then compare the generated string to the one provided from the first author (e.g. UbuntuHashes).
Htop
Htop could be a a lot of powerful different to the intrinsic prime task manager. It provides a complicated interface with several choices for observation and dominant system processes.
Although it runs within the terminal, htop has excellent support for mouse controls. This makes it a lot of easier to navigate the menus, choose processes, and organize the tasks thought sorting and filtering.
Ln
Links in UNIX operating system square measure the same as shortcuts in Windows, permitting you to urge fast access to bound files. Links square measure created via the ln command and might be 2 types: arduous or symbolic. Every kind has totally different properties and is employed for various things (read more).
Here is associate example of 1 of the various ways that you'll be able to use links. as an instance we've a directory on our desktop referred to as Scripts. It contains showing neatness organized bash scripts that we have a tendency to ordinarily use. on every occasion we wish to decision one in every of our scripts we'd need to do this:
~/Desktop/Scripts/git-scripts/git-cleanup
Obviously, this is isn't very convinient as we have to write the absolute path every time. Instead we can create a symlink from our Scripts folder to /usr/local/bin, which will make the scripts executable from all directories.
sudo ln -s ~/Desktop/Scripts/git-scripts/git-cleanup /usr/local/bin/
With the created symlink we can now call our script by simply writing its name in any opened terminal.
git-cleanup
SSH
With the ssh command users will quickly hook up with a foreign host and log into its UNIX operating system shell. This makes it doable to handily issue commands on the server directly from your native machine's terminal.
To establish a association you just got to specify the proper science address or URL. The primary time you hook up with a replacement server there'll be some style of authentication.
ssh username@remote_host
If you want to quickly execute a command on the server without logging in, you can simply add a command after the url. The command will run on the server and the result from it will be returned.
ssh username@remote_host ls /var/www some-website.com some-other-website.com
There is a lot you can do with SSH like creating proxies and tunnels, securing your connection with private keys, transferring files and more.
Grep
Grep is the standard Unix utility for finding strings inside text. It takes an input in the form of a file or direct stream, runs its content through a regular expression, and returns all the matching lines.
This command comes in handy once operating with massive files that require to be filtered. Below we tend to use grep together with the date command to look through an oversized log file and generate a brand new file containing solely errors from nowadays.
// Search for today's date (in format yyyy-mm-dd) and write the results to a new file. grep "$(date +"%Y-%m-%d")" all-errors-ever.log > today-errors.log
Another nice command for operating with strings is
sed
. It’s additional powerful (and additional complicated) than grep and may perform nearly any string-related task together with adding, removing or replacement strings.
Alias
Many OS commands, together with some featured during this article, tend to urge pretty long when you add all the choices to them. to create them easier to recollect, you'll produce short aliases with the alias bash inbuilt command:
# Create an alias for starting a local web server. alias server="python -m SimpleHTTPServer 9000" # Instead of typing the whole command simply use the alias. server Serving HTTP on 0.0.0.0 port 9000 ...
The alias are offered as long as you retain that terminal open. to create it permanent you'll add the alias command to your .bashrc file. We will be happy to answer your questions on designing, developing, and deploying comprehensive enterprise web, mobile apps and customized software solutions that best fit your organization needs.
As a reputed Software Solutions Developer we have expertise in providing dedicated remote and outsourced technical resources for software services at very nominal cost. Besides experts in full stacks We also build web solutions, mobile apps and work on system integration, performance enhancement, cloud migrations and big data analytics. Don’t hesitate to
get in touch with us!
0 notes
Text
This is the continuation of our guides on Smart Infrastructure monitoring with Grafana, InfluxDB, Prometheus, and Telegraf. We have already covered how to Install Grafana and InfluxDB on CentOS 7. As part of server preparation, we’ll look at how to Install Prometheus Server on CentOS 7 / RHEL 7 Linux system. For the record, all servers in my Lab will be running CentOS 7, but other servers to be monitored will be running Ubuntu, Fedora, Debian, Arch and even Windows servers e.t.c. So for this, I assume you have a server (VM) or LXC container running CentOS 7.x. 1. Prepare Server for Prometheus installation We’ll have to perform a number of actions before installing Prometheus server on CentOS 7 / RHEL 7 Linux system. Create Prometheus system group Let’s start by creating the Prometheus system group. You need to use the option -r or –system with groupadd command. sudo groupadd --system prometheus The group with ID < 1000 is a system group. Create Prometheus system user Let’s now create Prometheus system user and assign primary group we just created above. sudo useradd -s /sbin/nologin --system -g prometheus prometheus This is a system user which doesn’t need /bin/bash shell, that’s why we used -s /sbin/nologin. Create data directory for Prometheus Prometheus needs a directory to store its data. We will create one under /var/lib/prometheus. We will specify this data directory when starting the service. sudo mkdir /var/lib/prometheus Create configuration directories for Prometheus Prometheus primary configuration files directory is /etc/prometheus/. It will have some sub-directories. for i in rules rules.d files_sd; do sudo mkdir -p /etc/prometheus/$i; done 2. Download and Install Prometheus Server We need to download the latest release of Prometheus archive and extract it to get binary files. You can check releases from Prometheus releases Github page. Install wget. # RHEL family sudo yum -y install wget # Debian family sudo apt-get -y install wget The download latest binary archive for Prometheus. mkdir -p /tmp/prometheus && cd /tmp/prometheus curl -s https://api.github.com/repos/prometheus/prometheus/releases/latest \ | grep browser_download_url \ | grep linux-amd64 \ | cut -d '"' -f 4 \ | wget -qi - Extract the file. tar xvf prometheus*.tar.gz cd prometheus*/ Move the prometheus binary files to /usr/local/bin/ Since /usr/local/bin/ is in your PATH, let’s copy binary files to it. sudo mv prometheus promtool /usr/local/bin/ Move prometheus configuration template to /etc directory. sudo mv prometheus.yml /etc/prometheus/prometheus.yml Also move consoles and console_libraries to /etc/prometheus directory: sudo mv consoles/ console_libraries/ /etc/prometheus/ cd ~/ rm -rf /tmp/prometheus Create/Edit a Prometheus configuration file Prometheus configuration file will be located under /etc/prometheus/prometheus.yml. sudo vim /etc/prometheus/prometheus.yml The template configurations should look similar to below: # my global config global: scrape_interval: 15s # Set the scrape interval to every 15 seconds. Default is every 1 minute. evaluation_interval: 15s # Evaluate rules every 15 seconds. The default is every 1 minute. # scrape_timeout is set to the global default (10s). # Alertmanager configuration alerting: alertmanagers: - static_configs: - targets: # - alertmanager:9093 # Load rules once and periodically evaluate them according to the global 'evaluation_interval'. rule_files: # - "first_rules.yml" # - "second_rules.yml" # A scrape configuration containing exactly one endpoint to scrape: # Here it's Prometheus itself. scrape_configs: # The job name is added as a label `job=` to any timeseries scraped from this config. - job_name: 'prometheus' # metrics_path defaults to '/metrics' # scheme defaults to 'http'. static_configs: - targets: ['localhost:9090'] You can edit the file to your default liking and save
it. 3. Create Prometheus systemd Service unit file To be able to manage Prometheus service with systemd, you need to explicitly define this unit file. $ sudo vim /etc/systemd/system/prometheus.service [Unit] Description=Prometheus Documentation=https://prometheus.io/docs/introduction/overview/ Wants=network-online.target After=network-online.target [Service] Type=simple Environment="GOMAXPROCS=1" User=prometheus Group=prometheus ExecReload=/bin/kill -HUP $MAINPID ExecStart=/usr/local/bin/prometheus \ --config.file=/etc/prometheus/prometheus.yml \ --storage.tsdb.path=/var/lib/prometheus \ --web.console.templates=/etc/prometheus/consoles \ --web.console.libraries=/etc/prometheus/console_libraries \ --web.listen-address=0.0.0.0:9090 \ --web.external-url= SyslogIdentifier=prometheus Restart=always [Install] WantedBy=multi-user.target Remember to edit the line: Environment="GOMAXPROCS=1 Replace 1 with the number of vcpus on your server. 4. Set Permissions, Firewall and Start Prometheus Service Change the ownership of these directories to Prometheus user and group. for i in rules rules.d files_sd; do sudo chown -R prometheus:prometheus /etc/prometheus/$i; done for i in rules rules.d files_sd; do sudo chmod -R 775 /etc/prometheus/$i; done sudo chown -R prometheus:prometheus /var/lib/prometheus/ Start and enable prometheus service: sudo systemctl daemon-reload sudo systemctl start prometheus sudo systemctl enable prometheus Check status using systemctl status prometheus command: systemctl status prometheus See screenshot below. Open a port on the firewall. sudo firewall-cmd --add-port=9090/tcp --permanent sudo firewall-cmd --reload For me, I’ll go with firewalld-rich rules to allow access from only my trusted subnets and IPs. sudo firewall-cmd --permanent --add-rich-rule 'rule family="ipv4" \ source address="192.168.10.0/24" port protocol="tcp" port="9090" accept' sudo firewall-cmd --reload Replace 192.168.10.0/24 with your trusted subnet. I’m going to test from my Grafana server if I can access Prometheus service on port 9090. $ sudo yum -y install nmap-ncat $ sudo nc -v 192.168.10.20 9090 Ncat: Version 6.40 ( http://nmap.org/ncat ) Ncat: Connected to 192.168.10.20:9090. Since I can connect to port 9090, this means our setup is complete. You can also try access UI dashboard. 5. Configure Authentication with username and password We have a guide dedicated to using basic http authentication to access Prometheus Metrics. Use below link to access it. Secure Prometheus Server With Basic Password Authentication Next, we will cover installing exporters on nodes to be monitored and configuring targets on out Prometheus server so that we can scrap metrics and visualize with Grafana. Prometheus Monitoring guides Monitoring Ceph Cluster with Prometheus and Grafana Monitoring Apache Web server with Prometheus and Grafana How to Monitor Linux Server Performance with Prometheus and Grafana in 5 minutes How to Monitor BIND DNS server with Prometheus and Grafana How to Monitor Redis Server with Prometheus and Grafana in 5 minutes Monitoring MySQL / MariaDB with Prometheus in five minutes
0 notes
Text
MySQL macOS Docker
While you can download MySQL as a DMG package, a number of users would prefer to install it as a Docker instance. You won’t find the macOS downloads on the same web site as other downloads. You can use the following macOS download site. After installing Docker on your macOS, you can pull a copy of the current MySQL Server with the following command: docker pull mysql/mysql-server You should create a mysql directory inside your ~/Documents directory with this command: mkdir ~/Documents/mysql Then, you should use the cd command to change into the ~/Documents/mysql directory and run this command: pwd It should return the following directory: /Users//Documents/mysql Use the /Users//Documents/mysql as the in this command: docker run --name=mysql1 --volume=:/var/lib/mysql -p 33060:3306/tcp -d mysql/mysql-server The --name option value is mysql1 and it becomes the container value. Docker mounts the column in the ~/Documents/mysql folder. All data from the Docker container under the /var/lib/mysql directory will persist in this directory. This directory will still contain the database when the container is shut down. The docker run command maps the localhost’s 33060 port to the 3306 port on the Docker container. You will use the 33060 port to connect to the Docker instance of MySQL. It raises a dialog box asking for permission to access the directory. You need to allow Docker to write to the ~/Documents/mysql directory. You can verify that the Docker container is running with the following command: docker ps It should return: CONTAINER ID IMAGE COMMAND CREATED STATUS PORTS NAMES 142b5c491cd8 mysql/mysql-server "/entrypoint.sh mysq…" 7 minutes ago Up 6 minutes (healthy) 33060-33061/tcp, 0.0.0.0:33060->3306/tcp mysql1 You can get the MySQL generated root password with this Docker command: docker logs mysql1 2>&1 | grep GENERATED It returns something like the following: [Entrypoint] GENERATED ROOT PASSWORD: vop#3GNYqK3nC@S@N3haf3nox5E Use the following Docker command to connect to the Docker container: docker exec -it mysql1 /bin/bash It launches a Bash shell inside the Docker container: bash-4.2# Start the mysql Command-Line Interface (CLI): mysql -uroot -p You are then prompted for a password: Enter password: After successfully entering the password, you’ll see the following: Welcome to the MySQL monitor. Commands end with ; or g. Your MySQL connection id is 55 Server version: 8.0.22 Copyright (c) 2000, 2020, Oracle and/or its affiliates. All rights reserved. Oracle is a registered trademark of Oracle Corporation and/or its affiliates. Other names may be trademarks of their respective owners. Type 'help;' or 'h' for help. Type 'c' to clear the current input statement. mysql> Unless you want to remember that hugely complex root password, you should consider changing it to something simple like, 'cangetin' with the following command: ALTER USER 'root'@'localhost' IDENTIFIED WITH MYSQL_NATIVE_PASSWORD BY 'cangetin'; Next, you should check for the installed databases with this command: show databases; It will return: +--------------------+ | Database | +--------------------+ | information_schema | | mysql | | performance_schema | | sys | +--------------------+ 4 rows in set (0.01 sec) Exiting mysql, you can see the contents of the root user’s directory with this list command: ls -al It should return: total 84 drwxr-xr-x 1 root root 4096 Jan 12 03:41 . drwxr-xr-x 1 root root 4096 Jan 12 03:41 .. -rwxr-xr-x 1 root root 0 Jan 12 03:41 .dockerenv lrwxrwxrwx 1 root root 7 Oct 12 22:06 bin -> usr/bin dr-xr-xr-x 2 root root 4096 Apr 11 2018 boot drwxr-xr-x 5 root root 340 Jan 12 03:41 dev drwxr-xr-x 2 root root 4096 Oct 19 05:47 docker-entrypoint-initdb.d -rwxr-xr-x 1 root root 7496 Oct 19 05:37 entrypoint.sh drwxr-xr-x 1 root root 4096 Jan 12 03:41 etc -rw-r--r-- 1 root root 86 Jan 12 03:41 healthcheck.cnf -rwxr-xr-x 1 root root 1073 Oct 19 05:37 healthcheck.sh drwxr-xr-x 2 root root 4096 Apr 11 2018 home lrwxrwxrwx 1 root root 7 Oct 12 22:06 lib -> usr/lib lrwxrwxrwx 1 root root 9 Oct 12 22:06 lib64 -> usr/lib64 drwxr-xr-x 2 root root 4096 Apr 11 2018 media drwxr-xr-x 2 root root 4096 Apr 11 2018 mnt -rw-r--r-- 1 root root 0 Jan 12 03:41 mysql-init-complete drwxr-xr-x 2 root root 4096 Apr 11 2018 opt dr-xr-xr-x 127 root root 0 Jan 12 03:41 proc dr-xr-x--- 1 root root 4096 Jan 12 04:21 root drwxr-xr-x 1 root root 4096 Oct 19 05:47 run lrwxrwxrwx 1 root root 8 Oct 12 22:06 sbin -> usr/sbin drwxr-xr-x 2 root root 4096 Apr 11 2018 srv dr-xr-xr-x 13 root root 0 Jan 12 03:41 sys drwxrwxrwt 1 root root 4096 Jan 12 03:41 tmp drwxr-xr-x 1 root root 4096 Oct 12 22:06 usr drwxr-xr-x 1 root root 4096 Oct 12 22:06 var At this point, you have to make a choice about how you will access the MySQL database. You have a couple options: Create an individual student user that can access the MySQL-Server as a micro-service, which would only be a MySQL user connecting through MySQL workbench. At least, that’s the only connection option unless you likewise install the mysql client on your host macOS. The mysql client lets you connect from the host operating system through the Command-Line Interface (CLI). Create a local student user account inside the Docker container. It will have access to the container file system and mimic the behavior of a non-root user on a server. Let’s create both for this demonstration. Reconnect as the root user and issue the following two commands: CREATE USER 'student'@'localhost' IDENTIFIED WITH MYSQL_NATIVE_PASSWORD BY 'student'; CREATE USER 'student'@'%.%.%.%' IDENTIFIED WITH MYSQL_NATIVE_PASSWORD BY 'student'; The first version of the student user lets you access the database from inside the Docker container. The second version of the student user lets you access the database from MySQL Workbench deployed on your base macOS. You create a non-root for the Docker container from the macOS host opearting system. Which means you need to quit; the mysql client, and exit the root user’s session with the Docker container. At the terminal in your macOS, issue the following Docker command to create a student account in the mysql1 container: docker exec mysql1 bash -c "useradd -u 501 -g mysql -G users > -d /home/student -s /bin/bash -c "Student" -n student" Now, you can connect as the student user to the mysql1 container, with the following Docker command: docker exec -it --user student mysql1 bash The first time you connect, you will be a the / (root) directory. Use the following cd command to go to the student user’s home directory: cd Then, type the following command to set the student user’s home directory as the default. You need to use this command because vim isn’t installed in the default Docker container, which would let you interactively edit files. It appends the necessary Bash shell command to the end of the .bashrc file. echo 'cd ${HOME}' >> .bashrc With this change, the student user will always be available form its home directory next time you connect to the mysql1 container. You can use scp to move files into the student user’s home (/home/student) directory. However, you can create a quick test.sql file like this: echo "select user();" > test.sql Connect to the mysql CLI with as the student user: mysql -ustudent -p You can run the test.sql program as follows form the mysql CLI command-line: source test.sql It will return: +-------------------+ | user() | +-------------------+ | student@localhost | +-------------------+ 1 row in set (0.00 sec) That’s the basic setup of the Docker MySQL Container on the macOS. You can do much more once you’ve configured it like this. For example, you can add vim to your library repository as the root user with the following command: yum install -y vim It just takes a minute or a bit more. Adding vim opens up so much flexibility for you inside the Docker container, it’s impossible for me to resist. https://blog.mclaughlinsoftware.com/2021/01/11/mysql-macos-docker/
0 notes
Link
Introduction to Docker
In today’s IT world, most of us must have heard or faced issues like code works well in the Dev environment, but not in testing or a production environment. Because of this, the Operations team faces a severe headache of maintaining the systems in their proper state without having downtimes or affecting the end-user. This becomes a snake and ladder game between Dev and Ops and creates a lot of chaos that results in unproductive releases, downtimes, and trust issues. When the developer code works in one machine but not in another, a lot of developer time is consumed in finding the exact error that caused this issue. Docker is the tool that solves this puzzle, with docker we can pack the code along with all its configuration and dependencies so that it can work seamlessly in any environment, whether it is development, operation or testing.
Why Docker?
Docker changed the way applications used to build and ship. It has completely revolutionized the containerization world. With Docker, deploying your software becomes a lot easier, you don’t have to think about missing a system configuration, underlying infrastructure, or a prerequisite. Docker enables us to create, deploy, and manage lightweight, stand-alone packages that contain everything that is needed to run an application. To be specific, it contains code, libraries, runtime, system settings, and dependencies. Each such packages are called containers. Each container is deployed with its own CPU, network resources, memory, and everything without having to depend upon any individual external kernel and operating system.
Imagine you’ve thousands of test cases to run connected to a database, and they all go through sequentially. How much time do you think that will take? But with Docker, this will happen very quickly with the containerization approach where all these test cases can run parallelly on the same host at the same time.
Benefits of using Docker
Enables consistent environment
Easy to use and maintain
Efficient use of the system resources
Increase in the rate of software delivery
Increases operational efficiency
Increases developer productivity
Docker Architecture
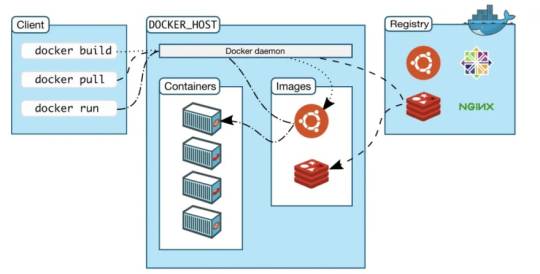
Image Credits: Docker
Docker works on a client-server architecture. There is something called Docker client that talks to the Docker daemon, which does the heavy lifting of building, running, and distributing Docker containers. Both the Docker client and Docker daemon can run on the same system, or the other way is, you can connect a Docker client to a remote Docker daemon. The Docker client and daemon communicate using a REST API, through UNIX sockets or network interface.
Main components in the Docker system
Docker Image
Docker Images are made up of multiple layers of read-only filesystems, these filesystems are called a Docker file, they are just text file with a set of pre-written commands. For every text written or instructions given in docker file a layer is created and is placed on top of another layer forming a docker image, which is future used to create docker container. Docker has created hub.docker.com, where people store their created docker images, it’s like a storage area for docker images, also it can be stored in a local registry.
Docker Container
A container is an isolated application, it is built from one or more images, and acts as an entire package system which includes all the libraries and dependencies required for an application to run. Docker containers come without OS, they use the Host OS for functionality, hence it is a more portable, efficient and lightweight system that comes with a guarantee that the software will run in any environment.
Docker Engine
It is the nucleus of the Docker system, an application that is installed on the host machine and it follows client-server architecture. There are mainly 3 components in the Docker Engine:
Server is the docker daemon named dockerd. Creates and manages docker images, containers, networks, etc.
Rest API instructs docker daemon what to do.
Command Line Interface (CLI) is the client used to enter docker commands.
Docker client
Docker client is the key component in the Docker system which is used by users to interact with Docker, it provides a command-line interface (CLI). When we run the docker commands, the client sends these commands to the daemon ‘dockerd, to issue build, run, and stop the application.
Docker Registry
This is the place where Docker images are stored. Docker Hub and Docker Cloud are public registries that can be accessed by everyone and anyone, whereas, other option is having your own private registry. Docker by default is configured to look for images on Docker Hub. You can also have an Artifactory Docker Registry for more security and optimize your builds.
Let us get into the practicalities of Docker
Steps to install Docker:
Below is the link for docker installation, that is provided by Docker, we have clear documentation available for installing Docker. https://docs.docker.com/engine/install/ubuntu/ Once docker is installed check the version of docker

Few basic Docker commands
docker ps: Gives you the list of active containers on your machine

In the output we can see it displays few details about the container
CONTAINER ID: Each and every container will be assigned with a unique ID IMAGE: Every Image has an attached tag COMMAND: Each and every image will be assigned with a unique ID CREATED: shows the detail when it was created STATUS: Shows the detail whether the container is active or not PORTS: Exposed port NAMES: Random name is assigned by docker for container created
docker ps -a Gives you the full list of containers including the once’s which are stopped or crashed

docker images Gives you the list of images present in the system
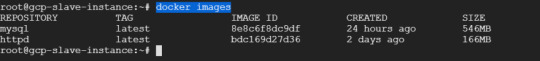
docker run ARGUMENT IMAGE-NAME It will create a container using the image name

Here arguments -itd means i — interactive t — connected to terminal d — detached Mode
We can run the container as detached mode (-itd) or root mode (-td)as per the requirement.
docker stop CONTAINER-ID/NAME To stop the container
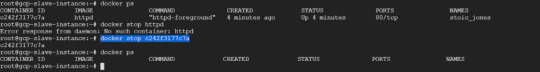
docker rm CONTAINER-ID/NAME To remove a container
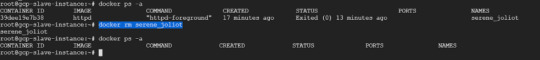
docker rmi IMAGE-ID To remove a docker image
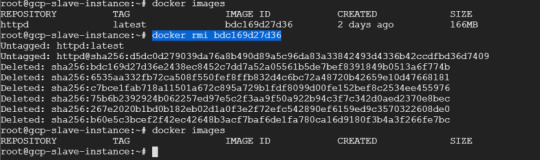
docker exec -it container name /bin/bash/ Get access to shell of container
With this command we can run our required code within the container.

Volumes in container
Containers are dynamic in nature, they move a lot, today a container might be on server A tomorrow it may be on server B so they will be shuffled, relocated as per the requirement Volume acts as data warehouse, or data storage attached externally to container.
Let’s say for example, in data directory (data) we have data1 and data2 as file that are part of the data associated for our application to work with.
but we do not want these data to be really stored within container, instead of that we want it to be mounted, so the actual read and write will happen within data1 and data2 it will look like it’s a part of container. So these mounted data are called as Volumes.

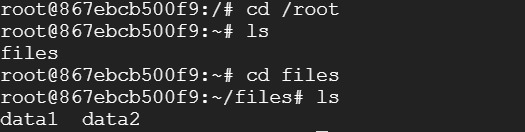
Now that we have a basic idea about creating, deleting and starting a container, further will see how to create your own image.
On our server machine we need to install Apache2 by running below mentioned commands: sudo apt-get update sudo apt-get install apache2
Creating a Dockerfiles
Create a directory as sample-code within that create a Dockerfile and index.html file
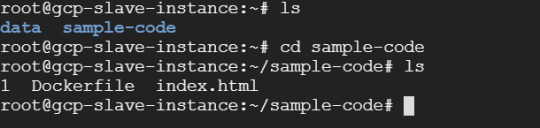
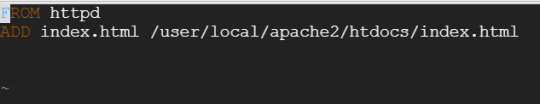
Every dockerfile starts with FROM command which tells from where is the base image is coming from , here we are telling to use httpd as our base image, and then we want to add a file index.html, which will act as our source and our destination will be /usr/local/apache2/htdocs/index.html, when we run this file docker will create a temporary container and it will create an image out of it once the image is created we can use this image to create a container out of it.
docker build . -t first-image: this command will build an image where first-mage is the name of image
docker run -itd — name first-container -p 8090:80 first-image: this command will build the container where first-container is name of container mapped to port 80 we can see the output : http://server_IP:port
Conclusion
Docker containers are better than virtual machines because they ensure that our application runs without any error. The containerization paves the way forward to digital transformation in the software powered organizations. Docker Containers can be spun up with any framework and language of your choice as long as there is an image already available in the community for them. Many CI/CD tools like Jenkins, CircleCI, TravisCI, etc. are now fully support and integrated with Docker, which makes diffusing your changes from environment to environment is now a breeze. Docker makes deployment of application very easy and because the containers are lightweight, it helps in scale and automation.
0 notes