#real-time analytics SQL Server
Explore tagged Tumblr posts
Visit Tumblr Blog
Explore Tumblr blogs with no restrictions, modern design and the best experience.
Last Seen Tumblr Blogs


Fun Fact
There are dozens of funny blogs to kill time on Tumblr.
Text
Unlocking Real-Time Analytics: Azure Synapse Link for SQL Server 2022
In the landscape of data management and analytics, the integration of operational databases with analytical systems often presents significant challenges. Historically, extracting, transforming, and loading (ETL) data from transactional systems to analytical platforms has been a cumbersome and time-consuming process. However, with the advent of SQL Server 2022, Microsoft introduces a…

View On WordPress
#Azure Synapse Analytics integration#operational database analytics#real-time analytics SQL Server#Azure Synapse Link SQL Server 2022#SQL Server 2022 features
0 notes
Text
Why Tableau is Essential in Data Science: Transforming Raw Data into Insights

Data science is all about turning raw data into valuable insights. But numbers and statistics alone don’t tell the full story—they need to be visualized to make sense. That’s where Tableau comes in.
Tableau is a powerful tool that helps data scientists, analysts, and businesses see and understand data better. It simplifies complex datasets, making them interactive and easy to interpret. But with so many tools available, why is Tableau a must-have for data science? Let’s explore.
1. The Importance of Data Visualization in Data Science
Imagine you’re working with millions of data points from customer purchases, social media interactions, or financial transactions. Analyzing raw numbers manually would be overwhelming.
That’s why visualization is crucial in data science:
Identifies trends and patterns – Instead of sifting through spreadsheets, you can quickly spot trends in a visual format.
Makes complex data understandable – Graphs, heatmaps, and dashboards simplify the interpretation of large datasets.
Enhances decision-making – Stakeholders can easily grasp insights and make data-driven decisions faster.
Saves time and effort – Instead of writing lengthy reports, an interactive dashboard tells the story in seconds.
Without tools like Tableau, data science would be limited to experts who can code and run statistical models. With Tableau, insights become accessible to everyone—from data scientists to business executives.
2. Why Tableau Stands Out in Data Science
A. User-Friendly and Requires No Coding
One of the biggest advantages of Tableau is its drag-and-drop interface. Unlike Python or R, which require programming skills, Tableau allows users to create visualizations without writing a single line of code.
Even if you’re a beginner, you can:
✅ Upload data from multiple sources
✅ Create interactive dashboards in minutes
✅ Share insights with teams easily
This no-code approach makes Tableau ideal for both technical and non-technical professionals in data science.
B. Handles Large Datasets Efficiently
Data scientists often work with massive datasets—whether it’s financial transactions, customer behavior, or healthcare records. Traditional tools like Excel struggle with large volumes of data.
Tableau, on the other hand:
Can process millions of rows without slowing down
Optimizes performance using advanced data engine technology
Supports real-time data streaming for up-to-date analysis
This makes it a go-to tool for businesses that need fast, data-driven insights.
C. Connects with Multiple Data Sources
A major challenge in data science is bringing together data from different platforms. Tableau seamlessly integrates with a variety of sources, including:
Databases: MySQL, PostgreSQL, Microsoft SQL Server
Cloud platforms: AWS, Google BigQuery, Snowflake
Spreadsheets and APIs: Excel, Google Sheets, web-based data sources
This flexibility allows data scientists to combine datasets from multiple sources without needing complex SQL queries or scripts.
D. Real-Time Data Analysis
Industries like finance, healthcare, and e-commerce rely on real-time data to make quick decisions. Tableau’s live data connection allows users to:
Track stock market trends as they happen
Monitor website traffic and customer interactions in real time
Detect fraudulent transactions instantly
Instead of waiting for reports to be generated manually, Tableau delivers insights as events unfold.
E. Advanced Analytics Without Complexity
While Tableau is known for its visualizations, it also supports advanced analytics. You can:
Forecast trends based on historical data
Perform clustering and segmentation to identify patterns
Integrate with Python and R for machine learning and predictive modeling
This means data scientists can combine deep analytics with intuitive visualization, making Tableau a versatile tool.
3. How Tableau Helps Data Scientists in Real Life
Tableau has been adopted by the majority of industries to make data science more impactful and accessible. This is applied in the following real-life scenarios:
A. Analytics for Health Care
Tableau is deployed by hospitals and research institutions for the following purposes:
Monitor patient recovery rates and predict outbreaks of diseases
Analyze hospital occupancy and resource allocation
Identify trends in patient demographics and treatment results
B. Finance and Banking
Banks and investment firms rely on Tableau for the following purposes:
✅ Detect fraud by analyzing transaction patterns
✅ Track stock market fluctuations and make informed investment decisions
✅ Assess credit risk and loan performance
C. Marketing and Customer Insights
Companies use Tableau to:
✅ Track customer buying behavior and personalize recommendations
✅ Analyze social media engagement and campaign effectiveness
✅ Optimize ad spend by identifying high-performing channels
D. Retail and Supply Chain Management
Retailers leverage Tableau to:
✅ Forecast product demand and adjust inventory levels
✅ Identify regional sales trends and adjust marketing strategies
✅ Optimize supply chain logistics and reduce delivery delays
These applications show why Tableau is a must-have for data-driven decision-making.
4. Tableau vs. Other Data Visualization Tools
There are many visualization tools available, but Tableau consistently ranks as one of the best. Here’s why:
Tableau vs. Excel – Excel struggles with big data and lacks interactivity; Tableau handles large datasets effortlessly.
Tableau vs. Power BI – Power BI is great for Microsoft users, but Tableau offers more flexibility across different data sources.
Tableau vs. Python (Matplotlib, Seaborn) – Python libraries require coding skills, while Tableau simplifies visualization for all users.
This makes Tableau the go-to tool for both beginners and experienced professionals in data science.
5. Conclusion
Tableau has become an essential tool in data science because it simplifies data visualization, handles large datasets, and integrates seamlessly with various data sources. It enables professionals to analyze, interpret, and present data interactively, making insights accessible to everyone—from data scientists to business leaders.
If you’re looking to build a strong foundation in data science, learning Tableau is a smart career move. Many data science courses now include Tableau as a key skill, as companies increasingly demand professionals who can transform raw data into meaningful insights.
In a world where data is the driving force behind decision-making, Tableau ensures that the insights you uncover are not just accurate—but also clear, impactful, and easy to act upon.
#data science course#top data science course online#top data science institute online#artificial intelligence course#deepseek#tableau
3 notes
·
View notes
Text
The Ultimate Guide to Mastering Power BI: A Comprehensive Course by Zabeel Institute
In today's data-driven world, businesses are constantly seeking ways to leverage data for better decision-making. One of the most powerful tools to achieve this is Microsoft Power BI, a business analytics solution that empowers organizations to visualize their data, share insights, and make data-driven decisions in real time. If you're looking to gain expertise in this powerful tool, Zabeel Institute's Power BI course in Dubai is the perfect starting point.
What is Power BI?
Power BI is a suite of business analytics tools that allows users to analyze data and share insights. With its user-friendly interface and robust capabilities, Power BI enables both beginners and seasoned professionals to create interactive dashboards and reports. Whether you're dealing with simple data sets or complex analytics, Power BI makes data visualization intuitive and accessible.
Why Learn Power BI?
Learning Power BI opens up a world of opportunities. As businesses increasingly rely on data to drive their decisions, professionals skilled in Power BI are in high demand. Here are some compelling reasons why you should consider enrolling in a Power BI course:
High Demand for Power BI Skills: With the rise of data-driven decision-making, there is a growing demand for professionals who can interpret and visualize data effectively.
Career Advancement: Mastering Power BI can significantly enhance your career prospects, especially in fields such as data analysis, business intelligence, and management.
Versatility: Power BI is versatile and can be applied across various industries, including finance, healthcare, marketing, and more.
Improved Decision-Making: By learning how to create detailed and interactive reports, you can help your organization make informed decisions based on real-time data.
Course Overview: Analyzing Data with Microsoft Power BI
At Zabeel Institute, the Analyzing Data with Microsoft Power BI course is designed to equip you with the skills needed to harness the full potential of Power BI. This comprehensive course covers everything from the basics to advanced data visualization techniques.
1. Introduction to Power BI
The course begins with an introduction to the Power BI environment. You'll learn about the Power BI service, Power BI Desktop, and how to navigate through these tools efficiently. Understanding the interface is crucial for leveraging the full capabilities of Power BI.
2. Connecting to Data Sources
Power BI allows you to connect to a wide range of data sources, including Excel, SQL Server, Azure, and many more. In this module, you'll learn how to import data from various sources and prepare it for analysis.
3. Data Transformation and Cleaning
Before you can visualize your data, it often needs to be cleaned and transformed. This section of the course will teach you how to use Power Query to shape and clean your data, ensuring it's ready for analysis.
4. Creating Data Models
Data modeling is a crucial step in the data analysis process. In this module, you'll learn how to create relationships between different data sets and build a robust data model that supports your analysis.
5. Building Interactive Dashboards
One of Power BI's strengths is its ability to create interactive dashboards. You'll learn how to design visually appealing dashboards that provide meaningful insights at a glance.
6. Advanced Data Visualizations
Once you're comfortable with the basics, the course delves into more advanced visualizations. You'll explore custom visuals, R and Python integration, and how to create sophisticated reports that stand out.
7. DAX (Data Analysis Expressions)
DAX is a powerful formula language in Power BI. This section covers the fundamentals of DAX, enabling you to perform complex calculations and create dynamic reports.
8. Power BI Service and Collaboration
Power BI is not just about creating reports—it's also about sharing and collaborating on those reports. You'll learn how to publish your reports to the Power BI service, set up security, and collaborate with your team.
9. Power BI Mobile App
In today's mobile world, being able to access your reports on the go is essential. The course will show you how to use the Power BI Mobile App to view and interact with your dashboards from anywhere.
10. Best Practices for Power BI
To ensure you're getting the most out of Power BI, the course concludes with a module on best practices. This includes tips on performance optimization, report design, and maintaining data security.
Why Choose Zabeel Institute?
When it comes to learning Power BI, choosing the right institute is crucial. Zabeel Institute stands out for several reasons:
Experienced Instructors: Zabeel Institute's instructors are industry experts with years of experience in data analysis and business intelligence.
Hands-On Training: The course is designed to be highly practical, with plenty of hands-on exercises to reinforce your learning.
Industry-Recognized Certification: Upon completion, you'll receive a certification that is recognized by employers globally, giving you an edge in the job market.
Flexible Learning Options: Whether you prefer in-person classes or online learning, Zabeel Institute offers flexible options to suit your schedule.
Real-World Applications of Power BI
Understanding Power BI is one thing, but knowing how to apply it in the real world is what truly matters. Here are some examples of how Power BI can be used across various industries:
Finance: Create detailed financial reports and dashboards that track key metrics such as revenue, expenses, and profitability.
Healthcare: Analyze patient data to improve healthcare delivery and outcomes.
Retail: Track sales data, customer trends, and inventory levels in real time.
Marketing: Measure the effectiveness of marketing campaigns by analyzing data from multiple channels.
Human Resources: Monitor employee performance, track recruitment metrics, and analyze workforce trends.
Success Stories: How Power BI Transformed Businesses
To illustrate the impact of Power BI, let's look at a few success stories:
Company A: This retail giant used Power BI to analyze customer purchasing behavior, resulting in a 15% increase in sales.
Company B: A financial services firm leveraged Power BI to streamline its reporting process, reducing the time spent on report generation by 50%.
Company C: A healthcare provider used Power BI to track patient outcomes, leading to improved patient care and reduced readmission rates.
Mastering Power BI is not just about learning a tool—it's about acquiring a skill that can transform the way you work with data. Whether you're looking to advance your career, enhance your business's decision-making capabilities, or simply stay ahead in today's data-driven world, Zabeel Institute's Power BI course is the perfect choice.
Don't miss out on the opportunity to learn from the best. Enroll in Zabeel Institute's Power BI course today and take the first step towards becoming a Power BI expert.
Ready to transform your career with Power BI? Enroll in Zabeel Institute's Power BI course now and start your journey towards mastering data analysis and visualization. Visit Zabeel Institut for more information.
2 notes
·
View notes
Text
Power of Data Visualization: A Deep Dive into Microsoft Power BI Services
In today’s data-driven world, the ability to transform raw data into actionable insights is a crucial asset for businesses. As organizations accumulate vast amounts of data from various sources, the challenge lies not just in storing and managing this data but in making sense of it. This is where Microsoft Power BI Services comes into play—a powerful tool designed to bring data to life through intuitive and dynamic visualizations.
What is Microsoft Power BI?
Microsoft Power BI is a suite of business analytics tools that enables organizations to analyze data and share insights. It provides interactive visualizations and business intelligence capabilities with a simple interface, making it accessible to both technical and non-technical users. Whether you are analyzing sales performance, tracking customer behavior, or monitoring operational efficiency, Power BI empowers you to create dashboards and reports that highlight the key metrics driving your business.
Key Features of Microsoft Power BI Services
User-Friendly Interface: One of the standout features of Power BI is its user-friendly interface. Even those with minimal technical expertise can quickly learn to create reports and dashboards. The drag-and-drop functionality allows users to effortlessly build visualizations, while pre-built templates and AI-powered insights help accelerate the decision-making process.
Data Connectivity: Power BI supports a wide range of data sources, including Excel, SQL Server, cloud-based data warehouses, and even social media platforms. This extensive connectivity ensures that users can pull in data from various systems and consolidate it into a single, coherent view. The ability to connect to both on-premises and cloud-based data sources provides flexibility and scalability as your data needs evolve.
Real-Time Analytics: In today’s fast-paced business environment, real-time data is critical. Power BI’s real-time analytics capabilities allow users to monitor data as it’s collected, providing up-to-the-minute insights. Whether tracking website traffic, monitoring social media engagement, or analyzing sales figures, Power BI ensures that you are always equipped with the latest information.
Custom Visualizations: While Power BI comes with a robust library of standard visualizations, it also supports custom visuals. Organizations can create unique visualizations that cater to specific business needs, ensuring that the data is presented in the most effective way possible. These custom visuals can be developed in-house or sourced from the Power BI community, offering endless possibilities for data representation.
Collaboration and Sharing: Collaboration is key to making data-driven decisions. Power BI makes it easy to share insights with colleagues, whether through interactive reports or shared dashboards. Reports can be published to the Power BI service, embedded in websites, or shared via email, ensuring that stakeholders have access to the information they need, when they need it.
Integration with Microsoft Ecosystem: As part of the Microsoft ecosystem, Power BI seamlessly integrates with other Microsoft products like Excel, Azure, and SharePoint. This integration enhances productivity by allowing users to leverage familiar tools and workflows. For example, users can import Excel data directly into Power BI, or embed Power BI reports in SharePoint for easy access.
The Benefits of Microsoft Power BI Services for Businesses
The adoption of Microsoft Power BI Services offers numerous benefits for businesses looking to harness the power of their data:
Enhanced Decision-Making: By providing real-time, data-driven insights, Power BI enables businesses to make informed decisions faster. The ability to visualize data through dashboards and reports ensures that critical information is easily accessible, allowing decision-makers to respond to trends and challenges with agility.
Cost-Effective Solution: Power BI offers a cost-effective solution for businesses of all sizes. With a range of pricing options, including a free version, Power BI is accessible to small businesses and large enterprises alike. The cloud-based service model also reduces the need for expensive hardware and IT infrastructure, making it a scalable option as your business grows.
Improved Data Governance: Data governance is a growing concern for many organizations. Power BI helps address this by providing centralized control over data access and usage. Administrators can set permissions and define data access policies, ensuring that sensitive information is protected and that users only have access to the data they need.
Scalability and Flexibility: As businesses grow and their data needs evolve, Power BI scales effortlessly to accommodate new data sources, users, and reporting requirements. Whether expanding to new markets, launching new products, or adapting to regulatory changes, Power BI provides the flexibility to adapt and thrive in a dynamic business environment.
Streamlined Reporting: Traditional reporting processes can be time-consuming and prone to errors. Power BI automates many of these processes, reducing the time spent on report creation and ensuring accuracy. With Power BI, reports are not only generated faster but are also more insightful, helping businesses to stay ahead of the competition.
Empowering Non-Technical Users: One of Power BI’s greatest strengths is its accessibility. Non-technical users can easily create and share reports without relying on IT departments. This democratization of data empowers teams across the organization to take ownership of their data and contribute to data-driven decision-making.
Use Cases of Microsoft Power BI Services
Power BI’s versatility makes it suitable for a wide range of industries and use cases:
Retail: Retailers use Power BI to analyze sales data, track inventory levels, and understand customer behavior. Real-time dashboards help retail managers make quick decisions on pricing, promotions, and stock replenishment.
Finance: Financial institutions rely on Power BI to monitor key performance indicators (KPIs), analyze risk, and ensure compliance with regulatory requirements. Power BI’s robust data security features make it an ideal choice for handling sensitive financial data.
Healthcare: In healthcare, Power BI is used to track patient outcomes, monitor resource utilization, and analyze population health trends. The ability to visualize complex data sets helps healthcare providers deliver better care and improve operational efficiency.
Manufacturing: Manufacturers leverage Power BI to monitor production processes, optimize supply chains, and manage quality control. Real-time analytics enable manufacturers to identify bottlenecks and make data-driven adjustments on the fly.
Conclusion
In an era where data is a key driver of business success, Microsoft Power BI Services offers a powerful, flexible, and cost-effective solution for transforming raw data into actionable insights. Its user-friendly interface, extensive data connectivity, and real-time analytics capabilities make it an invaluable tool for organizations across industries. By adopting Power BI, businesses can unlock the full potential of their data, making informed decisions that drive growth, efficiency, and innovation.
5 notes
·
View notes
Text
Why Power BI Takes the Lead Against SSRS
In an era where data steers the course of businesses and fuels informed decisions, the choice of a data visualization and reporting tool becomes paramount. Amidst the myriad of options, two stalwarts stand out: Power BI and SSRS (SQL Server Reporting Services). As organizations, including those seeking Power BI training in Gurgaon, strive to extract meaningful insights from their data, the debate about which tool to embrace gains prominence. In this digital age, where data is often referred to as the "new oil," selecting the right tool can make or break a business's competitive edge.
Understanding the Landscape
What is Power BI?
Microsoft Power BI is a powerful business analytics application that enables organizations to visualize data and communicate insights across the organization. With its intuitive interface and user-friendly features, Power BI transforms raw data into interactive visuals, making it easier to interpret and draw actionable conclusions.
What is SSRS?
On the other hand, SSRS, also developed by Microsoft, focuses on traditional reporting. It enables the creation, management, and delivery of traditional paginated reports. SSRS has been a reliable choice for years, but the advent of Power BI has brought new dimensions to data analysis.
The Advantages of Power BI Over SSRS
In the realm of data analysis and reporting tools, Power BI shines as a modern marvel, surpassing SSRS in various crucial aspects. Let's explore the advantages that set Power BI apart:
1. Interactive Visualizations
Power BI's forte lies in its ability to transform raw data into interactive and captivating visual representations. Unlike SSRS, which predominantly deals with static reports, Power BI empowers users to explore data dynamically, enabling them to drill down into specifics and gain deeper insights. This interactive approach enhances data comprehension and decision-making processes.
2. Real-time Insights
While SSRS offers a snapshot of data at a particular moment, Power BI steps ahead with real-time data analysis capabilities. Modern businesses, including those enrolling in a Power BI training institute in Bangalore, require up-to-the-minute insights to stay competitive, and Power BI caters precisely to this need. It connects seamlessly to various data sources, ensuring that decisions are based on the latest information.
3. User-Friendly Interface
Power BI's intuitive interface stands in stark contrast to SSRS's somewhat technical setup. With its drag-and-drop functionality, Power BI eliminates the need for extensive coding knowledge. This accessibility allows a wider range of users, from business analysts to executives, to create and customize reports without depending heavily on IT departments.
4. Scalability
As a company grows, so does the amount of data it handles. Power BI's cloud-based architecture ensures scalability without compromising performance. Whether you're dealing with a small dataset or handling enterprise-level data, Power BI can handle the load, guaranteeing smooth operations and robust analysis.
5. Natural Language Queries
One of Power BI's standout features is its ability to understand natural language queries. Users can interact with the tool using everyday language and receive relevant visualizations in response. This bridge between human language and data analytics simplifies the process for non-technical users, making insights accessible to all.
The SEO Advantage
In the digital age, search engine optimization (SEO) plays a vital role in ensuring your content, including information about Power BI training in Mumbai, reaches the right audience. When it comes to comparing Power BI and SSRS in terms of SEO, Power BI once again takes the lead.
With their interactive visual content, Power BI-enhanced articles attract more engagement. This higher engagement leads to longer on-page time, lower bounce rates, and improved SEO rankings. Search engines recognize user behavior as a marker of content quality and relevance, boosting the visibility of Power BI-related articles.
For more information, contact us at:
Call: 8750676576, 871076576
Email: [email protected]
Website: www.advancedexcel.net
#power bi training in gurgaon#power bi coaching in gurgaon#power bi classes in mumbai#power bi course in mumbai#power bi training institute in bangalore#power bi coaching in bangalore
2 notes
·
View notes
Text
Azure Data Engineering Tools For Data Engineers
Azure is a cloud computing platform provided by Microsoft, which presents an extensive array of data engineering tools. These tools serve to assist data engineers in constructing and upholding data systems that possess the qualities of scalability, reliability, and security. Moreover, Azure data engineering tools facilitate the creation and management of data systems that cater to the unique requirements of an organization.
In this article, we will explore nine key Azure data engineering tools that should be in every data engineer’s toolkit. Whether you’re a beginner in data engineering or aiming to enhance your skills, these Azure tools are crucial for your career development.
Microsoft Azure Databricks
Azure Databricks is a managed version of Databricks, a popular data analytics and machine learning platform. It offers one-click installation, faster workflows, and collaborative workspaces for data scientists and engineers. Azure Databricks seamlessly integrates with Azure’s computation and storage resources, making it an excellent choice for collaborative data projects.
Microsoft Azure Data Factory
Microsoft Azure Data Factory (ADF) is a fully-managed, serverless data integration tool designed to handle data at scale. It enables data engineers to acquire, analyze, and process large volumes of data efficiently. ADF supports various use cases, including data engineering, operational data integration, analytics, and data warehousing.
Microsoft Azure Stream Analytics
Azure Stream Analytics is a real-time, complex event-processing engine designed to analyze and process large volumes of fast-streaming data from various sources. It is a critical tool for data engineers dealing with real-time data analysis and processing.
Microsoft Azure Data Lake Storage
Azure Data Lake Storage provides a scalable and secure data lake solution for data scientists, developers, and analysts. It allows organizations to store data of any type and size while supporting low-latency workloads. Data engineers can take advantage of this infrastructure to build and maintain data pipelines. Azure Data Lake Storage also offers enterprise-grade security features for data collaboration.
Microsoft Azure Synapse Analytics
Azure Synapse Analytics is an integrated platform solution that combines data warehousing, data connectors, ETL pipelines, analytics tools, big data scalability, and visualization capabilities. Data engineers can efficiently process data for warehousing and analytics using Synapse Pipelines’ ETL and data integration capabilities.
Microsoft Azure Cosmos DB
Azure Cosmos DB is a fully managed and server-less distributed database service that supports multiple data models, including PostgreSQL, MongoDB, and Apache Cassandra. It offers automatic and immediate scalability, single-digit millisecond reads and writes, and high availability for NoSQL data. Azure Cosmos DB is a versatile tool for data engineers looking to develop high-performance applications.
Microsoft Azure SQL Database
Azure SQL Database is a fully managed and continually updated relational database service in the cloud. It offers native support for services like Azure Functions and Azure App Service, simplifying application development. Data engineers can use Azure SQL Database to handle real-time data ingestion tasks efficiently.
Microsoft Azure MariaDB
Azure Database for MariaDB provides seamless integration with Azure Web Apps and supports popular open-source frameworks and languages like WordPress and Drupal. It offers built-in monitoring, security, automatic backups, and patching at no additional cost.
Microsoft Azure PostgreSQL Database
Azure PostgreSQL Database is a fully managed open-source database service designed to emphasize application innovation rather than database management. It supports various open-source frameworks and languages and offers superior security, performance optimization through AI, and high uptime guarantees.
Whether you’re a novice data engineer or an experienced professional, mastering these Azure data engineering tools is essential for advancing your career in the data-driven world. As technology evolves and data continues to grow, data engineers with expertise in Azure tools are in high demand. Start your journey to becoming a proficient data engineer with these powerful Azure tools and resources.
Unlock the full potential of your data engineering career with Datavalley. As you start your journey to becoming a skilled data engineer, it’s essential to equip yourself with the right tools and knowledge. The Azure data engineering tools we’ve explored in this article are your gateway to effectively managing and using data for impactful insights and decision-making.
To take your data engineering skills to the next level and gain practical, hands-on experience with these tools, we invite you to join the courses at Datavalley. Our comprehensive data engineering courses are designed to provide you with the expertise you need to excel in the dynamic field of data engineering. Whether you’re just starting or looking to advance your career, Datavalley’s courses offer a structured learning path and real-world projects that will set you on the path to success.
Course format:
Subject: Data Engineering Classes: 200 hours of live classes Lectures: 199 lectures Projects: Collaborative projects and mini projects for each module Level: All levels Scholarship: Up to 70% scholarship on this course Interactive activities: labs, quizzes, scenario walk-throughs Placement Assistance: Resume preparation, soft skills training, interview preparation
Subject: DevOps Classes: 180+ hours of live classes Lectures: 300 lectures Projects: Collaborative projects and mini projects for each module Level: All levels Scholarship: Up to 67% scholarship on this course Interactive activities: labs, quizzes, scenario walk-throughs Placement Assistance: Resume preparation, soft skills training, interview preparation
For more details on the Data Engineering courses, visit Datavalley’s official website.
#datavalley#dataexperts#data engineering#data analytics#dataexcellence#data science#power bi#business intelligence#data analytics course#data science course#data engineering course#data engineering training
3 notes
·
View notes
Text
How To Get An Online Internship In the IT Sector (Skills And Tips)

Internships provide invaluable opportunities to gain practical skills, build professional networks, and get your foot in the door with top tech companies.
With remote tech internships exploding in IT, online internships are now more accessible than ever. Whether a college student or career changer seeking hands-on IT experience, virtual internships allow you to work from anywhere.
However, competition can be fierce, and simply applying is often insufficient. Follow this comprehensive guide to develop the right technical abilities.
After reading this, you can effectively showcase your potential, and maximize your chances of securing a remote tech internship.
Understand In-Demand IT Skills
The first step is gaining a solid grasp of the most in-demand technical and soft skills. While specific requirements vary by company and role, these competencies form a strong foundation:
Technical Skills:
Proficiency in programming languages like Python, JavaScript, Java, and C++
Experience with front-end frameworks like React, Angular, and Vue.js
Back-end development skills - APIs, microservices, SQL databases Cloud platforms such as AWS, Azure, Google Cloud
IT infrastructure skills - servers, networks, security
Data science abilities like SQL, R, Python
Web development and design
Mobile app development - Android, iOS, hybrid
Soft Skills:
Communication and collaboration
Analytical thinking and problem-solving
Leadership and teamwork
Creativity and innovation
Fast learning ability
Detail and deadline-oriented
Flexibility and adaptability
Obtain Relevant Credentials
While hands-on skills hold more weight, relevant academic credentials and professional IT certifications can strengthen your profile. Consider pursuing:
Bachelor’s degree in Computer Science, IT, or related engineering fields
Internship-specific courses teaching technical and soft skills
Certificates like CompTIA, AWS, Cisco, Microsoft, Google, etc.
Accredited boot camp programs focusing on applied skills
MOOCs to build expertise in trending technologies like AI/ML, cybersecurity
Open source contributions on GitHub to demonstrate coding skills
The right credentials display a work ethic and supplement practical abilities gained through projects.
Build An Impressive Project Portfolio
Nothing showcases skills better than real-world examples of your work. Develop a portfolio of strong coding, design, and analytical projects related to your target internship field.
Mobile apps - publish on app stores or use GitHub project pages
Websites - deploy online via hosting services
Data science - showcase Jupyter notebooks, visualizations
Open source code - contribute to public projects on GitHub
Technical writing - blog posts explaining key concepts
Automation and scripts - record demo videos
Choose projects demonstrating both breadth and depth. Align them to skills required for your desired internship roles.
Master Technical Interview Skills
IT internship interviews often include challenging technical questions and assessments. Be prepared to:
Explain your code and projects clearly. Review them beforehand.
Discuss concepts related to key technologies on your resume. Ramp up on fundamentals.
Solve coding challenges focused on algorithms, data structures, etc. Practice online judges like LeetCode.
Address system design and analytical problems. Read case interview guides.
Show communication and collaboration skills through pair programming tests.
Ask smart, well-researched questions about the company’s tech stack, projects, etc.
Schedule dedicated time for technical interview practice daily. Learn to think aloud while coding and get feedback from peers.
Show Passion and Curiosity
Beyond raw skills, demonstrating genuine passion and curiosity for technology goes a long way.
Take online courses and certifications beyond the college curriculum
Build side projects and engage in hackathons for self-learning
Stay updated on industry news, trends, and innovations
Be active on forums like StackOverflow to exchange knowledge
Attend tech events and conferences
Participate in groups like coding clubs and prior internship programs
Follow tech leaders on social mediaListen to tech podcasts while commuting
Show interest in the company’s mission, products, and culture
This passion shines through in interviews and applications, distinguishing you from other candidates.
Promote Your Personal Brand
In the digital age, your online presence and personal brand are make-or-break. Craft a strong brand image across:
LinkedIn profile - showcase achievements, skills, recommendations
GitHub - displays coding activity and quality through clean repositories
Portfolio website - highlight projects and share valuable content
Social media - post career updates and useful insights, but avoid oversharing
Blogs/videos - demonstrate communication abilities and thought leadership
Online communities - actively engage and build relationships
Ensure your profiles are professional and consistent. Let your technical abilities and potential speak for themselves.
Optimize Your Internship Applications
Applying isn’t enough. You must optimize your internship applications to get a reply:
Ensure you apply to openings that strongly match your profile Customize your resume and cover letters using keywords in the job description
Speak to skills gained from coursework, online learning, and personal projects
Quantify achievements rather than just listing responsibilities
Emphasize passion for technology and fast learning abilities
Ask insightful questions that show business understanding
Follow up respectfully if you don’t hear back in 1-2 weeks
Show interest in full-time conversion early and often
Apply early since competitive openings close quickly
Leverage referrals from your network if possible
This is how you do apply meaningfully. If you want a good internship, focus on the quality of applications. The hard work will pay off.
Succeed in Your Remote Internship
The hard work pays off when you secure that long-awaited internship! Continue standing out through the actual internship by:
Over Communicating in remote settings - proactively collaborate
Asking smart questions and owning your learning
Finding mentors and building connections remotely
Absorbing constructive criticism with maturity
Shipping quality work on or before deadlines
Clarifying expectations frequently
Going above and beyond prescribed responsibilities sometimes
Getting regular feedback and asking for more work
Leaving with letters of recommendation and job referrals
When you follow these tips, you are sure to succeed in your remote internship. Remember, soft skills can get you long ahead in the company, sometimes core skills can’t.
Conclusion
With careful preparation, tenacity, and a passion for technology, you will be able to get internships jobs in USA that suit your needs in the thriving IT sector.
Use this guide to build the right skills, create an impressive personal brand, ace the applications, and excel in your internship.
Additionally, you can browse some good job portals. For instance, GrandSiren can help you get remote tech internships. The portal has the best internship jobs in India and USA you’ll find. The investment will pay dividends throughout your career in this digital age. Wishing you the best of luck! Let me know in the comments about your internship hunt journey.
#itjobs#internship opportunities#internships#interns#entryleveljobs#gradsiren#opportunities#jobsearch#careeropportunities#jobseekers#ineffable interns#jobs#employment#career
4 notes
·
View notes
Text
How To Get An Online Internship In the IT Sector (Skills And Tips)

Internships provide invaluable opportunities to gain practical skills, build professional networks, and get your foot in the door with top tech companies.
With remote tech internships exploding in IT, online internships are now more accessible than ever. Whether a college student or career changer seeking hands-on IT experience, virtual internships allow you to work from anywhere.
However, competition can be fierce, and simply applying is often insufficient. Follow this comprehensive guide to develop the right technical abilities.
After reading this, you can effectively showcase your potential, and maximize your chances of securing a remote tech internship.
Understand In-Demand IT Skills
The first step is gaining a solid grasp of the most in-demand technical and soft skills. While specific requirements vary by company and role, these competencies form a strong foundation:
Technical Skills:
>> Proficiency in programming languages like Python, JavaScript, Java, and C++ >> Experience with front-end frameworks like React, Angular, and Vue.js >> Back-end development skills - APIs, microservices, SQL databases >> Cloud platforms such as AWS, Azure, Google Cloud >> IT infrastructure skills - servers, networks, security >> Data science abilities like SQL, R, Python >> Web development and design >> Mobile app development - Android, iOS, hybrid
Soft Skills:
>> Communication and collaboration >> Analytical thinking and problem-solving >> Leadership and teamwork >> Creativity and innovation >> Fast learning ability >> Detail and deadline-oriented >> Flexibility and adaptability
Obtain Relevant Credentials
While hands-on skills hold more weight, relevant academic credentials and professional IT certifications can strengthen your profile. Consider pursuing:
>> Bachelor’s degree in Computer Science, IT, or related engineering fields. >> Internship-specific courses teaching technical and soft skills. >> Certificates like CompTIA, AWS, Cisco, Microsoft, Google, etc. >> Accredited boot camp programs focusing on applied skills. >> MOOCs to build expertise in trending technologies like AI/ML, cybersecurity. >> Open source contributions on GitHub to demonstrate coding skills.
The right credentials display a work ethic and supplement practical abilities gained through projects.
Build An Impressive Project Portfolio
Nothing showcases skills better than real-world examples of your work. Develop a portfolio of strong coding, design, and analytical projects related to your target internship field.
>> Mobile apps - publish on app stores or use GitHub project pages >> Websites - deploy online via hosting services >> Data science - showcase Jupyter notebooks, visualizations >> Open source code - contribute to public projects on GitHub >> Technical writing - blog posts explaining key concepts >> Automation and scripts - record demo videos
Choose projects demonstrating both breadth and depth. Align them to skills required for your desired internship roles.
Master Technical Interview Skills
IT internship interviews often include challenging technical questions and assessments. Be prepared to:
>> Explain your code and projects clearly. Review them beforehand. >> Discuss concepts related to key technologies on your resume. Ramp up on fundamentals. >> Solve coding challenges focused on algorithms, data structures, etc. Practice online judges like LeetCode. >> Address system design and analytical problems. Read case interview guides. >> Show communication and collaboration skills through pair programming tests. >> Ask smart, well-researched questions about the company’s tech stack, projects, etc.
Schedule dedicated time for technical interview practice daily. Learn to think aloud while coding and get feedback from peers.
Show Passion and Curiosity
Beyond raw skills, demonstrating genuine passion and curiosity for technology goes a long way.
>> Take online courses and certifications beyond the college curriculum >> Build side projects and engage in hackathons for self-learning >> Stay updated on industry news, trends, and innovations >> Be active on forums like StackOverflow to exchange knowledge >> Attend tech events and conferences >> Participate in groups like coding clubs and prior internship programs >> Follow tech leaders on social media >> Listen to tech podcasts while commuting >> Show interest in the company’s mission, products, and culture
This passion shines through in interviews and applications, distinguishing you from other candidates.
Promote Your Personal Brand
In the digital age, your online presence and personal brand are make-or-break. Craft a strong brand image across:
>> LinkedIn profile - showcase achievements, skills, recommendations >> GitHub - displays coding activity and quality through clean repositories >> Portfolio website - highlight projects and share valuable content >> Social media - post career updates and useful insights, but avoid oversharing >> Blogs/videos - demonstrate communication abilities and thought leadership >> Online communities - actively engage and build relationships
Ensure your profiles are professional and consistent. Let your technical abilities and potential speak for themselves.
Optimize Your Internship Applications
Applying isn’t enough. You must optimize your internship applications to get a reply:
>> Ensure you apply to openings that strongly match your profile >> Customize your resume and cover letters using keywords in the job description >> Speak to skills gained from coursework, online learning, and personal projects >> Quantify achievements rather than just listing responsibilities >> Emphasize passion for technology and fast learning abilities >> Ask insightful questions that show business understanding >> Follow up respectfully if you don’t hear back in 1-2 weeks >> Show interest in full-time conversion early and often >> Apply early since competitive openings close quickly >> Leverage referrals from your network if possible
This is how you do apply meaningfully. If you want a good internship, focus on the quality of applications. The hard work will pay off.
Succeed in Your Remote Internship
The hard work pays off when you secure that long-awaited internship! Continue standing out through the actual internship by:
>> Over Communicating in remote settings - proactively collaborate >> Asking smart questions and owning your learning >> Finding mentors and building connections remotely >> Absorbing constructive criticism with maturity >> Shipping quality work on or before deadlines >> Clarifying expectations frequently >> Going above and beyond prescribed responsibilities sometimes >> Getting regular feedback and asking for more work >> Leaving with letters of recommendation and job referrals
When you follow these tips, you are sure to succeed in your remote internship. Remember, soft skills can get you long ahead in the company, sometimes core skills can’t.
Conclusion
With careful preparation, tenacity, and a passion for technology, you will be able to get internships jobs in USA that suit your needs in the thriving IT sector.
Use this guide to build the right skills, create an impressive personal brand, ace the applications, and excel in your internship.
Additionally, you can browse some good job portals. For instance, GrandSiren can help you get remote tech internships. The portal has the best internship jobs in India and USA you’ll find.
The investment will pay dividends throughout your career in this digital age. Wishing you the best of luck! Let me know in the comments about your internship hunt journey.
#internship#internshipopportunity#it job opportunities#it jobs#IT internships#jobseekers#jobsearch#entryleveljobs#employment#gradsiren#graduation#computer science#technology#engineering#innovation#information technology#remote jobs#remote work#IT Remote jobs
5 notes
·
View notes
Text
KNIME Software: Empowering Data Science with Visual Workflows
By Dr. Chinmoy Pal
In the fast-growing field of data science and machine learning, professionals and researchers often face challenges in coding, integrating tools, and automating complex workflows. KNIME (Konstanz Information Miner) provides an elegant solution to these challenges through an open-source, visual workflow-based platform for data analytics, reporting, and machine learning.
KNIME empowers users to design powerful data science pipelines without writing a single line of code, making it an excellent choice for both non-programmers and advanced data scientists.
🔍 What is KNIME?
KNIME is a free, open-source software for data integration, processing, analysis, and machine learning, developed by the University of Konstanz in Germany. Since its release in 2004, it has evolved into a globally trusted platform used by industries, researchers, and educators alike.
Its visual interface allows users to build modular data workflows by dragging and dropping nodes (each representing a specific function) into a workspace—eliminating the need for deep programming skills while still supporting complex analysis.
🧠 Key Features of KNIME
✅ 1. Visual Workflow Interface
Workflows are built using drag-and-drop nodes.
Each node performs a task like reading data, cleaning, filtering, modeling, or visualizing.
✅ 2. Data Integration
Seamlessly integrates data from Excel, CSV, databases (MySQL, PostgreSQL, SQL Server), JSON, XML, Apache Hadoop, and cloud storage.
Supports ETL (Extract, Transform, Load) operations at scale.
✅ 3. Machine Learning & AI
Built-in algorithms for classification, regression, clustering (e.g., decision trees, random forest, SVM, k-means).
Integrates with scikit-learn, TensorFlow, Keras, and H2O.ai.
AutoML workflows available via extensions.
✅ 4. Text Mining & NLP
Supports text preprocessing, tokenization, stemming, topic modeling, and sentiment analysis.
Ideal for social media, survey, or academic text data.
✅ 5. Visualization
Interactive dashboards with bar plots, scatter plots, line graphs, pie charts, and heatmaps.
Advanced charts via integration with Python, R, Plotly, or JavaScript.
✅ 6. Big Data & Cloud Support
Integrates with Apache Spark, Hadoop, AWS, Google Cloud, and Azure.
Can scale to large enterprise-level data processing.
✅ 7. Scripting Support
Custom nodes can be built using Python, R, Java, or SQL.
Flexible for hybrid workflows (visual + code).
📚 Applications of KNIME
📊 Business Analytics
Customer segmentation, fraud detection, sales forecasting.
🧬 Bioinformatics and Healthcare
Omics data analysis, patient risk modeling, epidemiological dashboards.
🧠 Academic Research
Survey data preprocessing, text analysis, experimental data mining.
🧪 Marketing and Social Media
Campaign effectiveness, social media sentiment analysis, churn prediction.
🧰 IoT and Sensor Data
Real-time streaming analysis from smart devices and embedded systems.
🛠️ Getting Started with KNIME
Download: Visit: https://www.knime.com/downloads Choose your OS (Windows, Mac, Linux) and install KNIME Analytics Platform.
Explore Example Workflows: Open KNIME and browse sample workflows in the KNIME Hub.
Build Your First Workflow:
Import dataset (Excel/CSV/SQL)
Clean and transform data
Apply machine learning or visualization nodes
Export or report results
Enhance with Extensions: Add capabilities for big data, deep learning, text mining, chemistry, and bioinformatics.
💼 KNIME in Enterprise and Industry
Used by companies like Siemens, Novartis, Johnson & Johnson, Airbus, and KPMG.
Deployed for R&D analytics, manufacturing optimization, supply chain forecasting, and risk modeling.
Supports automation and scheduling for enterprise-grade analytics workflows.
📊 Use Case Example: Customer Churn Prediction
Workflow Steps in KNIME:
Load customer data (CSV or SQL)
Clean missing values
Feature engineering (recency, frequency, engagement)
Apply classification model (Random Forest)
Evaluate with cross-validation
Visualize ROC and confusion matrix
Export list of high-risk customers
This entire process can be done without any coding—using only the drag-and-drop interface.
✅ Conclusion
KNIME is a robust, scalable, and user-friendly platform that bridges the gap between complex analytics and practical use. It democratizes access to data science by allowing researchers, analysts, and domain experts to build powerful models without needing extensive programming skills. Whether you are exploring data science, automating reports, or deploying enterprise-level AI workflows, KNIME is a top-tier solution in your toolkit.
Author: Dr. Chinmoy Pal Website: www.drchinmoypal.com Published: July 2025
0 notes
Text
Live Online Data Analytics Institute in Delhi, Limited Period Offer "Free AI Course"
SLA Consultants India has emerged as a premier choice for live Online Data Analytics Training in Delhi, offering a program that combines industry-leading curriculum with flexible digital delivery and strong job placement guarantees. Their Live Online Data Analytics Course is particularly suited for learners seeking an interactive, practical training format without the constraints of in-person attendance—a structure ideal for today’s working professionals, university students, and anyone managing a demanding schedule. Through web and desktop-based sessions led by highly experienced MNC analysts, participants benefit from real-time instruction, guided assignments, and live doubt-clearing, making the virtual classroom as engaging and hands-on as traditional settings.
Central to SLA’s Data Analytics Course in Delhi approach is a curriculum that reflects current employer needs and the realities of the analytics sector. The training is divided into clear progression modules covering Advanced Excel, VBA/Macros automation, SQL and database management, MS Access, Power BI, Tableau, Alteryx, Python Data Science, and R programming. Learners also explore data visualization, business intelligence, and report automation, ensuring end-to-end expertise. The “live” aspect means students work directly on industry-simulated cases and client projects, receiving instant feedback and developing skills in data manipulation, statistical analysis, and the creation of impactful business dashboards. This experience is underpinned by workshops, assignment handouts, and practical tests, facilitating knowledge transfer from concept to workplace application.
A highlight of the Data Analytics Training Course in Delhi with Free AI Course included with enrollment. Taught by expert trainers, including IIT/NIT alumni, this module introduces the basics of artificial intelligence, machine learning, and Python-based data science. Integrating this advanced content with foundational analytics skills means graduates are future-proofed—ready not just for immediate data analyst roles but also for emerging opportunities at the intersection of AI, automation, and business intelligence. With all sessions recorded and made available for later review, the program suits both real-time learners and those who wish to revisit key lessons at their own pace.
Data Analyst Training Course Module 1 - Basic and Advanced Excel With Dashboard and Excel Analytics Module 2 - VBA / Macros - Automation Reporting, User Form and Dashboard Module 3 - SQL and MS Access - Data Manipulation, Queries, Scripts and Server Connection - MIS and Data Analytics Module 4 - MS Power BI | Tableau Both BI & Data Visualization Module 5 - Free Python Data Science | Alteryx/ R Programing Module 6 - Python Data Science and Machine Learning - 100% Free in Offer - by IIT/NIT Alumni Trainer
Placement support distinguishes SLA Consultants India’s live online institute from many competitors. After participants complete 70% of the training, the placement team arranges job interviews—committing to support until suitable placement is secured with leading MNCs and “Big 4” firms. The certification awarded is ISO 9001:2015, Skill India, and NSDC affiliated, highly valued by employers. In addition, learners enjoy seven-day administrative support, flexible scheduling, and the assurance that all technical and career-related queries will be addressed promptly. For anyone in Delhi seeking a live, interactive, up-to-date data analytics program—with a limited-time free AI module and a focus on real-world success—SLA Consultants Data Analytics Certification Course in Delhi offers an exceptionally strong and value-rich path into the analytics profession. For more details Call: +91-8700575874 or Email: [email protected]
0 notes
Text
Microsoft BI Consultants
Microsoft BI Consultants are professionals who specialize in implementing, customizing, and optimizing Microsoft’s Business Intelligence (BI) tools to help organizations make data-driven decisions. They have expertise in solutions like Power BI, SQL Server Reporting Services (SSRS), SQL Server Integration Services (SSIS), and SQL Server Analysis Services (SSAS). These consultants work closely with businesses to understand their data infrastructure and reporting needs, then design and implement tailored BI solutions that transform raw data into actionable insights.
They help build interactive dashboards, create automated reporting systems, and develop data models that provide deeper visibility into business performance. Their role often includes data integration from multiple sources, data warehousing, and applying analytics best practices to ensure data accuracy and consistency. Microsoft BI Consultants play a critical role in enabling business leaders to monitor KPIs, identify trends, and make strategic decisions backed by real-time data.
By leveraging Microsoft’s powerful suite of BI tools, they enable organizations to streamline operations, increase efficiency, and gain a competitive advantage. Whether a company is migrating to a new BI platform or looking to enhance its current analytics capabilities, these consultants provide the technical know-how and strategic guidance needed to drive successful BI initiatives across industries.
0 notes
Text
Revolutionizing Business with SQL Server 2022: The Ultimate Cloud-Connected Database
Empower Your Business with the Future of Data Connectivity
In today's rapidly evolving digital landscape, businesses are constantly seeking innovative solutions to stay ahead of the competition. SQL Server 2022 emerges as a groundbreaking platform that redefines how organizations manage, analyze, and leverage their data in the cloud era. This latest release offers unparalleled connectivity, security, and performance, making it the ideal choice for enterprises aiming to transform their operations. Discover how SQL Server 2022 can revolutionize your business by seamlessly integrating on-premises and cloud environments, ensuring agility and resilience in your data management strategies.
One of the most significant advancements in SQL Server 2022 is its enhanced cloud integration capabilities. Building on the foundation of hybrid cloud architectures, this platform enables businesses to extend their data ecosystems effortlessly. Whether you're running applications on-premises or leveraging cloud services like Azure, SQL Server 2022 ensures smooth interoperability, reducing complexity and operational costs. This seamless connectivity empowers organizations to adopt a flexible approach, scaling resources dynamically based on demand and strategic priorities.
Security remains a top concern for data-driven organizations, and SQL Server 2022 addresses this with robust features designed to safeguard sensitive information. From advanced encryption protocols to integrated threat detection, the platform provides comprehensive data security measures. Moreover, its ledger capabilities introduce blockchain-like features that enhance data integrity and transparency, crucial for compliance and audit requirements. These innovations give organizations peace of mind, knowing their data is protected against evolving cyber threats.
Performance optimization is another cornerstone of SQL Server 2022. With intelligent query processing and adaptive indexing, the platform accelerates data retrieval and analysis. This means faster insights, enabling decision-makers to respond swiftly to market changes. Additionally, the integration of AI-powered analytics tools simplifies complex data analysis tasks, making advanced insights accessible even to non-technical users. As a result, businesses can foster a data-driven culture that promotes innovation and competitive advantage.
Furthermore, SQL Server 2022 is designed to support a modern data platform architecture. It facilitates the integration of diverse data sources, including structured, semi-structured, and unstructured data, into a unified ecosystem. This versatility allows organizations to harness the full potential of their data assets, whether for real-time analytics, machine learning, or operational reporting. The platform's cloud-native features also ensure high availability, disaster recovery, and scalability, minimizing downtime and ensuring continuous business operations.
To learn more about how SQL Server 2022 is transforming data management, visit The Most Cloud-Connected Database Yet: Transforming Your Business with SQL Server 2022. Embrace the future of cloud-connected data solutions and unlock new possibilities for your enterprise. With its innovative features and strategic advantages, SQL Server 2022 is set to become the backbone of modern, agile, and secure business ecosystems.
#SQL Server 2022#Cloud-Connected Database#Hybrid Cloud Solutions#Data Security#Query Optimization#Digital Transformation#Modern Data Platform
0 notes
Text
Magento 2 Security Extension — Protect Your Store from the Inside Out
Running an eCommerce business on Magento 2 gives you power, flexibility, and performance. But with great power comes great responsibility—especially when it comes to security. Magento is a widely used platform, making it a common target for cyber threats, data breaches, and fraud. That’s why installing a Magento 2 Security Extension is one of the smartest decisions any store owner can make.
This article explores how security extensions safeguard your Magento 2 store, how address validation plays a key role in fraud prevention, and which features you should prioritize when choosing the right security solution.
Why Magento 2 Needs Security Enhancements
Magento 2 offers solid built-in security features, including two-factor authentication (2FA), file system permissions, and CAPTCHA. However, these tools aren’t always enough. Most store owners still face threats like:
Fake user registrations
Fraudulent orders
Bot attacks
SQL injections
Data tampering
Checkout manipulation
Because Magento 2 is open-source and highly customizable, vulnerabilities can emerge through third-party modules, outdated plugins, or improper server configurations. A dedicated security extension provides an extra layer of defense against such risks.
The Hidden Threat: Invalid or Fake Addresses
One of the most overlooked security gaps in Magento 2 stores is invalid or fake address entries during checkout. Cybercriminals and bots often use fake addresses to:
Test stolen credit cards
Place high-risk or fraudulent orders
Flood your system with fake data
Manipulate shipping or billing info to trigger chargebacks
This is where address validation steps in—not just as a logistics tool, but as a powerful security filter.
How Address Validation Boosts Magento 2 Security
An address validation extension like the one offered by EcomPlugins doesn't just help verify locations for delivery—it helps verify the user’s intent and legitimacy.
Here’s how it strengthens your store’s security:
1. Detects Suspicious Address Patterns
Invalid zip codes, incomplete fields, or mismatched city-state combinations are red flags. Automatically detecting these issues helps you block risky transactions before they occur.
2. Reduces Chargebacks and Payment Disputes
A significant number of fraudulent orders use fake billing addresses. Real-time validation ensures that billing information aligns with what payment gateways expect, reducing the risk of false disputes.
3. Prevents Fake User Registrations
If your extension validates addresses at registration (or checkout), it becomes harder for bots or scammers to create dummy accounts with fake data.
4. Enhances Data Integrity
Address validation ensures that your CRM, analytics tools, and marketing automations only work with clean, verified data—essential for both security and performance.
Features to Look for in a Magento 2 Security Extension
While address validation is a great start, here are additional features to look for in a well-rounded Magento 2 security extension:
1. Two-Factor Authentication (2FA)
Adds an extra layer of login protection by requiring a secondary code, usually sent to a device.
2. IP Whitelisting and Blacklisting
Control which IPs can access your admin panel and block suspicious or high-risk addresses.
3. Login Attempt Limits
Prevent brute-force attacks by locking users out after a certain number of failed login attempts.
4. Admin URL Customization
Change your default admin URL so that bots and hackers can't easily guess where to target attacks.
5. Firewall Rules
Use application-level firewalls to filter traffic, restrict bots, and block known attackers.
6. Activity Logs and Alerts
Monitor admin and customer activity in real-time. Automated alerts notify you of suspicious behavior like multiple failed logins or bulk data exports.
EcomPlugins: Secure Checkout with Built-in Address Validation
If you're looking for a lightweight yet powerful solution to improve your Magento 2 store’s security, EcomPlugins’ Magento 2 Address Validation extension is a great place to start.
Here’s what sets it apart:
USPS-based real-time address verification
Validation for both billing and shipping addresses
Auto-suggestions for correcting typos and missing details
Support for U.S. merchants and USPS standards
Quick installation and Magento 2 compatibility
Although primarily focused on logistics, this extension acts as a security filter by preventing invalid or malicious addresses from slipping through your checkout.
Why Security = Trust = Higher Conversions
Security isn’t just about protecting your site—it’s about protecting your customers. Shoppers are becoming more cautious about who they buy from. Even a small sign of weakness, like a failed order or shipping error, can reduce trust and hurt conversion rates.
By using a security-enhancing tool like an address validation extension, you demonstrate professionalism, protect customer data, and improve fulfillment accuracy—all of which build long-term trust.
Final Thoughts
Magento 2 is a powerful eCommerce platform, but it’s not invulnerable. Cyber threats are evolving every day, and relying solely on default security settings is risky. A Magento 2 Security Extension—especially one with built-in address validation—can be your first line of defense against fraudulent behavior, shipping errors, and data integrity issues.
For store owners who want to secure their operations and deliver a flawless checkout experience, EcomPlugins’ Magento 2 Checkout Address Validation extension offers the perfect blend of security, usability, and logistics support.
Protect your store from the inside out—start with smarter address validation today.
0 notes
Text
What are different components of SAP HANA or explain Architecture?
SAP HANA (High-Performance Analytic Appliance) is an in-memory, column-oriented, relational database management system designed for high-speed data processing and real-time analytics. Its architecture comprises several key components:
Index Server: The core component that contains the actual data engines for processing SQL/MDX, transaction management, and query execution. It handles all the database operations.
Name Server: Maintains metadata and topology information of the distributed landscape and manages the names and locations of HANA instances.
Preprocessor Server: Used for text processing and handles extraction of information from unstructured data (like PDFs).
XS Engine (Extended Application Services): Allows development and hosting of web-based applications within the HANA platform.
SAP HANA Studio: An Eclipse-based tool for administration, modeling, and data provisioning.
Persistence Layer: Manages data storage and ensures durability using save-points and logs in case of system failure.
Connection & Integration Layer: Supports connectivity via JDBC, ODBC, and other interfaces for third-party applications.
SAP HANA’s in-memory processing and parallel architecture provide extremely fast performance, making it suitable for both OLAP and OLTP workloads.

Anubhav Trainings provides in-depth, hands-on training on SAP HANA architecture, covering each component with real-time scenarios. With expert trainer Anubhav Oberoy, learners not only grasp theory but also gain practical insights, making them job-ready in today’s competitive SAP market.
#online sap training#online free sap training#sap ui5 training#online sap ui5 training#ui5 fiori training#free sap training#sap abap training
0 notes
Text
Why Bharathi Degree College is Ideal for BSc Data Science
Introduction: The Rising Demand for Data Science in India
India is undergoing a data revolution. From e-commerce and healthcare to education and finance, every industry now thrives on data-driven decision-making. As organizations across the globe invest heavily in analytics, India’s demand for data science professionals is projected to grow by over 35% annually, according to NASSCOM. Amid this promising scenario, selecting the right undergraduate program becomes crucial for aspiring data scientists.
For students, entrepreneurs, developers, and even professionals looking to transition into tech-driven careers, choosing the best degree college in Warangal can open doors to future-proof opportunities. Bharathi Degree College, a trusted name in Telangana’s education landscape, has emerged as a preferred destination for pursuing BSc Data Science. Here’s why.
Why Choose BSc Data Science at Bharathi Degree College?
1. A Modern Curriculum Built for the Digital Era
Bharathi Degree College offers a cutting-edge BSc Data Science program tailored to meet the current industry standards. The curriculum blends core subjects such as:
Statistics and Mathematics
Programming in Python and R
Machine Learning & AI
Data Visualization (Power BI, Tableau)
Big Data Technologies
SQL, NoSQL, and Data Warehousing
Each course module is updated regularly with industry input to keep students aligned with the latest trends in data analytics, cloud computing, and automation.
Expert Quote "We work closely with leading IT professionals and industry consultants to revise our syllabus annually. Our aim is to prepare students not just for their first job, but for leadership in the data-driven world." — Dr. Praveen Kumar, Head of Data Science Department, Bharathi Degree College
2. State-of-the-Art Infrastructure and Lab Facilities
In today’s education environment, having access to high-performance systems, cloud tools, and licensed software is non-negotiable. Bharathi Degree College invests heavily in modern labs that support data mining, visualization, coding, and machine learning simulations.
Students benefit from:
Smart classrooms with real-time projectors
Fully-equipped computer labs with high-speed internet
Cloud-access to Jupyter notebooks, AWS, Azure tools
In-house servers for managing real datasets
These resources ensure hands-on experience for students, bridging the gap between theoretical learning and real-world application.
3. Strong Placement Support in Data and Tech Domains
One of the strongest aspects of Bharathi Degree College is its consistent placement track record, particularly in data-driven roles.
Top recruiters include:
Infosys
Wipro
TCS
Deloitte
Tech Mahindra
Startups focused on AI and analytics
The college’s Career Development Cell (CDC) provides mock interviews, resume-building workshops, LinkedIn profile optimization, and internship guidance—essential tools to compete in the modern job market.
Statistical Insight: Over 85% of BSc Data Science graduates from Bharathi Degree College in the last three years secured placements within six months of graduation.
4. Warangal: An Emerging Tech and Education Hub
When it comes to pursuing higher education in India, Warangal stands out for its peaceful academic environment, cost-effective living, and growing connectivity to major IT corridors like Hyderabad.
As a city, Warangal is fast becoming a secondary tech hub, drawing investments in data centers, analytics labs, and skill-based academies. For students enrolled at Bharathi Degree College, this ecosystem offers internship opportunities and exposure to real-world problems that fuel innovation.
Value-Added Programs and Certifications
Bharathi Degree College goes beyond the classroom with:
Add-on certifications in Data Analytics with Python, Power BI, and AI Ethics
Collaboration with digital marketing agencies for SEO case studies
Cross-discipline electives in business analytics, web technologies, and statistics for management
Dedicated workshops in SEO in Warangal to teach students how data fuels search engine trends and marketing ROI
Expert View: "We integrate digital marketing fundamentals, including SEO, into our data science electives so students understand how analytics drives online visibility." — Prof. Meena Sharma, Academic Advisor, Bharathi Degree College
Real-World Application and Industry Projects
Students in the Data Science program are encouraged to work on live projects in collaboration with startups, government data missions, and local businesses. Some recent student projects include:
Predictive analytics model for online shopping behavior
Warangal municipal data dashboard for waste collection
Crime pattern analysis using Telangana Police datasets
This project-based learning ensures that every student develops not just knowledge, but demonstrable skills.
Offers and Admission Information (2025-2026)
Limited-Time Admissions Offer:
For the 2025–2026 academic year, Bharathi Degree College is offering:
Early Bird Fee Waiver: ₹10,000 off for enrollments before August 15
Free Certification Add-on: Complimentary registration for a Google Data Analytics certificate
Scholarship Guidance: Help with accessing Telangana State scholarships and private merit awards
Seats are limited due to high demand for the BSc Data Science stream.
Eligibility: Minimum 10+2 with Mathematics or Statistics as one of the core subjects.
Contact: Visit bharathieducationalsociety.com or call the Admissions Office directly.
Frequently Asked Questions (FAQs)
Q1. What makes Bharathi Degree College different from other degree colleges in Warangal? Bharathi combines academic excellence with industry-driven curriculum, ensuring its students are job-ready. Its emphasis on data analytics, project-based learning, and placements makes it stand out.
Q2. Is programming knowledge mandatory to join BSc Data Science? No. The course starts with foundational programming and builds gradually, making it suitable for both beginners and students from non-technical backgrounds.
Q3. Are there opportunities for internships? Yes. The college partners with local businesses, analytics firms, and startups in Warangal and Hyderabad to offer internships and real-world exposure.
Q4. What is the future scope of BSc Data Science from Bharathi Degree College? Graduates can work as Data Analysts, Business Intelligence Experts, Junior Data Scientists, and go on to pursue MSc, MBA in Business Analytics, or even international education.
Closing Thoughts: A Future-Ready Choice in a Data-Driven World
In an era where data is the new oil, the right educational foundation can determine your future career trajectory. Bharathi Degree College, with its holistic approach, advanced curriculum, and commitment to skill development, offers one of the best degree college in Warangal in India.
Whether you're a student exploring modern tech careers, a business owner wanting to upskill, or a parent investing in your child's future, Bharathi provides the kind of value-driven education that pays dividends for life.
Choose wisely. Choose future-ready. Choose Bharathi.
0 notes
Text
ETL at Scale: Using SSIS for Big Data Workflows
In today's data-driven world, managing and processing large volumes of data efficiently is crucial for businesses. Enter ETL (Extract, Transform, Load) processes, which play a vital role in consolidating data from various sources, transforming it into actionable insights, and loading it into target systems. This blog explores how SQL Server Integration Services (SSIS) can serve as a powerful tool for managing ETL workflows, especially when dealing with big data.
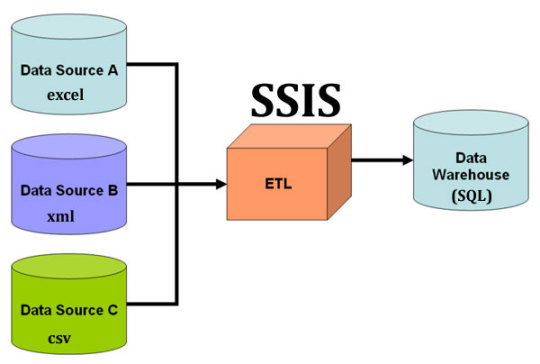
ETL Process
Introduction to ETL (Extract, Transform, Load)
ETL is a fundamental data processing task that involves three key steps:
Extract: Retrieving raw data from various sources, such as databases, flat files, or cloud services.
Transform: Cleaning, standardizing, and enriching the data to fit business needs.
Load: Ingesting the transformed data into target databases or data warehouses for analytics.
These steps are essential for ensuring data integrity, consistency, and usability across an organization.
Overview of SQL Server Integration Services (SSIS)
SSIS is a robust data integration platform from Microsoft, designed to facilitate the creation of high-performance data transformation solutions. It offers a comprehensive suite of tools for building and managing ETL workflows. Key features of SSIS include:
Graphical Interface: SSIS provides a user-friendly design interface for building complex data workflows without extensive coding.
Scalability: It efficiently handles large volumes of data, making it suitable for big data applications.
Extensibility: Users can integrate custom scripts and components to extend the functionality of SSIS packages.
Data Flow vs. Control Flow
Understanding the distinction between data flow and control flow is crucial for leveraging SSIS effectively:
Data Flow: This component manages the movement and transformation of data from sources to destinations. It involves tasks like data extraction, transformation, and loading into target systems.
Control Flow: This manages the execution workflow of ETL tasks. It includes defining the sequence of tasks, setting precedence constraints, and handling events during package execution.
SSIS allows users to orchestrate these flows to create seamless and efficient ETL processes.
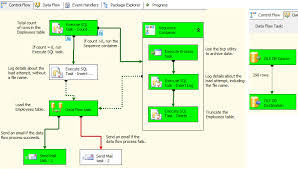
Data Flow vs. Control Flow
Integrating Data from Flat Files, Excel, and Cloud Sources
One of the strengths of SSIS is its ability to integrate data from a variety of sources. Whether you're working with flat files, Excel spreadsheets, or cloud-based data, SSIS provides connectors and adapters to streamline data integration.
Flat Files: Importing data from CSV or text files is straightforward with built-in SSIS components.
Excel: SSIS supports Excel as a data source, facilitating the extraction of data from spreadsheets for further processing.
Cloud Sources: With the rise of cloud-based services, SSIS offers connectors for platforms like Azure and AWS, enabling seamless integration of cloud data into your ETL workflows.
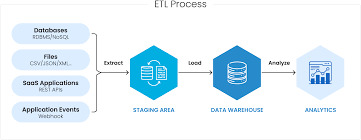
Integrating Data
Scheduling and Automation of ETL Tasks
Automation is key to maintaining efficient ETL processes, especially when dealing with big data. SSIS provides robust scheduling and automation capabilities through SQL Server Agent. Users can define schedules, set up alerts, and automate the execution of ETL packages, ensuring timely and consistent data processing.
By leveraging these features, organizations can minimize manual intervention, reduce errors, and ensure data is readily available for decision-making.
Frequently Asked Questions
1. What is the primary benefit of using SSIS for ETL?
SSIS provides a powerful and scalable platform for managing data integration tasks. Its graphical interface and extensive toolset make it accessible for users to build complex ETL solutions efficiently.
2. Can SSIS handle real-time data processing?
While SSIS is primarily designed for batch processing, it can integrate with real-time data sources using additional components and configurations. However, it might require advanced setup to achieve true real-time processing.
3. How does SSIS facilitate error handling in ETL processes?
SSIS offers robust error handling mechanisms, including event handlers, try-catch blocks, and logging features. These tools help identify and manage errors during ETL execution, ensuring data integrity.
4. Is SSIS suitable for cloud-based data sources?
Yes, SSIS supports integration with various cloud platforms, such as Azure and AWS, through dedicated connectors. This makes it suitable for cloud-based data processing tasks.
5. What are some best practices for optimizing SSIS performance?
To optimize SSIS performance, consider parallel processing, using SQL queries for data filtering, minimizing transformations in the data flow, and optimizing memory usage. Regular monitoring and tuning can also enhance performance.
By implementing these best practices, organizations can ensure their ETL processes are efficient and capable of handling large-scale data operations.
Home
instagram
youtube
#SSIS#DataIntegration#ETL#BigDataPipeline#SQLServerTools#DataWorkflow#Automation#SunshineDigitalServices#DataMigration#BusinessIntelligence#Instagram#Youtube
0 notes