#tableau tutorial for data science
Explore tagged Tumblr posts
Visit Tumblr Blog
Explore Tumblr blogs with no restrictions, modern design and the best experience.
Last Seen Tumblr Blogs


Fun Fact
Tumblr’s reach among the 26-to-35-year-olds in the US is 11%.
Text
Tableau Data Science Tutorial For Beginners | Tableau Training | Edureka | Tableau Live - 1
Edureka Tableau Certification Training: This Edureka’s video on “Tableau … source
0 notes
Text
Industry-Leading Visualization with Tableau Data Visualization

1. User-Friendly Interface: The intuitive design allows anyone to easily start visualizing data.
2. Seamless Integration: Connects easily with various data sources for efficient analysis.
3. Quick Insights: Generate actionable insights within minutes.
4. Integrated Collaboration Tools: Share dashboards and insights with your team effortlessly.
5. Regular Updates: Tableau continuously evolves with new features and improvements.
Want to take your skills to the next level? Join our 1-day Tableau Bootcamp on 2nd November (Online)!
#tableau#tableau software#data visualization#data visualisation#dataviz#software#technology#cavillion#cavillion learning#data analytics#data#tableau online training#tableaudesktop#tableau dashboard#big data#business analytics#data analysis#data science#tableau course#salesforce#Tableau Tutorial#Tableau Visualization#Tableau Training#learn tableau#tableau certification#Tableau Visualisation
1 note
·
View note
Note
Hi, I just got into tech (actually 1 year in but I still feel like I don't know anything).
I learnt python, R, SQL, Tableau and concepts in Data Structures, Algorithms.
[Just the Basic level of the listed.]
But I can't write my own programs on python or create anything.
I was hella impressed by your microprocessor project, and when I took up tech (ai and data science) I assumed I would do something like that or at least code.
Now, I am just venting but where do I start, how do I make projects what are some interesting projects, what should I learn? A lot of my seniors tell me to have a wide range of knowledge like focus on one thing by depth but add other things. For example: you can study data analytics in depth but have some knowledge in ethical hacking and web development etc. Like an all rounder.
Wow ok a lot to unpack here, I'll get started
Lots of places recommend that you start with Arduino, as there are a lot of good tutorials out there. I somewhat disagree
I think that raspberry pi is better because it's usually a lot cheaper to buy the stuff you want to play around with
But an even cooler way to do it, go to wokwi.com and start a project on a Raspberry Pi Pico (make sure it's the micropython version) and then you can get started there
Google something like "Blink led with Pi Pico micropython" and there will be a tutorial or two
Then, once you've played around for a while you can buy a Pi Pico for very little money and see your stuff work irl!
If you need any more help or have any questions, feel free to DM me and I'll see what I can do
#micropython#coding#python#raspberry pi#raspberry pi pico#programming#microprocessors#microcontroller#microcontrollers
6 notes
·
View notes
Text
Cracking the Code: A Beginner's Roadmap to Mastering Data Science
Embarking on the journey into data science as a complete novice is an exciting venture. While the world of data science may seem daunting at first, breaking down the learning process into manageable steps can make the endeavor both enjoyable and rewarding. Choosing the best Data Science Institute can further accelerate your journey into this thriving industry.
In this comprehensive guide, we'll outline a roadmap for beginners to get started with data science, from understanding the basics to building a portfolio of projects.
1. Understanding the Basics: Laying the Foundation
The journey begins with a solid understanding of the fundamentals of data science. Start by familiarizing yourself with key concepts such as data types, variables, and basic statistics. Platforms like Khan Academy, Coursera, and edX offer introductory courses in statistics and data science, providing a solid foundation for your learning journey.
2. Learn Programming Languages: The Language of Data Science
Programming is a crucial skill in data science, and Python is one of the most widely used languages in the field. Platforms like Codecademy, DataCamp, and freeCodeCamp offer interactive lessons and projects to help beginners get hands-on experience with Python. Additionally, learning R, another popular language in data science, can broaden your skill set.
3. Explore Data Visualization: Bringing Data to Life
Data visualization is a powerful tool for understanding and communicating data. Explore tools like Tableau for creating interactive visualizations or dive into Python libraries like Matplotlib and Seaborn. Understanding how to present data visually enhances your ability to derive insights and convey information effectively.
4. Master Data Manipulation: Unlocking Data's Potential
Data manipulation is a fundamental aspect of data science. Learn how to manipulate and analyze data using libraries like Pandas in Python. The official Pandas website provides tutorials and documentation to guide you through the basics of data manipulation, a skill that is essential for any data scientist.
5. Delve into Machine Learning Basics: The Heart of Data Science
Machine learning is a core component of data science. Start exploring the fundamentals of machine learning on platforms like Kaggle, which offers beginner-friendly datasets and competitions. Participating in Kaggle competitions allows you to apply your knowledge, learn from others, and gain practical experience in machine learning.
6. Take Online Courses: Structured Learning Paths
Enroll in online courses that provide structured learning paths in data science. Platforms like Coursera (e.g., "Data Science and Machine Learning Bootcamp with R" or "Applied Data Science with Python") and edX (e.g., "Harvard's Data Science Professional Certificate") offer comprehensive courses taught by experts in the field.
7. Read Books and Blogs: Supplementing Your Knowledge
Books and blogs can provide additional insights and practical tips. "Python for Data Analysis" by Wes McKinney is a highly recommended book, and blogs like Towards Data Science on Medium offer a wealth of articles covering various data science topics. These resources can deepen your understanding and offer different perspectives on the subject.
8. Join Online Communities: Learning Through Connection
Engage with the data science community by joining online platforms like Stack Overflow, Reddit (e.g., r/datascience), and LinkedIn. Participate in discussions, ask questions, and learn from the experiences of others. Being part of a community provides valuable support and insights.
9. Work on Real Projects: Applying Your Skills
Apply your skills by working on real-world projects. Identify a problem or area of interest, find a dataset, and start working on analysis and predictions. Whether it's predicting housing prices, analyzing social media sentiment, or exploring healthcare data, hands-on projects are crucial for developing practical skills.
10. Attend Webinars and Conferences: Staying Updated
Stay updated on the latest trends and advancements in data science by attending webinars and conferences. Platforms like Data Science Central and conferences like the Data Science Conference provide opportunities to learn from experts, discover new technologies, and connect with the wider data science community.
11. Build a Portfolio: Showcasing Your Journey
Create a portfolio showcasing your projects and skills. This can be a GitHub repository or a personal website where you document and present your work. A portfolio is a powerful tool for demonstrating your capabilities to potential employers and collaborators.
12. Practice Regularly: The Path to Mastery
Consistent practice is key to mastering data science. Dedicate regular time to coding, explore new datasets, and challenge yourself with increasingly complex projects. As you progress, you'll find that your skills evolve, and you become more confident in tackling advanced data science challenges.
Embarking on the path of data science as a beginner may seem like a formidable task, but with the right resources and a structured approach, it becomes an exciting and achievable endeavor. From understanding the basics to building a portfolio of real-world projects, each step contributes to your growth as a data scientist. Embrace the learning process, stay curious, and celebrate the milestones along the way. The world of data science is vast and dynamic, and your journey is just beginning. Choosing the best Data Science courses in Chennai is a crucial step in acquiring the necessary expertise for a successful career in the evolving landscape of data science.
3 notes
·
View notes
Text
How to become a Data Scientist without a tech background
All professionals from every corner of the world are creating careers as data scientists in the present data-driven era. Regardless of which profession you are from, all professions, whether marketing, HR, finance, or education, the career shift is possible even if you don't have technical skills. If you are thinking of how to make a career change to become a data scientist without any technical background, then you are at the right article. With the right attitude change, nice tools, and uncomplicated learning paths, you can smoothly make a career shift toward working as a data scientist. This article offers practical tips on learning data science for beginners and no-code options.
Why data science is for everyone
The increasing demand for data-driven decision-making has created a never-before-seen talent shortage for data science, thereby opening the profession to non-traditional candidates. Companies no longer confine themselves to hiring graduates with technical education; they take the extra step to hire individuals who have the skill to turn jumbled data into clean, meaningful output. If you are from a business, comms, or research background, then you most likely already have transferable skills such as problem-solving, analytical, and story skills, all of which are highly valued in data science.
Step-by-step: How to become a Data Scientist without a tech background
It is always a great idea to know what they do before entering Data Science. Data scientists will unearth sound information from heaps of data through statistical analysis, machine learning, and visualization techniques.
Read about it, and if this is the path you'd like to follow, do the following:
1. Familiarise yourself with basic statistics and math
Even if you are not a mathematically talented individual, it is still possible to become a master of descriptive and inferential statistics, probability distributions, and linear correlation and regression. They are precursors to mastering algorithms and reading data.
2. Master Excel, SQL, and other visualization tools
For non-tech to data science, beginning with something you already understand, Excel is a good start. SQL is a good starting point and an entry to extracting data. Tableau, Power BI, and Google Data Studio are master tools; once you are familiar with them, no code and drag-and-drop interfaces are needed.
3. Select the right programming language
If you're ready to try coding, begin with Python. It is easy to learn and has a massive community following. Learn via interactive lessons on Codecademy or DataCamp.
4. Enroll in an online course that offers a structured curriculum
Look for beginner-level courses labeled data science for beginners. Opt for those that start with visualization tools, clearly define concepts, and have mentorship. Imarticus Learning's Postgraduate Program in Data Science and Analytics is a good place to start.
6. Build actual projects
Start small, use public datasets (Kaggle, UCI Repository), create dashboards, and build simple models through tutorial-led guides. These get your portfolio going and build confidence.
7. Network and communities
Membership in the data science community keeps you inspired and learn from your peers. You may join LinkedIn groups, meetups online, or boot camps initiated by peers.
Best online courses to enroll in
Imarticus Learning offers a line of industry-relevant programs that marry academic strength with real-world application, suitable for career-changers and freshers who wish to begin or switch to data-related functions.
Postgraduate Certificate in Data Science and Analytics works well for career changers and new graduates since the program surveys some important tools (Tableau, machine learning, and Python) and has project work plus placement support to prepare students for real-world success when they work in data science roles.
Data Analytics and Machine Learning Certificate Program: This certificate program highlights hands-on skills, connecting core ideas with the applied tools (Excel, SQL, and Python) that data scientists need to master. Students get practice applying analytics skills to real case studies and develop strong, applied skills in working with and interpreting data.
Advanced Data Science and AI certification: This advanced certification program covers advanced topics, including AI, deep learning, and data modeling, has mentoring and real-life projects, all focused on developing both skills and strategy.
All the programs are career-focused, providing committed professionals with the skills, knowledge, and support to be successful in a data-centric world.
Common Misconceptions about a Transition into Data Science
Myth 1: "I need to be a coding mastermind."
Reality: No, you don't. Coding is convenient, I suppose, but most jobs take for granted the value of problem-solving, manipulating data, and eventually applying examples or some accessories that imply minimal scripting. Most of the time, having a good analytical mind is more important than becoming Python-savvy within a day.
Myth 2: "I am too old to pivot careers."
Reality: No way! Most people change careers and become data scientists in their 30s, 40s, or beyond. Being an adaptable learner might even be a plus for you.
Myth 3: "I can't get into data science without a degree."
Reality: Degree - of course, useful, but not a massive deal breaker. Employers will care more about applied skills, experience working with real projects, certification proving you can actually apply information to real-world problems, etc.
FAQs
Do I require programming skills to be a data scientist?
Yes, most entry-level career roles do not care so much about coding and would prefer analysis, visualisation, and communication.
What is the first step I take to transition into data science from a non-technical background?
Start with data and statistics tools like Excel and Tableau.
Is there any data science that can be done without programming?
Yes, a data analyst or business intelligence analyst will normally have minimal or no programming needs.
How long does it take to become a data scientist?
Generally, 6 to 12 months of sustained learning and project practice will suffice.
Do employers hire for online course certifications?
Yes, especially with real-world projects. And with a good portfolio.
What are some good tools for someone who's a beginner?
Excel, Tableau, Google Data Studio, and SQL are good starting points.
Do you have to know math to learn data science?
You require basic algebra and statistics, but not heavy math.
What industries are hiring non-technical data scientists?
The best industries are marketing, finance, education, logistics, and healthcare.
What is the compensation range for non-technical freshers in data positions?
Starting pay is INR 4–6 LPA and increases depending on experience and efficiency.
Conclusion
It is very possible to become a data scientist without any technical knowledge. You can become a data scientist, no matter where you start. Start your data science career with Imarticus Learning's Postgraduate Programme in Data Science and Analytics. Learn from professionals, apply theoretical knowledge in real-world projects and begin a high-performing data science career. Start now.
0 notes
Text
How to Market Yourself as a Data Professional on LinkedIn?

In the dynamic and highly competitive world of data science, being good at your craft isn't enough. You need to be seen as good. And in 2025, there's no better platform for data professionals to build their personal brand, showcase expertise, and unearth opportunities than LinkedIn.
Think of LinkedIn not just as a job board, but as your professional portfolio, networking hub, and personal publishing platform rolled into one. Leveraging it strategically can open doors you never knew existed.
Here's how to market yourself as a data professional on LinkedIn like a pro:
1. Optimize Your Profile: Your Digital Shop Window
Your LinkedIn profile is your professional storefront. Make it shine!
Headline (Your AI-Powered Elevator Pitch): This is prime real estate. Don't just list your job title. Use keywords to clearly state your expertise and aspirations.
Instead of: "Data Scientist at XYZ Corp"
Try: "Senior Data Scientist | Machine Learning Engineer | NLP Specialist | Driving Business Impact with AI | Python, SQL, Cloud"
About Section (Your Narrative): Go beyond a dry summary. Craft a compelling story about your journey, passions, and the kind of impact you want to make. Highlight your key skills and areas of interest. Use keywords naturally throughout.
Experience (Quantify Your Impact): For each role, don't just list responsibilities. Focus on achievements and quantify them with metrics.
Instead of: "Developed machine learning models."
Try: "Developed and deployed predictive models for customer churn, resulting in a 15% reduction in churn rate and $X million in annualized savings."
Skills (The Algorithm's Friend): Be comprehensive. List relevant technical skills (Python, R, SQL, TensorFlow, PyTorch, AWS, Azure, GCP, Spark, Tableau, Power BI) and crucial soft skills (communication, problem-solving, collaboration, critical thinking, storytelling with data). Get endorsements from colleagues.
Education & Certifications: Showcase your academic background, specialized bootcamps, and industry certifications (e.g., AWS Certified Machine Learning Specialty, Google Cloud Professional Data Engineer).
Recommendations: Actively request recommendations from former managers, colleagues, or clients who can speak to your skills, work ethic, and impact. These are gold.
2. Showcase Your Work: Let Your Projects Speak
A data professional's portfolio is their strongest resume. LinkedIn's Project and Posts features are perfect for this.
Projects Section: This is where you link out to your work.
GitHub: Share links to well-documented code repositories.
Kaggle: Link your profile if you're active in competitions or sharing notebooks.
Personal Website/Blog: If you have one, link to case studies or interactive dashboards.
Interactive Dashboards: Share links to your Tableau Public, Power BI, or Streamlit apps that showcase your data visualization and storytelling skills.
Posts/Articles: Regularly share updates on your projects. Describe the problem, your approach, the tools you used, and the insights gained. Visuals (charts, screenshots) are highly encouraged.
3. Engage Strategically: Be Part of the Conversation
LinkedIn is a two-way street. Don't just broadcast; engage!
Follow Industry Influencers & Companies: Stay updated on trends, new technologies, and hiring announcements. Engage thoughtfully with their content.
Join Relevant Groups: Participate in data science, AI, ML, or industry-specific groups. Ask questions, offer insights, and share relevant resources.
Comment Thoughtfully: Don't just "like" posts. Add value by sharing your perspective, asking clarifying questions, or contributing additional information. This helps you get noticed.
Share Relevant Content: Curate insightful articles, research papers, industry news, or helpful tutorials. Position yourself as someone who stays informed and shares valuable knowledge.
4. Create Your Own Content: Establish Thought Leadership
This is where you move from being seen as a data professional to being seen as a leader in data.
LinkedIn Articles: Use this for longer-form content. Write detailed tutorials, share case studies of your projects, discuss industry trends, or offer career advice for aspiring data scientists.
Short Posts: Quick tips, observations, interesting findings from a dataset, or questions to spark discussion. Polls are great for engagement.
"Carousels" / Document Posts: Create visually appealing, multi-slide posts that summarize complex concepts, project steps, or key takeaways. These are highly shareable and engaging.
Video: Consider short videos explaining a concept or walking through a quick demo.
5. Network Proactively: Build Genuine Connections
LinkedIn is fundamentally about connections.
Personalized Connection Requests: Always, always, always add a personalized note. Explain why you want to connect (e.g., "Enjoyed your recent post on MLOps," "Saw your work at [company] and admire [project]").
Attend Virtual Events/Webinars: LinkedIn often hosts or promotes these. Engage with speakers and other attendees in the chat.
Informational Interviews: Reach out to experienced professionals in roles or companies that interest you. Request a brief virtual coffee chat to learn about their journey and advice (be respectful of their time and prepare specific questions).
Common Mistakes to Avoid
Generic Profile: A bare-bones profile tells recruiters nothing.
No Activity: A static profile suggests disinterest or lack of current engagement.
Only Applying for Jobs: If your only activity is applying for jobs, you miss out on building a reputation that attracts opportunities.
Poorly Articulated Achievements: Don't assume recruiters understand the technical jargon. Translate your impact into business value.
By consistently implementing these strategies, you'll transform your LinkedIn profile into a dynamic, compelling representation of your skills, expertise, and passion for data. It's not just about finding your next job; it's about building a sustainable personal brand that positions you as a valuable asset in the ever-evolving data landscape. Start marketing yourself today!
#technology#artificial intelligence#ai#online course#data science course#data science#data professional
0 notes
Text
How to Switch From a Non-Tech Background to Data Science: A Step-by-Step Guide
Data science is one of the most exciting and rapidly evolving fields today. With businesses relying heavily on data to drive decisions, professionals who can extract insights from complex datasets are in high demand. If you come from a non-tech background, the thought of transitioning into this realm might feel daunting, but it’s achievable!
Imagine being able to tell compelling stories with numbers, help organizations make informed choices, or even predict future trends. The world of data science opens doors not just for tech enthusiasts but for anyone willing to learn and adapt. This guide will walk you through how to switch gears and embark on an exhilarating career in data science—a journey that starts with understanding foundational skills and takes you through job opportunities tailored for beginners like yourself. Let’s dive in!

Understand What Data Science Is
Before diving in, it's essential to understand what data science entails and how it fits into today’s business and technology landscape. At its core, data science is about using data to derive insights and solve problems. It combines skills from statistics, computer science, and domain expertise to analyze data, build models, and support decision-making.
This doesn’t mean you need to be a math wizard or a coding prodigy. What matters most is your ability to learn and apply concepts to real-world problems.
Identify Your Transferable Skills
You might be surprised to learn that many skills from non-tech backgrounds—like communication, problem-solving, and domain knowledge—are highly valued in data science.
For example:
Marketing professionals bring customer insight and analytical thinking.
Finance experts understand data-driven decision-making.
Educators often excel in structured thinking and clear communication.
Project managers know how to coordinate, report, and evaluate performance.
Recognizing these transferable skills can boost your confidence and help you position yourself effectively when job hunting.
Learn the Core Concepts and Tools
To succeed in data science, you need to build a foundation in key areas like statistics, programming, and data visualization. Here’s what to focus on:
Statistics and Probability Basics
Understanding the fundamentals of statistics is crucial for interpreting data and making sound decisions. Topics like distributions, correlation, regression, and hypothesis testing are essential.
Python or R Programming
Learning a programming language like Python or R will empower you to manipulate data, run analyses, and build predictive models. Python is generally recommended for beginners due to its simplicity and widespread use.
Data Manipulation and Visualization Tools
Tools like Pandas (Python library), SQL (for querying databases), and Tableau or Power BI (for data visualization) are industry standards. These tools help you clean, explore, and present data in a meaningful way.
Take Advantage of Online Courses and Resources
Numerous free and paid resources are available specifically for beginners from non-tech fields. Here are a few reputable platforms to consider:
Coursera – Great for structured courses from top universities.
edX – Offers both free and certificate programs.
DataCamp – Interactive coding tutorials tailored to data science.
Kaggle Learn – Free micro-courses and datasets for hands-on practice.
Start small. Begin with introductory courses and gradually move to more complex topics.
5. Build Real Projects to Apply What You Learn
Hands-on projects are the fastest way to cement your learning and showcase your abilities to future employers. Try these ideas:
Analyze a dataset from Kaggle or a public data repository.
Build a dashboard showing business metrics.
Predict outcomes (e.g., sales, customer churn) using regression models.
Choose projects related to your background to highlight your domain knowledge and show how it translates into data insights.
Network and Connect With the Data Science Community
Engaging with the data science community through meetups, forums, and social media can accelerate your growth and open doors. Join:
LinkedIn groups related to data science
Reddit communities like r/datascience
Local data science meetups or online events
Hackathons and datathons to practice collaboratively
Connecting with others can lead to mentorship, feedback, and job opportunities.
8. Prepare for the Job Market
With your skills and portfolio in place, it's time to start tailoring your resume, practicing interviews, and applying for roles. Focus on:
Entry-level positions like data analyst, junior data scientist, or business intelligence analyst
Keywords in job descriptions (use them in your resume)
Storytelling during interviews—explain your career change, projects, and learning journey confidently
Practice with mock interviews and behavioral questions to build your comfort level.
9. Consider Further Education or Certifications
While not always required, a structured program or certification can provide credibility and fill in knowledge gaps. Look into:
Google Data Analytics Certificate (Coursera)
IBM Data Science Professional Certificate (Coursera)
Harvard’s Data Science MicroMasters (edX)
Certifications can help bridge the gap, especially if you lack a technical degree.
10. Stay Consistent and Keep Learning
The field of data science evolves rapidly, so continuous learning and curiosity are key to long-term success. Subscribe to newsletters, follow industry blogs, and experiment with new tools and techniques.
Treat learning like a habit, not a phase.
Final Thoughts
Breaking into data science from a non-tech background is challenging, but with perseverance, strategic learning, and confidence, it's a realistic and rewarding career move. Leverage your unique strengths, stay consistent, and remember—everyone starts somewhere.
Your past doesn’t define your potential in data science. You do.
#CareerSwitch#DataScienceJourney#NonTechToTech#CareerChange#DataScienceForBeginners#Upskill#LearnDataScience#Reskill#BreakingIntoTech#TransitionToDataScience#DataScienceGuide#TechCareerChange#DataScienceLearningPath#DataScienceTips#SwitchToTech
0 notes
Text
Transform Your Skills in 2025: Master Data Visualization with Tableau & Python (2 Courses in 1!)

When it comes to storytelling with data in 2025, two names continue to dominate the landscape: Tableau and Python. If you’re looking to build powerful dashboards, tell data-driven stories, and break into one of the most in-demand fields today, this is your chance.
But instead of bouncing between platforms and tutorials, what if you could master both tools in a single, streamlined journey?
That’s exactly what the 2025 Data Visualization in Tableau & Python (2 Courses in 1!) offers—an all-in-one course designed to take you from data novice to confident visual storyteller.
Let’s dive into why this course is creating buzz, how it’s structured, and why learning Tableau and Python together is a smart move in today’s data-first world.
Why Data Visualization Is a Must-Have Skill in 2025
We’re drowning in data—from social media metrics and customer feedback to financial reports and operational stats. But raw data means nothing unless you can make sense of it.
That’s where data visualization steps in. It’s not just about charts and graphs—it’s about revealing patterns, trends, and outliers that inform smarter decisions.
Whether you're working in marketing, finance, logistics, healthcare, or even education, communicating data clearly is no longer optional. It’s expected.
And if you can master both Tableau—a drag-and-drop analytics platform—and Python—a powerhouse for automation and advanced analysis—you’re giving yourself a massive career edge.
Meet the 2-in-1 Power Course: Tableau + Python
The 2025 Data Visualization in Tableau & Python (2 Courses in 1!) is exactly what it sounds like: a double-feature course that delivers hands-on training in two of the most important tools in data science today.
Instead of paying for two separate learning paths (which could cost you more time and money), you’ll:
Learn Tableau from scratch and create interactive dashboards
Dive into Python programming for data visualization
Understand how to tell compelling data stories using both tools
Build real-world projects that you can show off to employers or clients
All in one single course.
Who Should Take This Course?
This course is ideal for:
Beginners who want a solid foundation in both Tableau and Python
Data enthusiasts who want to transition into analytics roles
Marketing and business professionals who need to understand KPIs visually
Freelancers and consultants looking to offer data services
Students and job seekers trying to build a strong data portfolio
No prior coding or Tableau experience? No problem. Everything is taught step-by-step with real-world examples.
What You'll Learn: Inside the Course
Let’s break down what you’ll actually get inside this 2-in-1 course:
✅ Tableau Module Highlights:
Tableau installation and dashboard interface
Connecting to various data sources (Excel, CSV, SQL)
Creating bar charts, pie charts, line charts, maps, and more
Advanced dashboard design techniques
Parameters, filters, calculations, and forecasting
Publishing and sharing interactive dashboards
By the end of this section, you’ll be comfortable using Tableau to tell stories that executives understand and act on.
✅ Python Visualization Module Highlights:
Python basics: data types, loops, functions
Data analysis with Pandas and NumPy
Visualization libraries like Matplotlib and Seaborn
Building statistical plots, heatmaps, scatterplots, and histograms
Customizing charts with color, labels, legends, and annotations
Automating visual reports
Even if you’ve never coded before, you’ll walk away confident enough to build beautiful, programmatically-generated visualizations with Python.
The Real-World Value: Why This Course Stands Out
We all know there’s no shortage of online courses today. But what makes this one worth your time?
🌟 1. Two for the Price of One
Most courses focus on either Tableau or Python. This one merges the best of both worlds, giving you more for your time and money.
🌟 2. Hands-On Learning
You won’t just be watching slides or lectures—you’ll be working with real data sets, solving real problems, and building real projects.
🌟 3. Resume-Boosting Portfolio
From the Tableau dashboards to the Python charts, everything you build can be used to show potential employers what you’re capable of.
🌟 4. Taught by Experts
This course is created by instructors who understand both tools deeply and can explain things clearly—no confusing jargon, no filler.
🌟 5. Constantly Updated
As Tableau and Python evolve, so does this course. That means you’re always learning the latest and greatest features, not outdated content.
Why Learn Both Tableau and Python?
Some people ask, “Isn’t one enough?”
Here’s the thing: they serve different purposes, but together, they’re unstoppable.
Tableau is for quick, intuitive dashboarding.
Drag-and-drop interface
Ideal for business users
Great for presentations and client reporting
Python is for flexibility and scale.
You can clean, manipulate, and transform data
Build custom visuals not possible in Tableau
Automate workflows and scale up for big data
By learning both, you cover all your bases. You’re not limited to just visuals—you become a full-spectrum data storyteller.
Data Careers in 2025: What This Course Prepares You For
The demand for data professionals continues to skyrocket. Here’s how this course sets you up for success in various career paths: RoleHow This Course HelpsData AnalystBuild dashboards, analyze trends, present insightsBusiness Intelligence AnalystCombine data from multiple sources, visualize it for execsData Scientist (Junior)Analyze data with Python, visualize with TableauMarketing AnalystUse Tableau for campaign reporting, Python for A/B analysisFreelancer/ConsultantOffer complete data storytelling services to clients
This course can be a launchpad—whether you want to get hired, switch careers, or start your own analytics agency.
Real Projects = Real Confidence
What sets this course apart is the project-based learning approach. You'll create:
Sales dashboards
Market trend analysis charts
Customer segmentation visuals
Time-series forecasts
Custom visual stories using Python
Each project is more than just a tutorial—it mimics real-world scenarios you’ll face on the job.
Flexible, Affordable, and Beginner-Friendly
Best part? You can learn at your own pace. No deadlines, no pressure.
You don’t need to buy expensive software. Tableau Public is free, and Python tools like Jupyter, Pandas, and Matplotlib are open-source.
Plus, with lifetime access, you can revisit any lesson whenever you want—even years down the road.
And all of this is available at a price that’s far less than a bootcamp or university course.
Still Not Sure? Here's What Past Learners Say
“I had zero experience with Tableau or Python. After this course, I built my own dashboard and presented it to my team. They were blown away!” – Rajiv, Product Analyst
“Perfect combo of theory and practice. Python sections were especially helpful for automating reports I used to make manually.” – Sarah, Marketing Manager
“Loved how everything was explained so simply. Highly recommend to anyone trying to upskill in data.” – Alex, Freelancer
Final Thoughts: Your Data Career Starts Now
You don’t need to be a programmer or a math wizard to master data visualization. You just need the right guidance, a solid roadmap, and the willingness to practice.
With the 2025 Data Visualization in Tableau & Python (2 Courses in 1!), you’re getting all of that—and more.
This is your chance to stand out in a crowded job market, speak the language of data confidently, and unlock doors in tech, business, healthcare, finance, and beyond.
Don’t let the data wave pass you by—ride it with the skills that matter in 2025 and beyond.
0 notes
Text
Top AI Tools for Businesses in 2025
As we enter 2025, Artificial Intelligence (AI) continues to redefine how businesses operate. From automating customer service to driving data-based decisions and improving cybersecurity, AI tools are empowering companies to scale faster, cut costs, and stay ahead of competitors. Businesses, whether small startups or large enterprises, are realizing the importance of integrating AI into daily operations for maximum efficiency.
To keep up with this fast-paced evolution, professionals and business owners are increasingly looking to upgrade their skills through programs offering AI certification in Dehradun, as the demand for AI-savvy talent rises across all sectors.
The Role of AI Tools in Modern Businesses
AI tools are no longer optional—they are a necessity. From intelligent chatbots to advanced analytics platforms, these tools allow businesses to perform tasks with improved speed and accuracy. Some of the most impactful uses include:
Customer Service Automation: AI chatbots and virtual assistants are now handling 24/7 customer support, leading to better customer satisfaction and reduced manpower costs.
Predictive Analytics: Tools that analyze consumer behavior, market trends, and financial performance are enabling better strategic planning.
Marketing Optimization: AI-driven marketing platforms help businesses personalize campaigns and improve ROI through data-driven insights.
Recruitment and HR: AI is streamlining hiring processes by screening resumes and scheduling interviews automatically.
With these advancements, it has become essential for professionals to undergo AI certification in Dehradun to keep up with industry demands and remain competitive.
Leading AI Tools Businesses Should Know in 2025
ChatGPT and Other LLMs: Tools like ChatGPT have transformed content creation, customer interaction, and internal knowledge systems by leveraging natural language processing capabilities.
Google Vertex AI: A robust machine learning platform that enables data scientists and developers to build, deploy, and manage ML models seamlessly.
Tableau with AI Integration: Tableau’s use of AI features like "Explain Data" helps organizations identify insights quickly from complex datasets.
Jasper AI: Widely used in marketing, Jasper helps generate persuasive copy, blog posts, and ad content in seconds.
Hugging Face: An open-source AI platform, especially popular for NLP and model deployment in enterprises.
IBM Watson: Trusted for enterprise-scale solutions, Watson provides AI-powered data analytics, customer engagement, and automation tools.
With such tools in high demand, individuals who complete AI certification in Dehradun are better prepared to implement these solutions across various departments and industries.
Application of Autoencoder | Data Compression | Deep Learning Tutorial | AI Tutorial
youtube
Dehradun’s Growing AI Learning Ecosystem
Dehradun is steadily emerging as a learning destination for future-ready technologies, including AI. The city’s academic culture, tech awareness, and rising number of businesses adopting digital tools have led to an increased interest in professional training programs.
From students to working professionals, learners are enrolling in practical training programs that provide globally recognized AI certification in Dehradun. These programs typically focus on machine learning, data science, deep learning, and AI tool applications in real-world business scenarios.
General AI Course Fees and Program Trends
AI education in Dehradun is offered through various levels, from short-term certifications to more advanced engineering and research programs. These courses are structured to cover practical applications, industry-based projects, and tool-based training.
The general fee for AI certification courses in Dehradun ranges between ₹45,000 and ₹1,10,000, depending on the program length, depth, and mentorship provided. Many of these programs are designed with flexibility in mind, allowing working professionals to learn without compromising their jobs.
Markets and Markets also predicts a substantial leap in AI investments globally, with the total market projected to rise from USD 214.6 billion in 2024 to USD 1,339.1 billion by 2030, reflecting a robust CAGR of 35.7%. This clearly points to AI’s increasing role as a foundational technology across sectors such as healthcare, finance, logistics, education, and more.
In the rapidly growing AI training ecosystem, DataMites stands out as a trusted and comprehensive training provider. Known for delivering high-quality, hands-on programs, DataMites offers practical and industry-aligned learning experiences that cater to beginners and professionals alike.
Their acclaimed AI Engineer Program provides end-to-end training in AI concepts, machine learning, Python, NLP, computer vision, and deployment strategies. The program is IABAC-accredited (International Association of Business Analytics Certifications) and aligned with NASSCOM FutureSkills Prime, ensuring that learners receive a globally recognized certification that enhances their career opportunities.
One of the key reasons learners are choosing DataMites is the value-added offerings such as real-world internship opportunities, project-based learning, and placement assistance. The course structure not only builds technical competence but also prepares students for interviews and job roles across industries.
As AI continues to transform how businesses function, having the right skills and certifications is crucial. DataMites is helping Dehradun’s aspiring AI professionals build meaningful careers by offering quality training and industry support.
#artificial intelligence course#artificial intelligence training#artificial intelligence certification#Youtube
0 notes
Text

How to Start a Career in Data Analytics Without a Tech Background.
Let’s be honest—"data analytics" sounds like something only coders and spreadsheet wizards can do, right?
But here’s the truth: you don’t need to be a tech genius to start a career in data analytics. In fact, some of the best data analysts come from fields like marketing, finance, education, or even hospitality. What they all have in common? A curiosity to understand data and a willingness to learn.
This essay is for you if you've ever wondered, "I like solving problems, but I don't know where to start."
🧠 What Is Data Analytics, Really?
Think of data analytics as detective work with numbers. Businesses generate tons of data—sales numbers, website clicks, customer feedback—and they need someone to find the patterns, answer questions, and help them make better decisions.
A data analyst’s job is to: Collect and clean data Analyze trends Create reports and dashboards Help teams make smarter choices No complex coding needed to start—just clear thinking, basic tools, and some practice.
🌱 Step-by-Step Guide to Get Started Without a Tech Background
Start with the Mindset, Not the Tools First, believe this: you belong in data. Don’t let jargon intimidate you. You don’t need a computer science degree. What you do need is:
Curiosity Problem-solving skill A love for learning That’s your foundation.
Learn the Basics (One Step at a Time) Start small. You don’t need to jump into Python or SQL on Day 1.
Begin with:
Excel/Google Sheets – Learn formulas, pivot tables, basic charts.
Data literacy – Understand terms like KPI, metric, dashboard, etc.
Free courses – Try YouTube tutorials or beginner courses on platforms like Coursera, Udemy, or LinkedIn Learning.
📌 Tip: Try analyzing your own budget or workout data to practice.
Master Key Tools Slowly Once you’re comfortable, move on to the key tools data analysts use:
Tool Why Learn It? Excel Industry standard for data cleaning SQL Helps you pull data from databases Power BI / Tableau Used for creating visual reports and dashboards Python (optional) Helpful, but not required initially
Don’t try to learn everything at once—pick one and stick with it until you're comfortable.
Work on Real-Life Projects You don’t need a job to get experience. Use free datasets from sites like:
Kaggle.com Data.gov OurWorldinData.org
Start a project like: Analyzing COVID data in your region Creating a dashboard of your expenses Studying trends in Netflix shows or YouTube videos
Then write about your process on LinkedIn or Medium. It shows initiative and builds your portfolio.
Get Certified (Optional but Helpful) Certifications can give you a confidence boost and look great on a resume. Look into:
Google Data Analytics Certificate Microsoft Power BI Certification Coursera / Udemy beginner courses
They’re not required, but they help you stand out.
Apply for Entry-Level Roles (Even if You Don’t Tick Every Box) You don’t need to meet 100% of the job description to apply.
Look for roles like:
Junior Data Analyst Business Analyst Reporting Analyst Operations Analyst
Highlight your soft skills: communication, problem-solving, and attention to detail. Show how you’re learning the tools. That matters more than a perfect résumé.
💬 Real Talk: What Makes a Good Data Analyst (That Has Nothing to Do With Tech)? You ask “why” a lot
You enjoy making sense of chaos You’re patient with details You like telling stories with numbers Sound like you? Then you're already halfway there.
🎯 Final Words Starting a data analytics career without a tech background isn't just possible—it’s happening every day. With the right mindset, consistent effort, and a little curiosity, you can absolutely break in.
And remember: everyone was a beginner once.
If you’re ready to take the first step, our Data Analytics program at Ntech Global Solutions is built for career changers just like you. We teach you real-world skills, not just theory—so you can go from “I don’t know where to start” to “I got the job!”
#data analytics#data analyst course in delhi#data analyst training#code#python#programming#sql#excel#power bi#tableau
1 note
·
View note
Text
How to Start a Career in Data Science with No Technical Background
If you’ve ever thought, “Data science sounds fascinating, but I don’t have a tech background,” you’re not alone — and you’re definitely not out of luck.
Here’s the truth: you don’t need to be a coder, a statistician, or a data engineer to start a career in data science. What you need is curiosity, consistency, and the right approach.
This blog will walk you through exactly how someone from a non-technical field — like marketing, finance, operations, education, or even arts — can break into the world of data science.
Step 1: Understand What Data Science Actually Is
Start by learning the basics of data science — what it means, how it's used, and the kind of problems it solves.
Think of data science as a combination of three core elements:
Math and Statistics – to make sense of data
Programming – to work with and process that data
Business Understanding – to know which problems are worth solving
The best part? You can learn all of this at your own pace, even if you’re starting from zero.
Step 2: Start with Tools You’re Familiar With
If you’ve used Excel or Google Sheets, you’ve already worked with data.
From there, you can gradually move to tools like:
SQL – to pull data from databases
Python – to manipulate, analyze, and visualize data
Power BI or Tableau – to create dashboards and visual stories
There are beginner-friendly platforms and tutorials available to help you learn these tools step-by-step.
Step 3: Focus on Real-World Applications
Don’t try to memorize formulas or force yourself to master every algorithm. Instead, focus on how data science is used in the real world:
In marketing to measure campaign performance
In HR to predict employee attrition
In finance to detect fraud
In supply chain to optimize delivery routes
Relating concepts to your current domain makes learning not only easier but more enjoyable.
Step 4: Work on Projects, Not Just Theory
Even if you’re still learning, try to work on mini-projects using publicly available datasets from Kaggle or government portals.
For example:
Analyze sales data and build a forecast model
Explore customer churn patterns for a telecom company
Create a dashboard showing COVID-19 trends
These projects will become part of your portfolio, making you stand out when applying for jobs.
Step 5: Keep Learning, Keep Growing
The field of data science evolves fast. Stay updated by:
Following data science communities on LinkedIn
Watching free courses and tutorials
Reading blogs and case studies
Connecting with mentors or peers online
Ready to Get Started?
If you're serious about breaking into data science, there's no better time than now — and no better way than starting with a free beginner-friendly course.
🎥 Check out this free YouTube course on Data Science that explains core concepts, tools, and techniques — all in simple, easy-to-follow language:
👉 Click here to watch the full course
You don’t need a tech degree — just a desire to learn and take the first step. Your data science journey starts today!
0 notes
Text
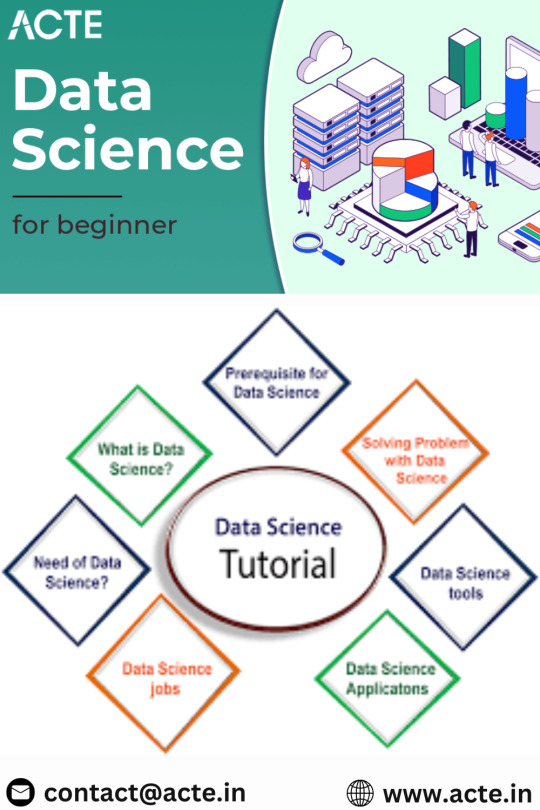
Data Science for Beginners: Essential Tutorials to Build Your Skills
Data Science is one of the most exciting fields in today’s digital world. If you're new to this, don't worry! This Data Science tutorial for beginners will help you understand the basics and guide you on how to start your journey.
Data Science combines statistics, programming, and domain knowledge to analyze data and solve real-world problems. It involves several steps: collecting data, cleaning it, analyzing patterns, and presenting insights. These insights help companies make better decisions, predict trends, and improve processes.
Why Learn Data Science?
Data is everywhere! From social media to healthcare, businesses rely on data to grow. Learning data science can open doors to high-paying jobs and exciting projects. It’s a skill in demand, making it a great field to explore.
How to Get Started?
Learn the Basics: Start with Python or R programming. These are beginner-friendly and widely used in data science.
Understand Statistics: Knowledge of mean, median, standard deviation, and probability is crucial.
Explore Data Visualization: Tools like Tableau or libraries like Matplotlib in Python help present data clearly.
Work on Projects: Practice is key! Try simple projects like analyzing weather patterns or predicting sales trends.
As a beginner, focus on building a strong foundation. There are plenty of free resources and tutorials to help you grow step-by-step.
For a more detailed guide, check out Data Science Tutorial. Happy learning!
0 notes
Text
Careers in Data Science | Getting Started and How to Succeed
Unlocking a Career in Data Science: A Path to Success
Defined as the confluence of analytics and creativity, problem-solving and information structures, and understanding the technical content, data science is established in the fast-growing industry that continues to grow at an accelerating pace. For anyone entering this field or considering it for a career change, insight into ways of starting and thriving in this dynamic, growing field is a must.

Data Science
Key Qualities for a Data Science Career
It would be inclusive of both technical and interpersonal skills that will consider one successful in the field of data science.
If you want to pursue a career as a data science professional, you must have the following technical skills: good command over programming languages like Python or R; SQL, which assists in manipulating and analysing the data and a lot more, thereby helping you build your model. Fundamentally, the ground of data analysis is based on the understanding of concepts such as statistics, distribution, probability, and hypothesis testing. Advanced libraries and tools-e.g., Pandas or NumPy for Python-are needed to prepare the data into manipulable format and to explore its analytics. Similarly, machine learning frameworks require a good understanding and familiarity with Scikit-learn and TensorFlow to build predictive models. Further, knowledge of visualisation tools-like Matplotlib, Seaborn, and Tableau-should be helpful in effectively communicating the findings with the stakeholders. Soft skills, like problem-solving communication and domain expertise, are needed to understand the data and make practical suggestions. Education and Learning: A bachelor and master’s degree in statistics, computer science, or other very related fields will serve as a good foundation. Specialisation, developed on popular online platforms like Coursera or edX and universities, will add more value to your credentials.
Self-Learning: Attend web-based classes and tutorials, literature — opportunities for learning. Courses from Udemy or DataCamp improve your practical skills.
Bootc offered by the General Assembly quick route to entering the Achieving Practical Experience
Practical experience works as the most important aspect for a data scientist. Here are the ways to achieve experience:
If time and opportunity allow, create personal projects or participate in Kaggle competitions to challenge yourself and build up a portfolio of projects. Consider accepting assignments or internships in order to get an overview and, over time, guarantee full-time job offers in data science. Join various groups involved in data science, attend events, participate in galloping horse sessions, and this way develop your social network, which is likely to yield job opportunities and mentorship options for further growth. Accordingly, when you enter such a field, you may start with positions such as a data analyst or junior scientist and progress at the right time to more specialised positions of Data Scientists, Data Engineers, and also Machine Learning Engineers.
Begin Your Career the Right Way in Data Science
Look for jobs that will offer you easy positions so that you learn technically and build on your skills. Be on the lookout for those positions where you are being given direction and exposed to many projects hence enjoying broad experience. Anything new in the field such as Artificial Intelligence, Data Analytics, and data architecture, specialise in it as you go along. Topmost jobs usually involve leading strategic initiatives, really running teams in data science, or establishing enterprise-wide data-related initiatives. Stay successful by continually learning and applying what you learn to real-world problems, and always staying curious and innovative so you stand out in the field.
1 note
·
View note
Text
Tools and Techniques You Will Learn in a BBA in Business Analytics
A BBA in Business Analytics is an interesting course that equips you with the latest skills. This course is a perfect balance of technology and business concepts. More precisely, it uses technology for business applications. Therefore, you will learn a plethora of digital tools and software in this course. These tools will help you conduct your daily activities as a business analyst.
Excel for Business Analytics
Perhaps a more traditional tool, Excel has a vast number of applications. It has many formulas and processes allow you to analyse large amounts of data. Moreover, Excel also has features that display data in tables and charts. You can also use advanced Excel functions like VBA to visualise and analyse data.
Python for Data Science
Python is a programming language that allows you to build machine-learning algorithms. You will build an ecosystem of data analysis and exploration using Python. It is also used for data cleaning and preprocessing. Hence, brushing up on your coding skills before starting the degree will be helpful.
SQL for Data Management
SQL is another popular data management tool. SQL has tables that allow you to manipulate data and aggregate it. You can merge two different tables to combine two datasets and mine new insights. SQL also extracts the relevant data from a large database.
Tableau for Data Visualization
Now comes the fun part. Tableau is an interesting tool for visualising data. It has more features than Excel, and you can create interactive dashboards and other visualisations. You can also connect to different data sources and create dashboards with artificial intelligence.
Combining Tools for Comprehensive Analysis
Integrating all these tools will allow you to analyse data comprehensively. You will create more efficient workflows and mine better insights from this combination. The faculty at your institution will teach you how to combine these techniques to get the best results proactively.
Tips for Learning and Mastering These Tools
Practice each tool every day on a new dataset.
Use online resources and tutorials to learn advanced techniques.
Build a strong foundation of theoretical knowledge about data analytics.
Get paid versions of these tools to enhance your knowledge.
The best BBA college in Noida will provide a strong foundation in essential tools and techniques. You will develop valuable skills and open up exciting career opportunities in business analytics.
0 notes
Text
What are some typical data scientist interview questions?
Data scientist interview questions typically cover a range of topics, including technical skills, problem-solving abilities, and domain knowledge. Here are some categories and examples of questions you might encounter in a data scientist interview:
Technical Questions
Programming
How do you handle missing data in a dataset using Python?
Write a function to calculate the mean of a list of numbers.
Statistics and Probability
Explain the difference between Type I and Type II errors.
How do you interpret a p-value?
Machine Learning
Explain the bias-variance tradeoff.
What is overfitting and how can you prevent it?
Describe how a random forest algorithm works.
Data Manipulation
How do you merge two datasets in Pandas?
Explain the difference between a left join and an inner join.
Data Visualization
How would you visualize the distribution of a single continuous variable?
What types of plots would you use to show the relationship between two categorical variables?
Problem-Solving and Case Studies
Scenario-Based Questions
You are given a dataset with user behavior on an e-commerce website. How would you approach predicting user churn?
How would you design an A/B test to determine the effect of a new feature on user engagement?
Real-World Problems
How would you handle an imbalanced dataset?
Explain a machine learning project you have worked on from start to finish.
Behavioral Questions
Experience and Projects
Can you describe a challenging data science project you've worked on? How did you overcome the challenges?
Tell me about a time when you had to explain a complex data analysis to a non-technical audience.
Teamwork and Collaboration
How do you handle disagreements with team members regarding the approach to a data science problem?
Describe your experience working in a cross-functional team.
Domain-Specific Questions
Industry Knowledge
How would you approach building a recommendation system for a streaming service?
What metrics would you consider important for measuring the success of a marketing campaign?
Specific Tools and Techniques
How have you used SQL in your previous projects?
Describe your experience with cloud platforms like AWS or Azure for data science.
Analytical Thinking
Logic and Reasoning
How would you estimate the number of taxis needed in New York City at any given time?
If you have a biased coin, how would you use it to generate a fair result?
Example Questions and Answers
Technical:
Question: What is the difference between supervised and unsupervised learning?
Answer: Supervised learning involves training a model on labeled data, meaning each training example has an associated output label. Examples include regression and classification. Unsupervised learning involves training a model on unlabeled data, where the goal is to find hidden patterns or intrinsic structures in the input data. Examples include clustering and dimensionality reduction.
Scenario-Based:
Question: How would you detect anomalies in a dataset?
Answer: I would start by understanding the domain and the data to define what constitutes an anomaly. Then, I would use statistical methods like z-scores or interquartile range to identify outliers. For more complex cases, I might use machine learning techniques such as isolation forests, one-class SVM, or autoencoders to detect anomalies.
Behavioral:
Question: Can you describe a time when you had to learn a new tool or technology quickly?
Answer: In my previous role, I needed to learn Tableau for data visualization. I dedicated a week to intensive learning, using online tutorials and practice datasets. I then applied my new skills to create a comprehensive dashboard for a project, which was well-received by stakeholders.
Preparing for these types of questions can help you showcase your skills, experience, and problem-solving abilities effectively in a data scientist interview.
0 notes
Text
Your Step-by-Step Guide to Launching a Career as a Data Analyst
If you've ever considered becoming a data analyst, you're not alone. The demand for data-driven decision-making has made this career path both rewarding and exciting. But how do you get started? What skills are crucial? This blog will guide you through the process, drawing insights from the Data Analytics Course in Chennai.

1. Understand the Role of a Data Analyst
A data analyst is responsible for gathering, processing, and interpreting data to help businesses make informed decisions. They work with numbers, charts, and reports to uncover patterns and insights that can shape better strategies.
2. Master the Basics of Data Analysis
Begin by learning the core concepts of data analysis. This involves understanding how to work with different types of data (such as numerical and categorical) and learning how to draw meaningful conclusions from it. You can find beginner-friendly courses on platforms like Coursera, edX, or YouTube.
3. Get Proficient with Spreadsheets
Spreadsheets, like Microsoft Excel or Google Sheets, are essential tools for any data analyst. They allow you to efficiently organize, sort, and analyze data. Start by learning basic functions like SUM, AVERAGE, and VLOOKUP, then advance to more complex features like pivot tables and data visualization.
4. Learn a Programming Language
Familiarity with a programming language like Python or R can significantly streamline your data analysis work. These languages allow you to automate repetitive tasks, clean data, and perform complex analyses. Websites like Codecademy and DataCamp offer interactive courses that are perfect for beginners.
If you want to learn more about Data Analytics, consider enrolling in an Data Analytics Online Course. They often offer certifications, mentorship, and job placement opportunities to support your learning journey.
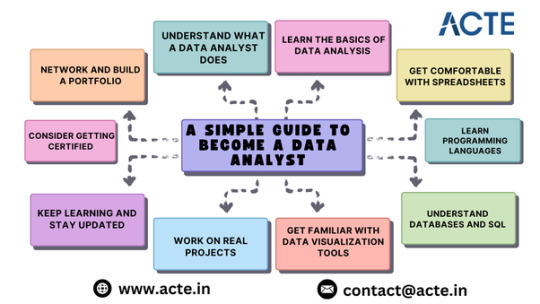
5. Understand Databases and SQL
SQL (Structured Query Language) is a crucial skill for any data analyst. It enables you to retrieve and manipulate data stored in databases, allowing you to access the exact information needed for analysis. Start with free tutorials on websites like W3Schools or Khan Academy.
6. Explore Data Visualization Tools
Data visualization is about presenting your findings in a way that’s easy to understand. Tools like Tableau, Power BI, and Google Data Studio are excellent for creating charts, graphs, and dashboards. Many of these tools offer free versions or trials to help you get started.
7. Gain Practical Experience with Real Projects
While theory is important, hands-on experience is essential. Work on real-world projects by analyzing online data sets or assisting a friend’s small business. Websites like Kaggle provide free data sets and challenges that help you practice and sharpen your skills.
8. Stay Informed and Keep Learning
The field of data analysis is always evolving. Stay up to date with the latest trends and tools by reading blogs, joining online communities, and attending webinars. Websites like Towards Data Science, Analytics Vidhya, and Medium offer valuable articles and tutorials to keep you informed.
9. Consider Earning Certifications
Though not always required, certifications can enhance your credibility. Consider certifications like Google’s Data Analytics Professional Certificate or Microsoft Certified: Data Analyst Associate to help you stand out in the job market.
10. Build a Network and Portfolio
Networking with other professionals can lead to new job opportunities. Attend meetups, join LinkedIn groups, and connect with fellow data analysts. Additionally, create a portfolio showcasing your work to demonstrate your skills to potential employers.
Conclusion
Becoming a data analyst takes time, dedication, and continuous learning, but it’s a rewarding journey. Start with the basics, practice regularly, and stay current with new developments. With perseverance, you’ll be well on your way to a successful career in data analysis.
1 note
·
View note