#volumeanalysis
Explore tagged Tumblr posts
Visit Tumblr Blog
Explore Tumblr blogs with no restrictions, modern design and the best experience.
Last Seen Tumblr Blogs


Fun Fact
Tumblr has 16.74 million mobile monthly users in the US.
Text
Cybercrime Alert: No Signal? Be careful—it could be a SIM swap scam!
One second you're chilling at home… the next second, your phone loses network — and before you realize, scammers are draining your bank account😨 SIM Swapping Scam is real, and it's targeting people like you. Retired bank officer in Kolkata lost ₹20 lakh — don't be next! 🛑 In this video, we’ll explain: How SIM Swapping works (in Tamil) Real-life scam case from India Simple steps to protect your SIM & bank account How to use SIM PIN, App-based authenticators, and check SIM change requests Emergency actions if you suspect fraud (Call 1930 or visit cybercrime.gov.in) tips inside! Open free Demat Account - https://open.navia.co.in/index-navia.php?datasource=DMO-YT
#SimSwapScam#CyberCrimeAwareness#TamilFinance#DigitalSafety#BankFraud#SEBI#AlgoTrading#StockMarketTamil#VolumeAnalysis#InvestmentTips#CyberSecurity#SimCardSafety#1930#NaviaMarkets#ReversalPatterns#MoneySafety#CyberCrimeAlert#BankFraudAwareness#DigitalSecurity#ProtectYourMoney#OnlineFraudPrevention#OTPScam#FinancialLiteracy#CyberSecurityTips#ScamAlertIndia#SecureBanking#MobileFraud#StaySafeOnline#simscam#phonesim
0 notes
Text
Volume Analysis: Reading Volume to Confirm Trends
In the dynamic world of cryptocurrency trading, technical indicators are essential tools that help traders make informed decisions. Among these, volume analysis stands out as one of the most powerful yet underutilized methods for confirming price trends. Whether you’re a novice investor or a seasoned trader, understanding how to read volume can give you a decisive edge in predicting market moves…
0 notes
Text
The Importance of Volume in Technical Analysis: Read the Crowd Before the Candle
Let’s say it straight — if you’re ignoring volume in your technical analysis, you’re missing the heartbeat of the market. Price tells you where the market is going, but volume tells you why it’s going there, and if it’ll stay. It’s the difference between following the chart and understanding what’s actually happening behind it. Volume analysis is crucial in deciphering market sentiment and gauging the intensity of price movements; thus, understanding price and high volume data is essential to combine volume analysis effectively. , making it a vital component of any trading strategy.
A lot of traders get caught up in candlestick patterns, indicators, and trendlines — all valid trading tools. But none of them mean much if trading volume doesn’t back the move, underscoring the importance of trading volume analysis. Because in this game, price without volume is just noise. And once you understand volume in technical analysis, you start reading the market like a seasoned insider, not a hopeful guesser. Volume data provides insights into the buying pressure and selling pressure, helping traders to identify potential trend reversals and confirm the strength of market movements.
Understanding the intricacies of volume indicators such as On-Balance Volume (OBV), Chaikin Money Flow (CMF), and the Volume Weighted Average Price (VWAP) can enhance your ability to make informed trading decisions. These indicators help in assessing whether the market is experiencing strong buying pressure or if selling volume is dominating. By combining volume profile along with volume analysis and other indicators, traders can develop robust trading strategies that align with market trends and support and resistance levels.
Incorporating volume trading strategy into your approach means looking beyond the surface of price action to the underlying market activity. High trading volume suggests strong market participation, while low trading volume may indicate a lack of interest or liquidity; thus, high volume suggests that traders should be cautious. Recognizing volume patterns and volume spikes can be the key to unlocking significant price moves and understanding market direction. This deeper comprehension of volume and price dynamics allows traders to interpret volume effectively and react to market trends with precision.
In conclusion, volume and price data are intertwined, and mastering their relationship is essential for successful trading. By prioritizing current trading volume in your technical analysis, you gain a clearer picture of market strength, especially during periods of high volume and potential price breakouts, ultimately leading to more informed and profitable trading decisions.
What Is Volume in Trading?
Let’s start with the basics to learn volume trading. Volume is simply the number of shares, contracts, or units traded during a specific time frame. On most charts, it’s shown as vertical bars at the bottom — bigger bars mean more trades happened, smaller bars mean the market was quieter.
In volume analysis in trading, we don’t just care about the number — we care about how volume interacts with price. Are buyers stepping in on a breakout? Are sellers dumping into strength or showing volume divergence? Is the move real — or just a low-volume fakeout?
Learning how to read volume gives you insight into market conviction. When you see an increasing volume surge during a breakout or collapse, that’s participation. That’s real interest. When volume stays flat while price is grinding higher, that’s caution — and it could mean a reversal is coming.
Volume is more than just a metric; it's a window into the market's psyche. It helps traders distinguish between genuine price movements and those that lack conviction. For instance, a high trading volume during a price breakout suggests strong market sentiment and increased participation from market participants. This indicates a potential continuation of the price trend, providing traders with confidence in their trading decisions.
Conversely, a low trading volume during price rises or falls may signal a lack of low volume interest or liquidity, particularly during falling prices, raising red flags about the sustainability of the move. Traders can use volume data to identify support and resistance levels, as significant volume at these points often confirms their validity. Moreover, understanding volume trends over a specific period can alert traders to potential trend reversals or the emergence of new market trends, which also relates to market liquidity.
By integrating key volume indicators such as On-Balance Volume (OBV), Chaikin Money Flow (CMF), accumulation distribution, or the Money Flow Index (MFI) into their analysis, traders can gain a deeper understanding of market sentiment and the balance between buying and selling pressure. This comprehensive approach to volume analysis, including moving average convergence divergence, allows traders to make more informed trading decisions, aligning their strategies with the underlying market dynamics and enhancing their ability to react to significant price moves.
Ultimately, mastering volume analysis is essential for any trader looking to navigate the complexities of the market effectively. By prioritizing total trading volume in their technical analysis, traders can gain a clearer picture of market strength, potential price breakouts, and trend reversals, ultimately leading to more informed and profitable trading decisions.
Why Volume Matters in Technical Analysis?
Here’s the truth — volume is confirmation. It tells you whether the price move you're watching is legit or flimsy. You might see a clean breakout from a trendline — great. But if volume doesn’t increase on the breakout? That’s a red flag. No conviction, no strength, no follow-through. A high volume breakout, on the other hand, is what you want, as understanding how volume trading works shows the move has weight behind it. That’s when I pay attention.
Volume and price action go hand in hand. When volume increases during an uptrend, it suggests rising prices and that buyers are still aggressive. When it dries up, momentum is likely slowing. During pullbacks, rising volume on the downside can signal that sellers are taking control or that weak hands are getting shaken out.
In simple terms, volume confirms direction, strength, and sustainability, especially when it indicates falling prices.
Volume-Based Trading Strategy in Action
Building a volume-based trading strategy starts with the fundamental idea that price moves backed by significant volume trading are far more reliable than those without. This principle of volume trading can be a game-changer in your trading journey, offering a deeper understanding of market sentiment and price movements.
Here are several effective ways to learn volume trading and incorporate volume into your trading strategy:
Breakout confirmation: When the price breaks through a key resistance level, it's crucial to observe a surge in trading volume. A breakout with low volume is suspicious and may lack the strength to sustain the move. Conversely, a high volume breakout signifies strong market sentiment and increased participation from market participants, making it a more trustworthy signal for potential trend continuation.
Volume divergence: This occurs when the price hits new highs, but trading volume decreases, signaling a potential slowdown or trend reversal. This divergence between price and volume is a red flag, indicating that the upward momentum may be losing steam and that traders should exercise caution.
Volume spikes: These are invaluable indicators. A sudden spike in volume, especially after a prolonged period of low trading volume, can indicate institutional interest or a significant market move on the horizon. Recognizing these volume spikes can alert traders to potential opportunities or impending price action changes.
Support and resistance validation: When price approaches or bounces off a support or resistance level with strong volume, it confirms the significance of that level. High trading volume at these levels suggests strong buying or selling pressure, making them more reliable indicators for future price movements. In contrast, low volume may indicate a weaker level, susceptible to breakouts.
Utilizing volume indicator signals like On-Balance Volume (OBV), Accumulation/Distribution Line, or Volume Weighted Average Price (VWAP) can further enhance your analysis. However, even raw volume bars, when interpreted correctly alongside relative volume, provide invaluable insights into market dynamics. By mastering these concepts, traders can develop robust trading strategies that align with market trends, support and resistance levels, and overall market sentiment, ultimately leading to more informed and profitable trading decisions.
Volume Across Different Markets
Whether you’re trading stocks, forex trading, crypto, or indices, volume still matters — but how you access it depends on the market.
In stocks, volume data is direct and incredibly telling. Institutional buying shows up fast. You’ll often see volume patterns in stocks before you see the price move fully play out. Stocks with high trading volume are often more liquid, allowing for easier entry and exit points, particularly when rising prices are observed. trading software, which is crucial for effective trading strategies. Furthermore, understanding the relationship between volume and price movements can help traders identify potential trend reversals and validate price breakouts.
In forex, true volume is tricky since it’s a decentralized market, but you can use tick volume (number of price changes in a candle) as a proxy. It’s not perfect, but it’s reliable enough for volume analysis in forex, especially when paired with price structure. Forex traders often rely on volume indicators like the Chaikin Money Flow (CMF) or the Money Flow Index (MFI) to gauge market sentiment and identify potential buying or selling pressure. By combining these indicators with other technical analysis tools, traders can develop comprehensive trading strategies that align with current market trends.
In crypto, volume can be wild — and incredibly revealing. Since this market is still retail-heavy and often manipulated, understanding volume spikes can help you avoid traps and spot legit moves early. High trading volume in cryptocurrencies can indicate strong market participation and potential price breakouts, while low trading volume might suggest a lack of interest or liquidity. By analyzing volume data within a defined trading range , crypto traders can better interpret market movements and make more informed trading decisions.
Across all these markets, volume plays a critical role in understanding market activity and making informed trading decisions. Whether you're analyzing stocks, forex, or crypto, recognizing volume trends and patterns, alongside the relative strength index, can provide valuable insights into market sentiment, price action, and potential opportunities for profit. By incorporating volume analysis within a defined trading range into your trading strategy, you can gain a deeper understanding of market dynamics and improve your overall trading performance.
Price and Volume: The Relationship That Never Lies
The most important takeaway? Price and volume are best friends — and when they disagree, something’s off.
If price is pumping but volume is dying? Get ready. That rally could be running on fumes. If price is dropping but volume is climbing fast? There’s real pressure there — and probably more to come.
Learning the price-volume relationship lets you gauge sentiment, spot exhaustion, and identify strength. It gives you an X-ray vision into the market’s internals. And in a world where fakeouts are everywhere, that kind of insight is invaluable.
Let Volume Speak
Look, there are a hundred tools out there. But few are as raw, real, and revealing as volume. Using volume in technical analysis isn’t about being flashy — it’s about being precise. It’s about trading with eyes wide open, not chasing empty moves.
So next time you open your charts, don’t just stare at the candles. Look below. Let volume speak. Because when you can spot volume confirmation signals, read volume patterns, and react to volume spikes with clarity, you’re not just watching the market.
You’re reading it. Like a pro.
1 note
·
View note
Text
The Role of Trading Value in Technical Analysis
Technical analysis is a fundamental aspect of trading that helps investors and traders make informed decisions by studying past market data. Among the various factors that influence technical analysis, trading value (or volume) plays a crucial role. Trading value represents the total amount of a security traded over a given period and is used to confirm trends, identify reversals, and assess market strength. This article explores the importance of trading value in technical analysis and how traders utilize it to enhance their strategies.
Understanding Trading Value
Trading value, often referred to as volume, is the total quantity of a financial asset traded within a specific timeframe. It indicates the level of activity surrounding a particular security and provides insights into market sentiment. When trading value is high, it suggests strong interest in the asset, whereas low trading value indicates reduced participation.
Volume is an essential component of technical analysis because it helps validate price movements. If a price trend is accompanied by high volume, it is more likely to be sustainable. Conversely, a price move on low volume might be weak and short-lived. Understanding trading value allows traders to distinguish between genuine market movements and potential price manipulations.

The Importance of Trading Value in Technical Analysis
1. Confirmation of Trends
One of the primary roles of trading value in technical analysis is to confirm trends. When prices move in a particular direction, traders look at volume to determine whether the trend has strong support. A bullish trend accompanied by increasing volume signals strong buying interest, making it more likely to continue. On the other hand, a declining market with rising volume suggests strong selling pressure, reinforcing the downward movement.
For example, if a stock is rising but volume remains low, it may indicate weak interest, suggesting a possible reversal. Conversely, if the stock rises with a significant increase in volume, the uptrend is likely to continue.
2. Identifying Market Reversals
Trading value can also signal potential market reversals. Sudden spikes in volume often precede major price reversals. This is because large institutional traders and investors enter or exit positions, leading to abrupt changes in market direction.
A common reversal pattern is the "volume climax," where a stock experiences a surge in trading volume at a market top or bottom. If a security has been in an uptrend and suddenly experiences heavy volume with little price gain, it could indicate that buying pressure is exhausted and a reversal may be imminent. Similarly, during a downtrend, a sharp increase in volume with price stabilization may suggest a bottoming-out phase.
3. Breakout and Breakdown Confirmation
Breakouts occur when an asset's price moves above a key resistance level, while breakdowns happen when it falls below a support level. Trading value plays a crucial role in confirming these movements.
For a breakout to be valid, it should be accompanied by a significant increase in volume. This indicates that buyers are strongly supporting the move, increasing the likelihood of sustained upward momentum. If the breakout occurs on low volume, it may be a false breakout, where the price quickly returns to its previous levels.
Similarly, a breakdown below a critical support level should be confirmed by high trading value, indicating strong selling pressure. A low-volume breakdown may lack conviction and could result in a rebound.
4. Divergence Analysis
Volume divergence occurs when price movement is not supported by corresponding changes in trading value. This divergence can signal a weakening trend and potential reversal.
For instance, if a stock continues to rise but volume starts decreasing, it suggests that buying interest is waning. This could indicate an upcoming price decline. Similarly, if a stock is in a downtrend but trading value starts increasing, it could mean selling pressure is reducing, and a reversal to the upside might be near.
5. Assessing Market Strength
Market strength is a key component of technical analysis, and trading value helps traders gauge it effectively. Strong trends are usually accompanied by high volume, while weak trends show declining volume. By analyzing volume patterns, traders can assess whether a trend has the strength to continue or if a potential reversal is on the horizon.
Key Volume-Based Indicators
To effectively use trading value in technical analysis, traders often rely on volume-based indicators. Some of the most popular ones include:
1. On-Balance Volume (OBV)
OBV is a cumulative volume indicator that adds volume on up days and subtracts it on down days. It helps traders identify whether volume is supporting the price trend. A rising OBV suggests that buying pressure is increasing, confirming an uptrend, while a declining OBV indicates selling pressure, supporting a downtrend.
2. Volume Weighted Average Price (VWAP)
VWAP calculates the average price of a security, weighted by volume. It is often used by institutional traders to assess whether the current price is overvalued or undervalued relative to average trading levels. If the price is above VWAP, it suggests a bullish trend, while a price below VWAP indicates a bearish trend.
3. Accumulation/Distribution (A/D) Line
The A/D line measures the flow of money into or out of a security. If the A/D line is rising while the stock price is declining, it signals that accumulation (buying) is occurring, which could lead to a price reversal. Conversely, a falling A/D line with a rising price suggests distribution (selling), warning of a potential downturn.
4. Chaikin Money Flow (CMF)
CMF is another volume-based indicator that assesses buying and selling pressure over a specific period. A positive CMF value indicates strong buying pressure, while a negative CMF suggests selling dominance. Traders use CMF to confirm price trends and potential reversals.
Practical Application of Trading Value
To illustrate the significance of trading value in technical analysis, consider a scenario where a stock is experiencing a bullish breakout above a resistance level. If the breakout is accompanied by a substantial increase in volume, it validates the movement, encouraging traders to enter long positions. However, if the breakout occurs on low volume, traders may be skeptical and wait for further confirmation before acting.
Using a Demo Account, traders can practice identifying such patterns without financial risk, refining their strategies before committing real capital.
Similarly, if a stock is declining and reaches a significant support level with high volume, traders might anticipate a breakdown and prepare for further downside. But if volume is low, the support level may hold, leading to a potential price rebound.
Conclusion
Trading value is an essential component of technical analysis that helps traders confirm trends, identify reversals, and assess market strength. By analyzing volume patterns and utilizing volume-based indicators, traders can make more informed decisions and improve their trading strategies. Trillium Financial Broker emphasizes the importance of understanding trading value, allowing investors to differentiate between strong and weak price movements, ultimately leading to better market predictions and profitable trades.
#TradingValue#TechnicalAnalysis#StockMarket#TradingStrategy#MarketTrends#VolumeAnalysis#FinancialMarkets#InvestmentTips
0 notes
Link
#volume moving average#technicalanalysis#tradingstrategies#volumeanalysis#markettrends#tradingsignals#priceaction
1 note
·
View note
Text
"Volume Rate of Change% Indicator: Measuring Market Activity and Momentum Shifts in Trading"
The Volume Rate of Change% (VROC%) Indicator measures the percentage change in volume over a specific period. It highlights shifts in trading activity, helping traders identify trends, confirm price movements, and spot potential reversals.
0 notes
Text
youtube
Crypto Red Flags: Spotting Fake Volume & Avoiding Bot Coins! Uncover red flags in cryptocurrency with our volume analysis! We explore volume botting, identify suspicious wallets, and reveal how to spot manipulated trading activity. Learn to protect your investments in the volatile crypto market. Don't get scammed! #Cryptocurrency #VolumeAnalysis #RedFlags #CryptoTrading #Bitcoin #Altcoins #DeFi #CryptoScams #TradingTips #InvestmentStrategy via YouTube https://www.youtube.com/watch?v=cCZvkV1Nz34
0 notes
Text
Understanding The Importance of Volume When Trading Stocks
Understanding The Importance of Volume When Trading Stocks https://www.youtube.com/watch?v=DF8VOJlNAUo Arguably the most important factor you MUST include to your trading strategy; Volume: Number of shares traded daily Liquidity: Dollar value traded daily (Volume x VWAP is a good gauge) Most traders are so concerned with all this clutter on their chart with MACD, RSI, Moving Averages, etc. Without Price Action (Candle Prints) And Volume there are NO INDICATORS. My point is: follow the main driver of those indicators. When using Volume Analysis we have to understand the relationship between price and volume. This will help us identify whether a directional change was valid or not. By observing the buying/selling demand, interest, volume, we can paint the picture very well. ✅ Subscribe To My Channel For More Videos: https://www.youtube.com/@AvidTrader/?sub_confirmation=1 ✅ Stay Connected With Me: 👉 (X)Twitter: https://twitter.com/RealAvidTrader 👉 Stocktwits: https://ift.tt/TI17Ja0 👉 Instagram: https://ift.tt/8XzMQPf ============================== ✅ Other Videos You Might Be Interested In Watching: 👉 The ULTIMATE Guide to Finding Hidden Gem Stocks | AvidTrader https://youtu.be/pZAKJLk9o0I 👉 How FDA Approval Could Rocket This Penny Stock to New Heights | AvidTrader https://www.youtube.com/watch?v=42AI9djkN0s 👉 Bitcoin Halving's Impact on Crypto Mining: What to Expect | AvidTrader https://www.youtube.com/watch?v=H9jIDKFNUlg 👉 How to Make Big Profits with Short Squeeze Stocks: A Comprehensive Trading Strategy | AvidTrader https://www.youtube.com/watch?v=59q6XeOlzas ============================= ✅ About AvidTrader: Value Investor. Discussing Day & Swing Trades Also Long Term Investments! Stock Breakdowns. Grow Your Trading Account Effectively. Technical Analysis and Pattern Recognition. How to Make Money, But More Importantly Learning & Having Fun in The Process! Avid Trader is not a Series 7 licensed investment professional, but a digital marketing manager/content creator to publicly traded and privately held companies. Avid Trader receives compensation from its clients in the form of cash and restricted securities for consulting services. 🔔 Subscribe to my channel for more videos: https://www.youtube.com/@AvidTrader/?sub_confirmation=1 ===================== #stockanalysis #tradingstrategies #technicalanalysis #volumeanalysis #swingtrading #daytradingstrategies #daytrading #daytrader #volumetrading #besttradingtips #tradingtips #avidtrader Disclaimer: We do not accept any liability for any loss or damage which is incurred from you acting or not acting as a result of reading any of our publications. You acknowledge that you use the information we provide at your own risk. I am not a certified financial advisor and you must do your own research and due diligence before ever buying or selling a stock. never trade solely based on someone else's word or expectations of a stock! Copyright Disclaimer: Under Section 107 of the Copyright Act 1976, allowance is made for "fair use" for purposes such as criticism, comment, news reporting, teaching, scholarship and research. Fair use is a use permitted by copyright statute that might otherwise be infringing. Non-profit, educational or personal use tips the balance in favor of fair use © AvidTrader via AvidTrader https://www.youtube.com/channel/UCK_XU3FW-ffEK8BG5EisnNA April 03, 2024 at 07:17AM
#stockanalysis#investmenttips#investmentstrategy#tradingstrategies#tradingtips#fundamentalanalysis#stockmarket#technicalanalysis
0 notes
Link
#economicnews#Forextrading#marketdepthdata#markettrends#Momentum#Technicalanalysis#timeandsalesdata#tradingstrategy#volumeanalysis#volumeindicators
0 notes
Text
youtube
Learn how to use the Money Flow Index (MFI) — one of the most powerful yet underrated technical indicators.
Perfect for stock traders, technical analysts, and beginners who want to use volume + price in one effective tool.
Read the full blog: https://navia.co.in/blog/money-flow-index-mfi/
Download the app - https://open.navia.co.in/index-navia.php?datasource=DMO-YT
Don't forget to like, share, and subscribe for more trading strategies!
#moneyflowindex#mfiindicator#technicalanalysis#stockmarketindia#tradingforbeginners#stocktradingtips#volumeanalysis#priceaction#tradingstrategies#niftytrading#stockmarketeducation#technicalindicators#overboughtoversold#bullishdivergence#bearishdivergence#breakoutstrategy#tradingtools#momentumtrading#indianstockmarket#naviatrading#chartpatterns#learntrading#intradaytrading#swingtrading#indicatorbasics#investingforbeginners#candlestickpatterns#macdtrading#bollingerbands#Youtube
0 notes
Photo
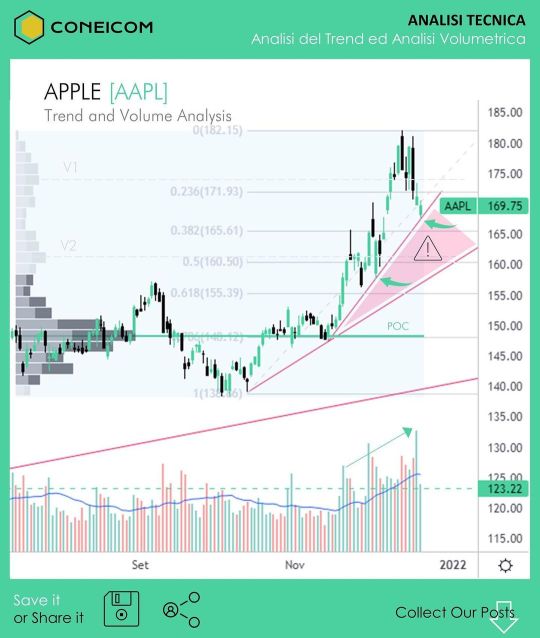
Il titolo Apple, dopo aver raggiunto i massimi storici lo scorso 13 Dicembre, avvia una fase fisiologica di storno perdendo l'8%. Ora il prezzo si trova a fare i conti con una importante zona di test data dal suo supporto dinamico di terzo livello, a valori ancora molto alti rispetto al Point of Control del semestre. 🤔Tu che visione hai del titolo? Apple avrà la forza di proseguire il trend al rialzo o continuerà la corsa al ribasso? - - - - - - - - - - - - 📣 “la conoscenza rende l’uomo consapevole, l’azione rende l’uomo libero. - - - - - - - - - - - - 📣 Seguici per maggiori post 👉@coneicom 👉@coneicom 👉@coneicom - - - - - - - - - - - - 🔎 se vuoi conoscerci meglio, visita il nostro link in bio e scopri tutti i nostri prodotti GRATUITI! - - - - - - - - - - - - 📣 Please, no investment advice! Il nostro obiettivo è l’educazione volta al confronto. - - - - - - - - - - - - #aapl #apple #appleinvestor #supportandresistance #trendanalysis #volumeanalysis #pointofcontrol (presso Forlí - Cesena, Emilia Romagna) https://www.instagram.com/p/CXvAFrqMdLc/?utm_medium=tumblr
0 notes
Link
#BreakoutTrading#chartpatterns#ExplosiveMarketMoves#marketvolatility#MomentumTrading#priceaction#ProfitTaking#riskmanagement#StockMarket#supportandresistance#technicalanalysis#TradingSignals#TradingStrategy#TrendFollowing#volumeanalysis
0 notes
Text
"Volume Double Moving Average Indicator: Enhancing Trend Signals with Volume-Based Insights"
The Volume Double Moving Average (VDMA) Indicator combines two moving averages of trading volume to highlight trends and potential reversals. By smoothing volume data, the VDMA helps traders identify bullish or bearish signals and assess market strength more clearly.
0 notes
Text
youtube
Unlock Crypto Secrets: Wallet Tracking & Scalping for HUGE Gains! Explore wallet tracking analysis and volume checks within the Kanto Group! We analyze Discord alerts for strong trading signals and consider scalping large coins. Discover our strategy for interpreting alerts and identifying profitable opportunities in the crypto market! #WalletTracking #KantoGroup #CryptoTrading #VolumeAnalysis #DiscordAlerts #ScalpingStrategy #TradingSignals #CryptoMarket #TradingOpportunities #CoinAnalysis via YouTube https://www.youtube.com/watch?v=iLdG-ovD-GA
0 notes
Link
#BreakoutTrading#BullishEngulfing#BullishHarami#BullishReversalPatterns#chartpatterns#CupandHandle#DoubleBottom#ForexTrading#Hammer#InvertedHammer#MarketSentiment#MomentumReversal#MorningStar#PiercingLine#priceaction#riskmanagement#StockMarket#supportandresistance#technicalanalysis#ThreeWhiteSoldiers#TradingSignals#TradingStrategy#TrendConfirmation#TrendReversal#TweezerBottom#volumeanalysis#WedgePattern
0 notes
Text
"Mastering Volume Indicators: Unlocking Market Trends with Powerful Volume-Based Strategies"
A Volume Indicator measures the trading activity of an asset by displaying the number of shares or contracts traded during a specific period. It helps traders gauge market strength, confirm trends, and identify potential reversals based on rising or falling volume levels.
0 notes