
anna-data-science-blog
Data Science Assignments
4 posts
Don't wanna be here? Send us removal request.
Last Seen Blogs

shxholistic
— Mads Euphoria.

sciencedriver
science driver

softwist-blog
softwist

dumbleclawfandommm
DumbleClaw Fans | inspired by Seamus

possession-swapbody
male body swap - possession
Text
Week 4: Graphing the Data
*********************
CODE
*********************
"""
Spyder Editor
Creating Graphs For Your Data
"""
import pandas
import numpy
import seaborn
import matplotlib.pyplot as plt
#read in data set in form of CSV
full_data = pandas.read_csv('nesarc_pds.csv', low_memory=False)
data = full_data[['S2BQ1B1', 'S13Q6A1', 'AGE']].copy()
#frequency distributions will be ordered according to numeric values
data['S2BQ1B1'] = pandas.to_numeric(data['S2BQ1B1'], errors='coerce')
data['S13Q6A1'] = pandas.to_numeric(data['S13Q6A1'], errors='coerce')
data['AGE'] = pandas.to_numeric(data['AGE'], errors='coerce')
# Data trimmed to people over the age of 40
sub1=data[(data['AGE']>=40)]
sub2=sub1.copy()
#convert "Unknown" to NAN
sub2["S2BQ1B1"] = sub2["S2BQ1B1"].replace(9, numpy.nan)
sub2["S13Q6A1"] = sub2["S13Q6A1"].replace(9, numpy.nan)
#relabel responses to reflect "yes" or "no"
sub2["ALCOHOLISM_IN_PAST_12_MOS"] = sub2["S2BQ1B1"].astype('category')
sub2["ALCOHOLISM_IN_PAST_12_MOS"] = sub2["ALCOHOLISM_IN_PAST_12_MOS"].cat.rename_categories(["yes", "no"])
# Convert "no"(2) to 0
sub2["ARTERIOSCLEROSIS_IN_PAST_12_MOS"] = sub2["S13Q6A1"].astype('category')
sub2["ARTERIOSCLEROSIS_IN_PAST_12_MOS"] = sub2["ARTERIOSCLEROSIS_IN_PAST_12_MOS"].cat.rename_categories([1, 0])
sub2["ARTERIOSCLEROSIS_IN_PAST_12_MOS"] = pandas.to_numeric(sub2["ARTERIOSCLEROSIS_IN_PAST_12_MOS"], errors="coerce")
#cut data into 40-49, 50-59, 60-69, 70+
sub2['AGE_GROUP'] = pandas.cut(data.AGE, [39, 50, 60, 70, 120])
sub2['AGE_GROUP'] = sub2['AGE_GROUP'].astype('category')
sub2['AGE_GROUP'] = sub2['AGE_GROUP'].cat.rename_categories(["40-49 y/o", "50-59 y/o", "60-69 y/o", "70+ y/o"])
#univariate bar chart for alcoholism categories
seaborn.countplot(x="ALCOHOLISM_IN_PAST_12_MOS", data=sub2)
plt.xlabel("Alcoholism in the past 12 months")
plt.title("Alcholism in the past 12 months among individuals >= 40y/o in the NESARC Study")
#univariate bar chart for arteriosclerosis categories
seaborn.countplot(x="ARTERIOSCLEROSIS_IN_PAST_12_MOS", data=sub2)
plt.xlabel("Arteriosclerosis in the past 12 months")
plt.title("Arteriosclerosis in the past 12 months among individuals >= 40y/o in the NESARC Study")
#univariate bar chart for age groups of respondents
seaborn.countplot(x="AGE_GROUP", data=sub2)
plt.xlabel("Age groups")
plt.title("Age Groups of Respondents >= 40y/o in the NESARC Study")
#a bivariate graph for alcoholism in the past 12 months(x-axis) and atherosclerosis in the past 12 months (y-axis)
seaborn.factorplot(x="ALCOHOLISM_IN_PAST_12_MOS", y="ARTERIOSCLEROSIS_IN_PAST_12_MOS", data=sub2, kind="bar", ci=None)
plt.xlabel("Alcoholism in the past 12 months")
plt.ylabel("Proportion of Arteriosclerosis in the past 12 months")
*********************
GRAPHS & SUMMARIES
*********************
The univariate graph of alcoholism in the past 12 months:
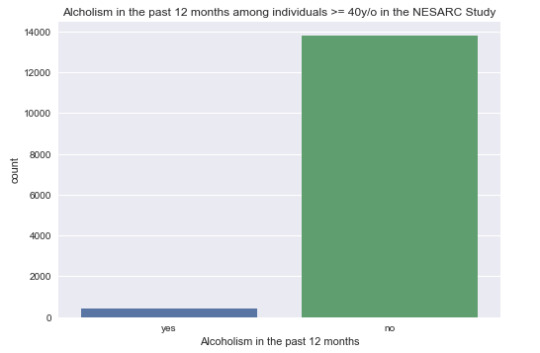
This graph is unimodal, with most observations falling under the category of “no” for alcoholism in the past 12 months for respondents 40 years of age or older.
The univariate graph of arteriosclerosis in the past 12 months:
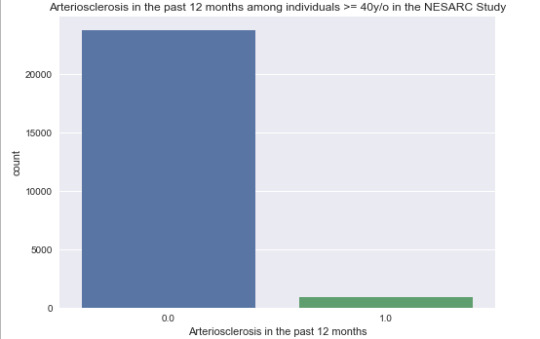
This graph is unimodal, with most observations falling under the category of “no” (0) for arteriosclerosis in the past 12 months for respondents 40 years of age or older.
The univariate graph of age groups of respondents:

This graph is unimodal, with the highest peak at the age group of 40-49 years old. It can be considered right-skewed, as there are higher frequencies in the lower age ranges.
The bivariate graph of alcoholism in the past 12 months vs. the proportion of arteriosclerosis in the past 12 months:
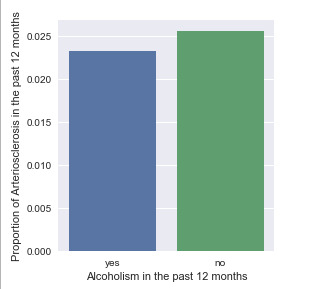
According to this graph, of the respondents aged 40y/o+ who experienced alcoholism in the past 12 months, approximately 2.3% experienced arteriosclerosis in the past 12 months. Of those who did not experience alcoholism, approximately 2.6% experienced arteriosclerosis in the past 12 months. In short, there was less than a 0.5% difference in rates of arteriosclerosis between those who did and those who did not experience alcoholism in the previous year.
0 notes
Text
Week 3: Data Management
"""
CODE
"""
#!/usr/bin/env python3
# -*- coding: utf-8 -*-
"""
Spyder Editor
Data Management
"""
import pandas
import numpy
#read in data set in form of CSV
full_data = pandas.read_csv('nesarc_pds.csv', low_memory=False)
data = full_data[['S2BQ1B1', 'S13Q6A1', 'AGE']].copy()
"""
#number of individuals
print("number of participants")
print(len(data))
"""
#frequency distributions will be ordered according to numeric values
data['S2BQ1B1'] = pandas.to_numeric(data['S2BQ1B1'], errors='coerce')
data['S13Q6A1'] = pandas.to_numeric(data['S13Q6A1'], errors='coerce')
data['AGE'] = pandas.to_numeric(data['AGE'], errors='coerce')
# Data trimmed to people over the age of 40
sub1=data[(data['AGE']>=40)]
sub2=sub1.copy()
#convert "Unknown" to NAN
sub2["S2BQ1B1"] = sub2["S2BQ1B1"].replace(9, numpy.nan)
sub2["S13Q6A1"] = sub2["S13Q6A1"].replace(9, numpy.nan)
#relabel responses to reflect "yes"(1) or "no" (2)
sub2["ALCOHOLISM_IN_PAST_12_MOS"] = sub2["S2BQ1B1"].astype('category')
sub2["ALCOHOLISM_IN_PAST_12_MOS"] = sub2["ALCOHOLISM_IN_PAST_12_MOS"].cat.rename_categories(["yes", "no"])
sub2["ARTERIOSCLEROSIS_IN_PAST_12_MOS"] = sub2["S13Q6A1"].astype('category')
sub2["ARTERIOSCLEROSIS_IN_PAST_12_MOS"] = sub2["ARTERIOSCLEROSIS_IN_PAST_12_MOS"].cat.rename_categories(["yes", "no"])
#cut data into 40-49, 50-59, 60-69, 70+
sub2['AGE_GROUP'] = pandas.cut(data.AGE, [39, 50, 60, 70, 120])
sub2['AGE_GROUP'] = sub2['AGE_GROUP'].astype('category')
sub2['AGE_GROUP'] = sub2['AGE_GROUP'].cat.rename_categories(["40-49 y/o", "50-59 y/o", "60-69 y/o", "70+ y/o"])
#count & percentages: individuals over or equal to 40 years old
print("counts for AGE")
c3 = sub2["AGE_GROUP"].value_counts(sort=False).sort_index()
print(c3)
print("percentages for AGE")
p3 = sub2["AGE_GROUP"].value_counts(sort=False, normalize=True).sort_index()
print(p3)
#count & percentages: alcohol abuse in the past 12 months
print("counts for alcohol abuse in the past 12 months, where age >=40")
c4 = sub2["ALCOHOLISM_IN_PAST_12_MOS"].value_counts(sort=False, dropna=False)
print(c4)
print("percentages for alcohol abuse in the past 12 months, where age >=40")
p4 = sub2["ALCOHOLISM_IN_PAST_12_MOS"].value_counts(sort=False, normalize=True, dropna=False)
print(p4)
#count & percentages: arteriosclerosis in the past 12 months
print("counts for arteriosclerosis in the past 12 months, where age >=40")
c5 = sub2["ARTERIOSCLEROSIS_IN_PAST_12_MOS"].value_counts(sort=False, dropna=False)
print(c5)
print("percentages for arteriosclerosis in the past 12 months, where age >=40")
p5 = sub2["ARTERIOSCLEROSIS_IN_PAST_12_MOS"].value_counts(sort=False, normalize=True, dropna=False)
print(p5)
print("alcoholism in the past 12 months, by age group")
print(pandas.crosstab(sub2["AGE_GROUP"], sub2["ALCOHOLISM_IN_PAST_12_MOS"]))
print("arteriosclerosis in the past 12 months, by age group")
print(pandas.crosstab(sub2["AGE_GROUP"], sub2["ARTERIOSCLEROSIS_IN_PAST_12_MOS"]))
print("arteriosclerosis and alcoholism in the past 12 months")
print(pandas.crosstab(sub2["ALCOHOLISM_IN_PAST_12_MOS"], sub2["ARTERIOSCLEROSIS_IN_PAST_12_MOS"]))
"""
OUTPUT
"""
"""
SUMMARY
"""
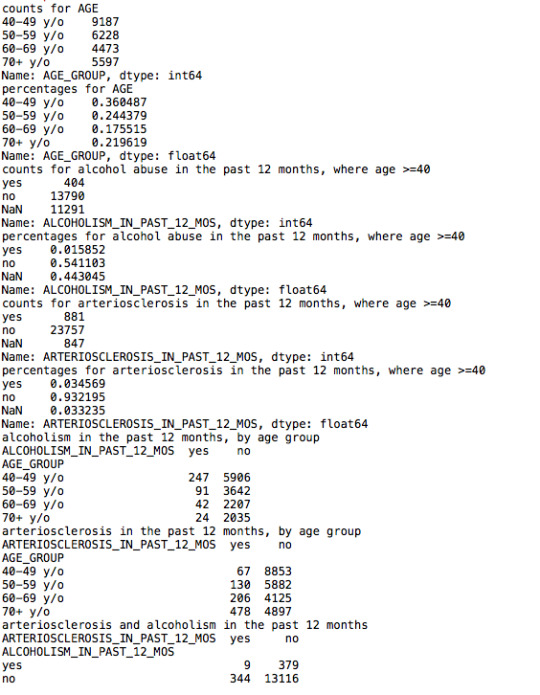
For this week’s assignment, I analyzed three variables: the ages of respondents, whether or not they experienced alcoholism in the past 12 months, and whether or not they experienced arteriosclerosis in the past 12 months. My data management included grouping the different respondents into age groups to make analysis more manageable, replacing “Unknown” or “NA” responses with NaN, and renaming categories to be more legible (“yes” or “no” rather than “1” or “2”).
I performed cross-tabulations for all three of my variables.
For age groups, respondents between 40-49 years old — the youngest in the current group studied— most commonly responded that they experienced alcoholism in the past months. On the other hand, respondents 70+ years old most frequently responded that they experienced arteriosclerosis in the past 12 months.
0 notes
Text
Running My First Program
******************************************
MY PROGRAM
******************************************
# -*- coding: utf-8 -*-
"""
Spyder Editor
This is my first program, performing exploratory analysis on the NESARC data for the question: Is there an association between alcohol abuse in the past 12 months and ateriosclerosis in the past 12 months, for individuals greater than or equal to 40 years old?
"""
import pandas
import numpy
#read in data set in form of CSV
data = pandas.read_csv('nesarc_pds.csv', low_memory=False)
#frequency distributions will be ordered according to numeric values
data['S2BQ1B1'] = pandas.to_numeric(data['S2BQ1B1'], errors='coerce')
data['S13Q6A1'] = pandas.to_numeric(data['S13Q6A1'], errors='coerce')
data['AGE'] = pandas.to_numeric(data['AGE'], errors='coerce')
# Data trimmed to people over the age of 40
sub1=data[(data['AGE']>=40)]
sub2=sub1.copy()
#count & percentages: individuals over or equal to 40 years old
print("counts for AGE")
c3 = sub2["AGE"].value_counts(sort=False).sort_index()
print(c3)
print()
print("percentages for AGE")
p3 = sub2["AGE"].value_counts(sort=False, normalize=True).sort_index()
print(p3)
#count & percentages: alcohol abuse in the past 12 months
print("counts for alcohol abuse in the past 12 months, where age >=40")
c4 = sub2["S2BQ1B1"].value_counts(sort=False)
print(c4)
print("percentages for alcohol abuse in the past 12 months, where age >=40")
p4 = sub2["S2BQ1B1"].value_counts(sort=False, normalize=True)
print(p4)
#count & percentages: arteriosclerosis in the past 12 months
print("counts for arteriosclerosis in the past 12 months, where age >=40")
c5 = sub2['S13Q6A1'].value_counts(sort=False)
print(c5)
print("percentages for arteriosclerosis in the past 12 months, where age >=40")
p5 = sub2['S13Q6A1'].value_counts(sort=False, normalize=True)
print(p5)
******************************************
FREQUENCY TABLES
******************************************
counts for AGE
40 992
41 881
42 912
43 832
44 823
45 878
46 799
47 810
48 789
49 742
50 729
51 732
52 693
53 711
54 742
55 594
56 589
57 541
58 621
59 502
60 503
61 500
62 454
63 458
64 453
65 448
66 442
67 423
68 405
69 464
70 426
71 423
72 397
73 432
74 441
75 384
76 367
77 377
78 317
79 297
80 324
81 262
82 233
83 237
84 175
85 175
86 139
87 149
88 94
89 98
90 76
91 53
92 45
93 26
94 24
95 16
96 13
97 9
98 14
Name: AGE, dtype: int64
percentages for AGE
40 0.038925
41 0.034569
42 0.035786
43 0.032647
44 0.032294
45 0.034452
46 0.031352
47 0.031783
48 0.030959
49 0.029115
50 0.028605
51 0.028723
52 0.027192
53 0.027899
54 0.029115
55 0.023308
56 0.023112
57 0.021228
58 0.024367
59 0.019698
60 0.019737
61 0.019619
62 0.017814
63 0.017971
64 0.017775
65 0.017579
66 0.017344
67 0.016598
68 0.015892
69 0.018207
70 0.016716
71 0.016598
72 0.015578
73 0.016951
74 0.017304
75 0.015068
76 0.014401
77 0.014793
78 0.012439
79 0.011654
80 0.012713
81 0.010281
82 0.009143
83 0.009300
84 0.006867
85 0.006867
86 0.005454
87 0.005847
88 0.003688
89 0.003845
90 0.002982
91 0.002080
92 0.001766
93 0.001020
94 0.000942
95 0.000628
96 0.000510
97 0.000353
98 0.000549
Name: AGE, dtype: float64
counts for alcohol abuse in the past 12 months, where age >=40
2.0 13790
1.0 404
9.0 214
Name: S2BQ1B1, dtype: int64
percentages for alcohol abuse in the past 12 months, where age >=40
2.0 0.957107
1.0 0.028040
9.0 0.014853
Name: S2BQ1B1, dtype: float64
counts for arteriosclerosis in the past 12 months, where age >=40
1 881
2 23757
9 847
Name: S13Q6A1, dtype: int64
percentages for arteriosclerosis in the past 12 months, where age >=40
1 0.034569
2 0.932195
9 0.033235
Name: S13Q6A1, dtype: float64
******************************************
SUMMARY
******************************************
A random sample of 43,093 were asked to report their ages. Of all these respondents, 25,485 (59.1%) were greater than or equal to 40 years old.
The participants were asked if alcohol abuse/dependence had happened for them in the last 12 months. Of all of the respondents 40 years old or greater, 2.8 % chose category 1 (yes), 1.5 % chose category 9, indicating the question was not applicable of the individual was a lifetime abstainer, and the remaining majority were under category 2.0 (no).
For the next question, the same participants were asked if they experienced arteriosclerosis or hardening of the arteries in the past 12 months. Of all of the participants aged 40+, 3.5 % fell under category 1 (yes), 3.3% where under category 9 [Unknown], and the remaining 93.2 % chose category 2 (no).
0 notes
Text
Starting the Research Project
As an engineer with a medical background, I was particularly interested in studying the NESARC data, and in particular the possible associations between alcohol abuse and coronary conditions, as both are serious chronic illnesses in the country where I live. I am particularly interested in the exploring the association of whether alcohol abuse/dependence happened in the last 12 months and associating that whether the subject experienced hardening of arteries or arteriosclerosis in the last 12 months, as I have known people with comorbidity of the two conditions. To summarize my current research question: Is alcohol abuse in the last 12 months associated with arteriosclerosis in the last 12 months?
As such, I have added to my codebook variables reflecting alcohol abuse and variables reflecting cardiovascular health within the same time frame. I performed a review of literature, and several articles remarked that alcohol abuse is a known risk factor for cardiovascular disease. The authors of “Markers of early vascular ageing”* list alcohol as a classic risk factor alongside “age, gender, diabetes mellitus, dyslipidemia.” According to the article “White coat hypertension may be an initial sign of accelerated atherosclerotic process,”* alcohol intake may even have a causative relationship to accelerated atherosclerosis—a condition known as metabolic syndrome.
My hypothesis is that there will be a positive correlation between alcohol abuse and the hardening of arteries in the last 12 months.
Works Cited
* Kotsis, V., et al. "Markers of early vascular ageing." Current pharmaceutical design (2017).
* Helvaci, Mehmet Rami, et al. "White coat hypertension may be an initial sign of an accelerated atherosclerotic process." Middle East Journal of Internal Medicine 10.2 (2017).
0 notes