
Don't wanna be here? Send us removal request.
Statistics
We looked inside some of the posts by annoyingempathcreatorpanda and here's what we found interesting.
Average Info
Notes Per Post
1
Likes Per Post
1
Reblog Per Post
0
Reply Per Post
0
Time Between Posts
4 days
Number of Posts By Type
Text
5
Last Seen Tumblr Blogs


Fun Fact
Tumblr has 411 employees.
Text
Let’s snoop into Whatsapp
Whatsapp has now grown to become a cost efficient alternative to SMS with more than 2 billion users. It allows text messages, voice messages, voice and video calls and share images, documents and user locations. Currently, Whatsapp is planning to release a new update for 8 people group video call inorder to win over competition among other video calling apps. Whatsapp has now promoting small start-ups through Whatsapp business platform. It enables to create a verified business profile for small business openings and easy client communication in which only first communication between client and firm is by client only.
Key Activities
Web Development and Maintenance
Building app more user friendly
24 * 7 customer support
Security and Privacy
Design improvements like last seen, self-destruction statuses Retention rate of 11%
Monthly active users
Whatsapp uses a subscription model that is, Average Revenue Per User (ARPU) which auto renew an annual renewal fee for free for most of its users. In the year 2016, it also removed $1 annual subscription and removed third party ads. The news of leaving Whatsapp by Brain Anton and Jan Koum who were the original founders of Whatsapp was a shocking news for all, but why they quit? We all knew that in 2014 Facebook acquired Whatsapp by 19.3 billion dollars. By its merging, parent company changed its terms of service to give network access to Whatsapp user’s phone numbers. Furthermore, to weaken the encryption, Facebook introduced BusinessWhatsapp in 2018 to let businesses read user messages.
Revenue Structure
Whatsapp Business charges different pricing for business account.
Whatsapp for Business APIs which charges businesses for messages sent after 24 hours of initial contact
BigData : shares useful patterns and trends from user’s behavioural Data
Huge Investment by Sequoia Capital (250K USD)
Tie Up with Telecom partners like Reliance Jio, KARIX Mobiles
Phone manufacturers(preinstalled app on some phone devices)
Paid membership of $0.99 yearly for iOS clients ( no fees for Android, Windows).
Whatsapp also makes money internally by transfer pricing which is an internal transaction within the company for the own profit of certain divisions of the Facebook which owns 82 companies other than Whatsapp. It does not affect the overall profit and help to avoid taxes in countries where Facebook have substantial trading operations. Whatsapp data is used to coordinate more and improve experiences in Facebook for targeted advertising. Learning the likes, dislikes and by the aid of listening tools like Whatsapp search and hashtag (#), the training model improves its learning and produce more results like what the customer likes and dislikes. Whatsapp provides its services free of cost and it is also ad free. By its merging the servers where the messages sent by user is stored before delivering it to the recipient are shared with central database of Facebook. In 2016, Facebook made a false accusation that it is technically impossible to automatically combine user information from Facebook and Whatsapp. The scandal by Cambridge Analytica, a data mining firm who used private data on lease by Facebook is an example.
Here are the top reasons for the biggest deal of Facebook
Whatsapp have about 2 billion users which means the greatest pool of public. So Facebook can attract businesses who looking for potential customers.
Facebook sell the results such as trends, purchasing patterns of data mining on Whatsapp data to third parties.
Whatsapp software automatically syncs contacts from device and compares with its central database of users so by using phone number Facebook can trace valid accounts and can remove disguised missing data caused by fake profiles in Facebook during data mining process. In data mining, dirty data can result in unreliable output which can cause wrong recommendations regarding product.
User information in Whatsapp is accessible by parent company and they use phone number for Facebook ads.
Daily, around 65 billion messages, 55 million video calls and 2 billion minutes voice calls are handled by Whatsapp servers which is an extreme asset for Facebook to develop new machine learning algorithms and for the improvement of existing artificial learning models .
Recent initiative by Facebook for BusinessWhatsapp is another tactic to dethrone all competitors in its current largest market in India. Very recently, Facebook has bought a 9.9 % stake in Reliance Jio which has 388 million Indian customers thus widening its audience range.
With an enormous amount of public and data, Facebook can become both the trend maker and the decision maker of future economy. Whatsapp has even secured regulatory approval for launching Whatsapp Pay, a payment platform via messaging platform. In view to smooth business deals between clients and firms. Brian and Koum who were the strict advocates of data privacy were not supportive of new policies by its parent company. In his retirement speech, he advised to delete Facebook. Facebook can hence control and cut down its competitors easily.
Key Resources
Larger database
Exponential growth
App philosophy(No ads, gimmicks, games)
Security Development team of 32 developers
Neeraj Arora leadership and vision
Technology : Erlang programming,Customized version of open standard XMPP Mailing lists E-WOM (Electronic Word of Mouth)
No Public Relation exercises Cost Structure
Recurring cost of salaries for a small team(35 to 50 employees)
Utilities like cleaner junk files
Data centre costs
Ejabberd XMPP server, Yaws server, Lighttpd server usage
Software Licensing Fees
Company Formation and Legal Advisories Product and Platform Development
Servers and Data Maintenance Research and Development
Hardware 3rd party services
Integration Variable costs such as business travel and others
Key Partners
Funded by venture capitalist like Sequoia Capital
Facebook Inc Internet Platform Providers
App stores
Phone manufacturers(preinstalled app on some phone devices)
OS Integrators Partnership with multiple banks(AXIS, ICICI & HDFC) in India
Critical tie-ups with 50+ carriers around the world under Neeraj Arora Team
0 notes
Text
Testing a Potential Moderator
Correlation based on the Gapminder data between rate of urban dwellers in each country and the internet use rate. This was a significant association with the correlation of 0.61. But might this relationship, this correlation between urban rate and internet use rate differ based on countries with different income levels? To explore this question,a third variable called income group which is categorical. For this new variable, the income per person variable, which is quantitative, was categorized as a high income country given a value of 3, a moderate income country given a value of 2, and a low income country given a value of 1.
LIBNAME mydata "/courses/d1406ae5ba27fe300 " access=readonly; DATA new; set mydata.diet_exercise;
PROC SORT; BY EXERCISE;
PROC ANOVA; CLASS DIET; MODEL WEIGHTLOSS=DIET; MEANS DIET; BY EXERCISE
RUN;
The ANOVA table examining the relationship between diet and weight loss for those in the cardio exercise group shows a large F value and a significant associated F value. The association between diet and weight loss for those involved in weight training exercise program is also significant.
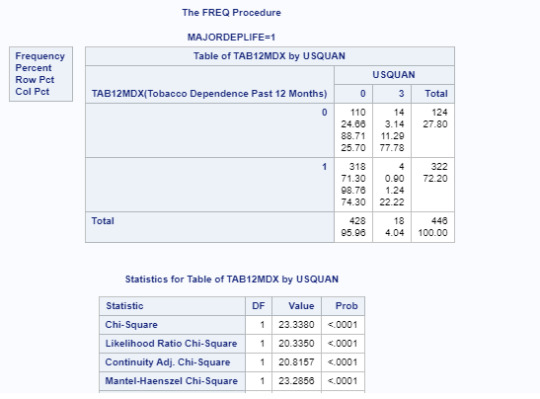
Next, i am examining the association between nicotine dependence in past 12 months and new smoking variable USQUAN. From large chi square value and p value, smoking quantity and nicotine dependence are significantly associated. There is a positive linear relationship between lower levels of smoking and higher levels of smoking. For both young adults with major depression and those without , higher levels of smoking behavior is associated with higher rates of nicotine dependence.
/*Example Using Chi-Square*/ LIBNAME mydata "/courses/d1406ae5ba27fe300 " access=readonly; DATA new; set mydata.nesarc_pds; LABEL TAB12MDX="Tobacco Dependence Past 12 Months" CHECK321="Smoked Cigarettes in Past 12 Months" S3AQ3B1="Usual Smoking Frequency" S3AQ3C1="Usual Smoking Quantity";
/*Set appropriate missing data as needed*/ IF S3AQ3B1=9 THEN S3AQ3B1=.; IF S3AQ3C1=99 THEN S3AQ3C1=.;
IF S3AQ3B1=1 THEN USFREQMO=30; ELSE IF S3AQ3B1=2 THEN USFREQMO=22; ELSE IF S3AQ3B1=3 THEN USFREQMO=14; ELSE IF S3AQ3B1=4 THEN USFREQMO=5; ELSE IF S3AQ3B1=5 THEN USFREQMO=2.5; ELSE IF S3AQ3B1=6 THEN USFREQMO=1; /*USFREQMO usual smoking days per month 1=once a month or less 2.5=2-3 days per month 5=1-2 days per week 14=3-4 days per week 22=5-6 days per week 30=everyday*/
NUMCIGMO_EST=USFREQMO*S3AQ3C1;
PACKSPERMONTH=NUMCIGMO_EST/20;
IF PACKSPERMONTH LE 5 THEN PACKCATEGORY=3; ELSE IF PACKSPERMONTH LE 10 THEN PACKCATEGORY=7; ELSE IF PACKSPERMONTH LE 20 THEN PACKCATEGORY=15; ELSE IF PACKSPERMONTH LE 30 THEN PACKCATEGORY=25; ELSE IF PACKSPERMONTH GT 30 THEN PACKCATEGORY=58;
/*USQUAN: 0=nondaily smoking; 3=1-5 cigs/day; 8=6-10 cigs/day; 13=11-15 cigs/day; 18=16-20 cigs/day; 37=21-37 cigs/day*/ IF S3AQ3C1 NE 1 THEN USQUAN=0; ELSE IF S3AQ3C1 GE 1 AND S3AQ3C1 LE 5 THEN USQUAN=3; ELSE IF S3AQ3C1 GE 6 AND S3AQ3C1 LE 10 THEN USQUAN=8; ELSE IF S3AQ3C1 GE 11 AND S3AQ3C1 LE 15 THEN USQUAN=13; ELSE IF S3AQ3C1 GE 16 AND S3AQ3C1 LE 20 THEN USQUAN=18; ELSE IF S3AQ3C1 GE 20 THEN USQUAN=37;
/*subsetting data to include only past 12 month smokers, age 18-25*/ IF CHECK321=1; IF AGE LE 25;
PROC SORT; by MAJORDEPLIFE;
PROC FREQ; TABLES TAB12MDX*USQUAN/CHISQ; BY MAJORDEPLIFE;
/*PACKCATEGORY PACKSPERMONTH TAB12MDX CHECK321 S3AQ31 S3AQ3C1;*/
PROC GCHART; VBAR USQUAN/discrete type=mean SUMVAR=TAB12MDX;
RUN;
/*Example Using Pearson Correlaton*/ LIBNAME mydata "/courses/d1406ae5ba27fe300 " access=readonly; DATA new; set mydata.gapminder;
IF incomeperperson EQ . THEN incomegrp=.; ELSE IF incomeperperson LE 744.239 THEN incomegrp=1; ELSE IF incomeperperson LE 9425.236 THEN incomegrp=2; ELSE IF incomeperperson GE 9425.236 THEN incomegrp=3;
IF incomegrp NE .;
PROC SORT; by COUNTRY;
PROC SORT; by incomegrp;
PROC CORR; VAR urbanrate internetuserate; BY incomegrp;
RUN;
Summary
For the low income group, the correlation between urban rate and internet use rate is 0.11 and the p-value is not significant. For the moderate income countries, the association between internet use rate and urban rate is 0.329 with a significant p-value at 0.0014. And finally, among high income countries, the correlation coefficient is 0.089, again with a large p-value, suggesting that the association between urban rate and internet rate is not significant for high income countries.
Screenshots of results are attached below


The change of value of the Pearson Correlation Coefficient due to the testing moderator does not have obvious pattern or trend. In other words, it is not a significant moderator for the relationship between "urbanrate" and "internetuserate".
0 notes
Text
Corelation Test
A correlation coefficient assesses the degree of linear relationship between two variables. It ranges from +1 to -1. A correlation of +1 means that there is a perfect, positive, linear relationship between the two variables. A correlation of -1 means there is a perfect, negative linear relationship between the two variables. In both cases, knowing the value of one variable, you can perfectly predict the value of the second. Note that if your research question only includes categorical variables, you can choose other variables from your data set just to get some practice with the tool.
LIBNAME mydata "/courses/d1406ae5ba27fe300 " access=readonly; DATA new; set mydata.gapminder; IF incomeperperson eq . THEN incomegroup=.; ELSE IF incomeperperson LE 744.239 THEN incomegroup=1; ELSE IF incomeperperson LE 2553.496 THEN incomegroup=2; ELSE IF incomeperperson LE 9425.236 THEN incomegroup=3; ELSE IF incomeperperson GT 9425.236 THEN incomegroup=3;
PROC SORT; by COUNTRY;
PROC CORR; VAR urbanrate incomeperperson internetuserate;
RUN;
0 notes
Text
Chi-Square Test
When examining the association between lifetime major depression (categorical response) and past year nicotine dependence (categorical explanatory), a chi-square test of independence revealed that among daily, young adults smokers (my sample), those with past year nicotine dependence were more likely to have experienced major depression in their lifetime(36.2%) compared to those without past year nicotine dependence (12.7%), X2 =88.60, 1 df, p=0001.
LIBNAME mydata "/courses/d1406ae5ba27fe300 " access=readonly; DATA new; set mydata.nesarc_pds; LABEL TAB12MDX="Tobacco Dependence Past 12 Months" CHECK321="Smoked Cigarettes in Past 12 Months" S3AQ3B1="Usual Smoking Frequency" S3AQ3C1="Usual Smoking Quantity";
/*Set appropriate missing data as needed*/ IF S3AQ3B1=9 THEN S3AQ3B1=.; IF S3AQ3C1=99 THEN S3AQ3C1=.;
IF S3AQ3B1=1 THEN USFREQMO=30; ELSE IF S3AQ3B1=2 THEN USFREQMO=22; ELSE IF S3AQ3B1=3 THEN USFREQMO=14; ELSE IF S3AQ3B1=4 THEN USFREQMO=5; ELSE IF S3AQ3B1=5 THEN USFREQMO=2.5; ELSE IF S3AQ3B1=6 THEN USFREQMO=1; /*USFREQMO usual smoking days per month 1=once a month or less 2.5=2-3 days per month 5=1-2 days per week 14=3-4 days per week 22=5-6 days per week 30=everyday*/
NUMCIGMO_EST=USFREQMO*S3AQ3C1;
PACKSPERMONTH=NUMCIGMO_EST/20;
IF PACKSPERMONTH LE 5 THEN PACKCATEGORY=3; ELSE IF PACKSPERMONTH LE 10 THEN PACKCATEGORY=7; ELSE IF PACKSPERMONTH LE 20 THEN PACKCATEGORY=15; ELSE IF PACKSPERMONTH LE 30 THEN PACKCATEGORY=25; ELSE IF PACKSPERMONTH GT 30 THEN PACKCATEGORY=58;
/*subsetting data to include only past 12 month smokers, age 18-25*/ IF CHECK321=1; IF AGE LE 25;
PROC SORT; by IDNUM;
/*PROC ANOVA; CLASS ETHRACE2A; MODEL NUMCIGMO_EST=ETHRACE2A; MEANS ETHRACE2A/DUNCAN;*/
PROC FREQ; TABLES TAB12MDX*USFREQMO/CHISQ;
RUN;
DATA COMPARISON1; SET NEW; IF USFREQMO=1 OR USFREQMO=2.5; PROC SORT; BY IDNUM; PROC FREQ; TABLES TAB12MDX*USFREQMO/CHISQ; RUN;
DATA COMPARISON2; SET NEW; IF USFREQMO=1 OR USFREQMO=6; PROC SORT; BY IDNUM; PROC FREQ; TABLES TAB12MDX*USFREQMO/CHISQ; RUN;
DATA COMPARISON3; SET NEW; IF USFREQMO=1 OR USFREQMO=14; PROC SORT; BY IDNUM; PROC FREQ; TABLES TAB12MDX*USFREQMO/CHISQ; RUN;
DATA COMPARISON4; SET NEW; IF USFREQMO=1 OR USFREQMO=22; PROC SORT; BY IDNUM; PROC FREQ; TABLES TAB12MDX*USFREQMO/CHISQ; RUN;
DATA COMPARISON5; SET NEW; IF USFREQMO=1 OR USFREQMO=30; PROC SORT; BY IDNUM; PROC FREQ; TABLES TAB12MDX*USFREQMO/CHISQ; RUN;
DATA COMPARISON6; SET NEW; IF USFREQMO=2.5 OR USFREQMO=6; PROC SORT; BY IDNUM; PROC FREQ; TABLES TAB12MDX*USFREQMO/CHISQ; RUN;
DATA COMPARISON7; SET NEW; IF USFREQMO=2.5 OR USFREQMO=14; PROC SORT; BY IDNUM; PROC FREQ; TABLES TAB12MDX*USFREQMO/CHISQ; RUN;
DATA COMPARISON8; SET NEW; IF USFREQMO=2.5 OR USFREQMO=22; PROC SORT; BY IDNUM; PROC FREQ; TABLES TAB12MDX*USFREQMO/CHISQ; RUN;
DATA COMPARISON9; SET NEW; IF USFREQMO=2.5 OR USFREQMO=30; PROC SORT; BY IDNUM; PROC FREQ; TABLES TAB12MDX*USFREQMO/CHISQ; RUN;
DATA COMPARISON10; SET NEW; IF USFREQMO=6 OR USFREQMO=14; PROC SORT; BY IDNUM; PROC FREQ; TABLES TAB12MDX*USFREQMO/CHISQ; RUN;
DATA COMPARISON11; SET NEW; IF USFREQMO=6 OR USFREQMO=22; PROC SORT; BY IDNUM; PROC FREQ; TABLES TAB12MDX*USFREQMO/CHISQ; RUN;
DATA COMPARISON12; SET NEW; IF USFREQMO=6 OR USFREQMO=30; PROC SORT; BY IDNUM; PROC FREQ; TABLES TAB12MDX*USFREQMO/CHISQ; RUN;
DATA COMPARISON13; SET NEW; IF USFREQMO=14 OR USFREQMO=22; PROC SORT; BY IDNUM; PROC FREQ; TABLES TAB12MDX*USFREQMO/CHISQ; RUN;
DATA COMPARISON1; SET NEW; IF USFREQMO=14 OR USFREQMO=30; PROC SORT; BY IDNUM; PROC FREQ; TABLES TAB12MDX*USFREQMO/CHISQ; RUN;
DATA COMPARISON15; SET NEW; IF USFREQMO=22 OR USFREQMO=30; PROC SORT; BY IDNUM; PROC FREQ; TABLES TAB12MDX*USFREQMO/CHISQ; RUN;
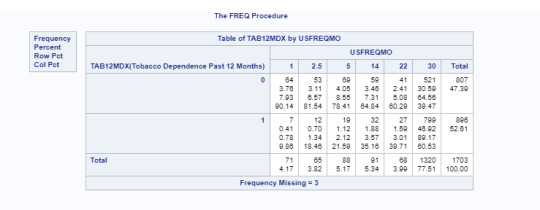
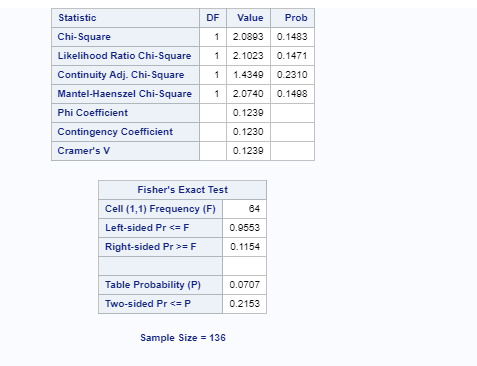
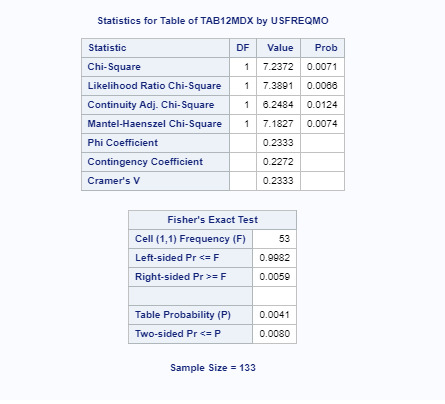
A Chi Square test of independence revealed that among daily, young adult smokers (my sample), number of cigarettes smoked per day (collapsed into 5 ordered categories) and past year . Post hoc comparisons of rates of nicotine dependence by pairs of cigarettes per day categories revealed that higher rates of nicotine dependence were seen among those smoking more cigarettes, up to 11 to 15 cigarettes per day. In comparison, prevalence of nicotine dependence was statistically similar among those groups smoking 10 to 15, 16 to 20, and > 20 cigarettes per day.
0 notes
Text
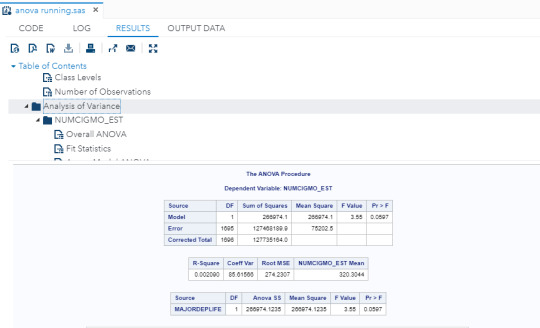
ANOVA Testing on NESARC Dataset
Here is the code i used in SAS Studio.
LIBNAME mydata "/courses/d1406ae5ba27fe300" access=readonly; DATA new; set mydata.nesarc_pds;
LABEL TAB12MDX="Tobacco Dependence Past 12 Months" CHECK321="Smoked Cigarettes in Past 12 Months" S3AQ3B1="Usual Smoking Frequency" S3AQ3C1="Usual Smoking Quantity";
/*Set appropriate missing data as needed*/ IF S3AQ3B1=9 THEN S3AQ3B1=.; IF S3AQ3C1=99 THEN S3AQ3C1=.;
IF S3AQ3B1=1 THEN USFREQMO=30;
ELSE IF S3AQ3B1=2 THEN USFREQMO=22; ELSE IF S3AQ3B1=3 THEN USFREQMO=14; ELSE IF S3AQ3B1=4 THEN USFREQMO=5; ELSE IF S3AQ3B1=5 THEN USFREQMO=2.5; ELSE IF S3AQ3B1=6 THEN USFREQMO=1; /*USFREQMO usual smoking days per month 1=once a month or less 2.5=2-3 days per month 5=1-2 days per week 14=3-4 days per week 22=5-6 days per week 30=everyday*/
NUMCIGMO_EST=USFREQMO*S3AQ3C1;
PACKSPERMONTH=NUMCIGMO_EST/20;
IF PACKSPERMONTH LE 5 THEN PACKCATEGORY=3; ELSE IF PACKSPERMONTH LE 10 THEN PACKCATEGORY=7; ELSE IF PACKSPERMONTH LE 20 THEN PACKCATEGORY=15; ELSE IF PACKSPERMONTH LE 30 THEN PACKCATEGORY=25; ELSE IF PACKSPERMONTH GT 30 THEN PACKCATEGORY=58;
/*subsetting data to include only past 12 month smokers, age 18-25*/ IF CHECK321=1; IF AGE LE 25;
PROC SORT; by IDNUM;
PROC ANOVA; CLASS MAJORDEPLIFE; MODEL NUMCIGMO_EST=MAJORDEPLIFE; MEANS MAJORDEPLIFE;
PROC ANOVA; CLASS ETHRACE2A; MODEL NUMCIGMO_EST=ETHRACE2A; MEANS ETHRACE2A/DUNCAN;
RUN;

1 note
·
View note