
Last Seen Blogs

yustinamishka
Yunmeng Jiang Archive

jerseyroyalty0102-blog-blog
pink.monroe

ballas-4
Sergey

thegreatmoof
The Weeaboutique

vodka-trash
vodka-trash
Text
A COMPARATIVE STUDY ON STUNTING IN UNDER FIVE YEARS CHILDREN. A SECONDARY ANALYSIS OF RWANDA NATIONAL SURVEYS OF 2005, 2010 AND 2014-2015.
1. RESULTS
1.1. Characteristics of the study population
In the 2005 Rwanda Demographic and Health Survey, 3840 children under five years were considered in the survey. In 2010 RDHS, 4133 children under five years were sampled. In the 2014-15 RHDS survey, 3599 children under five years were included in the survey. Table 1 depicts the general characteristics of children under five years in 2005, 2010, 2014-15 RDHS.
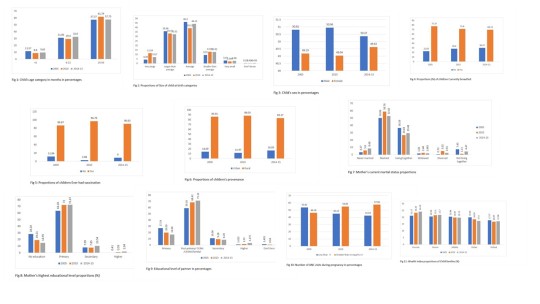
The figures below show that 11.57% of the 3840 children sampled in this study were under 6 months in 2005, 31.06% of them were between 6 and 23 months; and in 2014-15, the majority of children sampled were between 24 and 59 months (57.75% of 3599). Boys sampled were 50.81% of 3840 in 2005, 50.96% of 4133 in 2010 and 50.37% of 3599 in 2014-15; Girls sampled were 49.19 of 3840 in 2005, 49.04% of 4133 in 2010 and 49.63 of 3599 in 2014-15.
Among the children reported for size at birth in the three surveys, 11.54% of 4133 were reported as very large size at birth in 2010, 35.98% of 3840 were reported as lager size than average in 2005, 46.3% of 3840 were reported average in 2005, 13.03% of 4133 were reported as smaller size than average at birth in 2010, 2.97% of 3599 were reported as very small in 2014-15 RDHS survey.
Among the three RDHS surveys, a high percentage of children were breastfed during the 2005 RDHS (77.37% of 3840 sampled children) than in other RDHS surveys. A high percentage were recorded for children under five ever had vaccination in the 2010 RDHS with 96.79% of 4133 sampled children. In three surveys, sampled children from rural areas were many compared to their counterpart from urban areas.
A high percentage of never married interviewed mothers was reported in 2014-15 RDHS (8.82%), of married women was reported in the 2010 RDHS (58.72%), of living together interviewed women was reported in the 2005 RDHS (35.72%), of widowed were reported in the 2010 RDHS (2.44%), of divorced interviewed women was reported in 2010 RDHS (5.04%) and not living together interviewed women was reported in the 2014-15 RDHS (4.52%).
A high percentage of interviewed mothers with no education was reported in 2005 RDHS (28.34%), of mothers with primary education level was reported in the 2010 RDHS (71.66%), of mothers with secondary and higher education level was reported in the 2014-15 RDHS (10.54%), (2.04%) respectively.
In the 2005 RDHS, 27.19% of husband or partners of interviewed women had the primary education, whereas 71.12% had the Post-primary/CRAI/CERAR/familial education level in 2014-15 RDHS; 10.96% had the secondary education level in the 2005 RDHS; 3.18% had higher education in the 2014-15 RDHS.
The frequency of less than 4 ANC visits was high in the 2005 RDHS (53.82%) and that of 4 ANC visits and above was in the 2014-15 RDHS (57.56%).
The household wealth index results showed that a high percentage of poorest households in 2014-15 RDHS (24.19%), of poorer households was reported 2014-15 RDHS (21.7%), of middle income was reported in 2005 RDHS (20.48 %), of richer households was reported in 2005 (19.99 %) and of richest households was reported in 2005 RDHS (17.77 %).
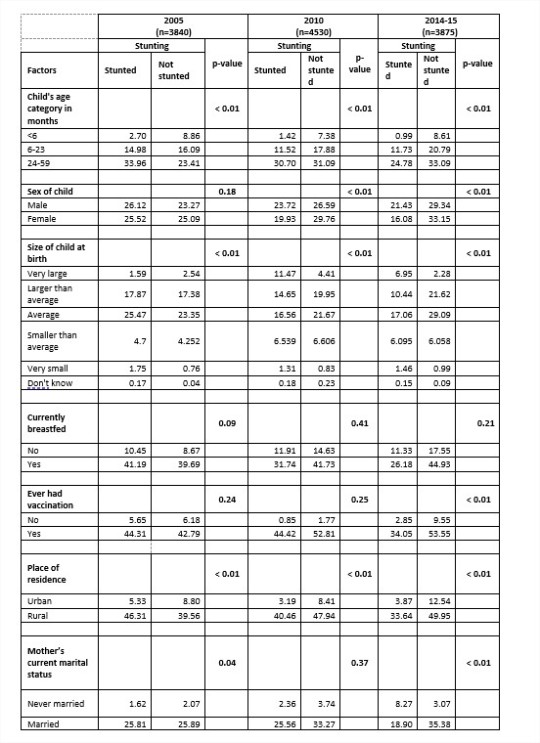
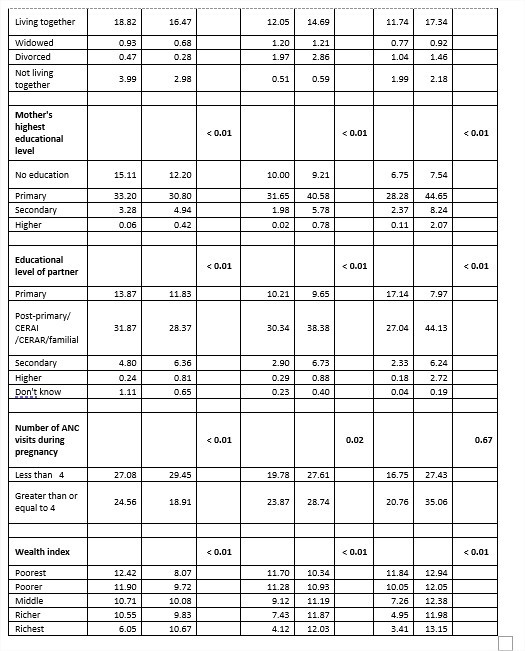
1.2. Bivariate analysis of stunting risk factors in the 2005, 2010 and 2014-15 RDHS.
Bivariate analysis was performed to find out associated factors with stunting among children under five years based on the three RDHS (2005, 2010 and 2014-15).
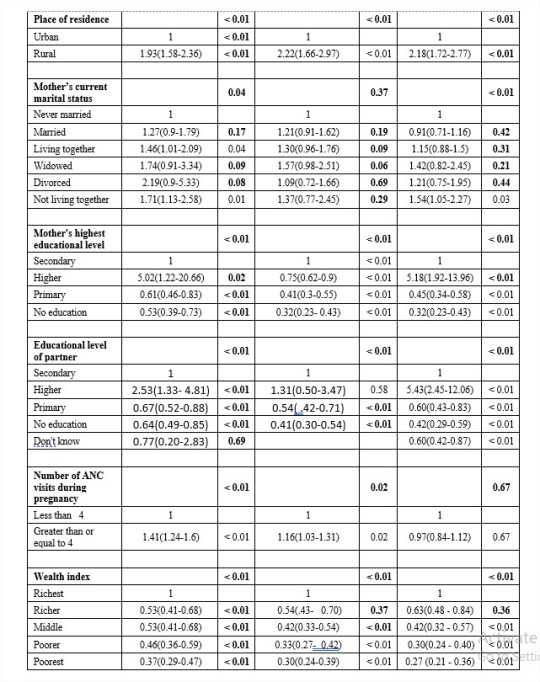
Table 3 shows eventual factors associated with stunting in Rwandan children under five in 2005, 2010 and 2014-15 RDHS. Visibly, in the 2005 RDHS, risk factors highly associated with stunting were Child's age (in months) (p-value < 0.01), Size of child at birth (p-value <0.001), Place of residence (p-value <0.01), Mother’s current marital status (p-value =0.04), Mother's highest educational level(p-value <0.01), Educational level of partner (p-value <0.01), Number of ANC visits during pregnancy (p-value <0.01) and the family income(p-value <0.01).
In the 2010 RDHS, risk factors highly associated with stunting were Child's age (in months) (p-value <0.01), Child’s sex (p-value <0.01), Size of child at birth (p-value <0.01), Place of residence (p-value <0.10), Mother's educational level (p-value <0.01), Educational level of partner (p-value < 0.01), Number of ANC visits during pregnancy (p-value =0.02) and the family income (Wealth index) (p-value < 0.01).
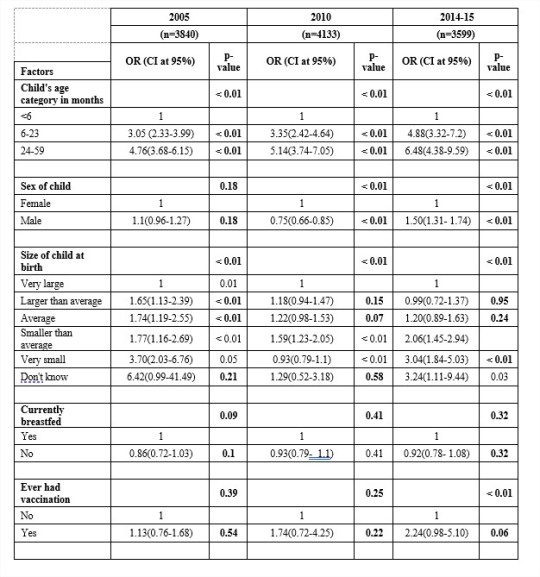
1.2. Multivariate analysis of stunting risk factors according to 2005, 2010 and 2014-15RDHS
The multivariate analysis helps find out the determinants of child stunting during the 2005, 2010 and 2014-15 RDHS. Table 4 presents the results on the determinants of child stunting during the above surveys.
Factors that influence stunting in children under five years of age have been highlighted in the three RDHS surveys as shown in the above table. The results show that, in the 2005 RDHS, children between 6 months (OR=3.05; CI= [2.33-3.99]) and 59 months (OR=4.76; CI= [3.68-6.15]) of age were all significantly more likely to be stunted than their counterparts. Child’s sex was also significant for predicting stunting in those children. Female children were less likely to be stunted than their counterparts ((OR=0.91; CI= [0.79-1.05]). The size of the child at birth was found as positively associated to stunting and those who were born very small (OR=3.7; CI= [2.03-6.76]) were found to be 3.7 times likely to be stunted than those born with a very large size. Rural children were 1.93 times to be stunted than urban children ((OR=1.93; CI= [1.58-2.36]).
Maternal education was significantly related to child stunting, and the results showed that children born from educated mothers were less likely to be stunted compared to those born from mothers without no education. A simple example was for mothers with primary education (OR=0.87; CI= [0.73-1.03]) compared to those with no education level. The same, partner’s education level was significantly related to child stunting, and the results showed that children born from educated fathers were less likely to be stunted compared to those born from fathers without no education. A simple example was for fathers with higher education (OR=0.25; CI= [0.14-0.46]) were 4 times less likely to have stunted children compared to those with no education level. The family income was found significantly associated to stunting (p-value < 0.001). A child born from a richest family is less likely to be stunted (OR=0.37, CI = [ 0.29-0.47]) compared to a child born from a poorest family.
Findings from the above results reveal that children between 6 and 23 months were more likely to be stunted (OR=1.18, CI= [0.89-1.56]) than those under 6 months. Children from rural areas were more likely to be stunted (OR=1.20, CI= [0.96-1.48]) compared to those from urban areas. Children from married mothers were less likely to be stunted (OR=0.5, CI = [0.35-0.60]) compared to those from never married mothers. Children from Mothers with secondary educational level were less likely to be stunted (OR=0.34, CI = [0.24-0.48]) than children from other education levels. The same case was for children from fathers with higher education level (OR=0.32, CI= [0.13-0.75]) than those with no educational level or primary or secondary level of education. Children under five from richest families were less likely to be stunted (OR=1.13, CI= [0.90-1.43]) than poorest, poorer, middle and richer families.
0 notes
Text
A comparative study on stunting in under five years children. A secondary data analysis of Rwanda demographic and health surveys of 2005, 2010 and 2014-2015.
1. Research questions
− Is there any statistical difference between the prevalence of stunting in 2005, 2010 and 2015?
− What are the associated factors with stunting in under five years children in Rwanda?
2. Rationale of the research
Good nutrition allows children to grow, develop, learn, play, participate and contribute (UNICEF, WHO and Group, 2017). The term malnutrition is an umbrella which includes both over-nutrition and under-nutrition(Castro, 2016) and addresses three broad groups of conditions: undernutrition, which includes wasting (low weight-for-height), stunting (low height-for-age) and underweight (low weight-for-age); micronutrient-related deficiency, which includes a lack of important vitamins and minerals or micronutrient excess; and overweight, obesity and diet-related non-communicable diseases (such as heart disease, stroke, diabetes and some cancers)(WHO, 2018a).
Until 2017, approximately 156 million of the world’s children under the age of 5 are stunted, with an estimated 80% of these children concentrated in only 14 countries.
Rwanda has experienced one of the fastest declines in stunting prevalence in the Eastern and Southern African region even if the prevalence of stunting remains high. This country also represents an opportunity to explore the effects of strong high-level political commitment and decentralized stunting reduction efforts (USAID, 2014). The Government of Rwanda demonstrated its commitment to improving nutrition through the institution of various national policies and initiatives.
The Ministry of Health (MOH) implemented the National Multisectoral Strategy to Eliminate Malnutrition (2010-2013) and a comprehensive joint action plan to fight malnutrition under the Office of the Prime Minister, which provides a common results framework for nutrition. Multisectoral nutrition committees were established at central and local levels, bringing together mayors, district directors of health, nutritionists, agronomists, and officers from social protection, veterinary, hygiene and sanitation sectors (USAID, 2014). The U.S. Government provided support for the implementation of the national nutrition strategy at the district level in 2012. A national multisectoral Food and Nutrition Policy and Strategic Plan for 2013-2018 was completed in October 2013 to guide the Government of Rwanda and development partners in the implementation of nutrition activities with a multisectoral approach to address stunting. The policy and the strategic plan is aligned with the Economic Development and Poverty Reduction Strategy (EDPRS II, 2013-2018) that aims to push Rwanda’s economic growth to a middle-income-status country by 2020, and a nutrition indicator was introduced in the EDPRS II to reduce the chronic malnutrition.
In September 2013, the Government of Rwanda, in conjunction with development partners launched a 1,000 days campaign to increase awareness of improved maternal, infant and young child feeding practices.
Stunting is still a danger to child survival and development by contributing to child mortality, morbidity, and disability, including impaired or non-optimal physical growth and cognitive development. An inadequate intake of proper nutrition for a longer period of time can lead to stunting in a child (Branca and Ferrari, 2002). The global nutrition community still increases its focus on stunting.
Country selection by UNICEF (2017) considered the range of country contexts where stunting is widely prevalent, giving attention to development settings and to contexts affected by fragility and humanitarian emergencies. Rwanda was selected as one of the two case study countries for the Eastern and Southern African region among the range of country contexts where stunting is widely prevalent. Its selection was due to the fact that it has experienced one of the fastest declines in stunting prevalence in the region although the prevalence of stunting remains high (UNICEF, 2017).
According to the Rwanda Demographic and Health Surveys, the prevalence of stunted children under five years decreased from 51% in 2005 to 38% in 2015. Rwanda has adopted its own development strategy via the Vision 2020 framework for development, which aims at transforming the country from a low-income agriculture-based economy to a knowledge-based, service-oriented economy with a middle-income country status by 2020. Since 2005, 13% reduction in stunting prevalence proved important improvements in Nutrition in Rwanda up to 2015.
Rwanda in its achievement of Millennium Development Goals (MDGs) targeted to reduce the stunting prevalence of children under five years to 24.5% by 2015 but unfortunately this was not met. On the path to reduce the stunting prevalence of those children, the Government of Rwanda decided to eliminate malnutrition by implementing the 1,000 Days nutrition campaign in 2013, with financial, technical, and implementation support from UNICEF (UNICEF, 2014). The campaign reached all 15,000 Villages in the country through social mobilization focusing on maternal and child nutrition and the role of men in the nutrition of women and children. MOH was mandated to coordinate the implementation of the multisectoral NSEM 2010–2013 and a comprehensive Joint Action Plan to fight malnutrition under the office of the President. The strategy had the following eight components (UNICEF, 2014):
1. Strengthen identification and management of undernutrition
2. Strengthen and scale up community-based nutrition programming (CBNP) to prevent and manage malnutrition in children under the age of 5 years, with focus on those aged less than 2 years, and in pregnant and lactating mothers
3. Elimination of micronutrient deficiencies
4. Multisectoral District Plans to Eliminate Malnutrition (DPEMs)
5. Prevention and management of nutritional deficiency and excess-related diseases
6. Behavior change communications
7. Coordination of nutrition partners
8. Monitoring and evaluation for nutrition activities at all levels.
The RDHS 2014-15 reported that many improvements have been made by the Government of Rwanda to reduce the stunting prevalence among children under five years of age before 2015 but the prevalence of malnutrition (stunting) was still high, and there was a need for more intensive interventions(NISR and MOH, 2016).
3. Potential implications
The purpose of this study is to compare statistically the stunting prevalence rates from the RDHS surveys over the last decade and to identify the common stunting determinants to look for a way forward. It is in this regard that results and suggestions from this study are intended to be used to inform public about the progress in achieving the stunting reduction in Rwanda; to bring to the attention of the Rwanda government and stakeholders (NGOs, private sector, and donors) in hunger and poverty reduction about the reinforcement of adequate interventions to reduce stunting in children under five years of age in Rwanda (SUN, 2015).
4. METHODS
4.1. Study area
The data for the three DHS studies were collected in Rwanda by National Institute of statistics of Rwanda (NISR) in collaboration with the worldwide Demographic and Health Surveys Program. The population of study was taken from the three Rwanda Demographic and Health Survey (RDHS) of 2005, 2010 and 2014-15.
4.2. Study design
Given that the aim of this work is to compare secondary data from three cross-sectional studies provided by the Rwanda Demographic and Health Surveys of 2005, 2010 and 2014-15, the study design for this dissertation must be a cross-sectional design.
4.3. Specific objectives achievement
The specific objectives of this study will be achieved as follows:
a) To compare the prevalence rates of stunting in Rwanda with data reported in the Rwanda Demographic and Health Surveys of 2005, 2010 and 2014-15, we will use datasets downloaded from the DHS Program website (https://dhsprogram.com/data/dataset_admin/index.cfm). These secondary data will be analyzed using SPSS version 21.0. Chi-square analysis and Marascuilo Procedure were used as statistical tests to compare the prevalence rates of stunting in children under five years as reported by the RDHS of 2005, 2010 and 2014-15.
b) To find out stunting determinants considered in the three RDHS surveys in question that have contributed to the change in the prevalence rate of stunting in Rwanda in the last decade, bivariate and multivariate logistic regression analyses will be performed.
4.4. Study variables
4.4.1. Dependent variable
The dependent variable for this study is stunting.
4.4.2. Independent variables
The independent variables for this study are the factors of stunting namely:
a) Socio-economic and demographic factors
b) Child caring practices
c) Child characteristics
d) Environmental Health condition
4.4.3. Analysis plan
The SPSS version 21.0 will be used to analyze the dataset from the DHS Program website. The chi-square test of independence will be used to determine the association between stunting and the explanatory variables to compare the prevalence rates of stunting in children under five years as reported by the RDHS of 2005, 2010 and 2014-15.
The identification of factors associated with stunting is performed using the binary logistic regression model and a systematic comparison of the three RDHS surveys reports will help in identifying the factors which remained constant and those which disappeared during the last decade from 2005 to 2015. In addition, we will set the significance level at 0.05 with a confidence level 95% for the confidence interval.
5.1. Study population
The subjects were all under-five years children completing the criteria considered by the RDHS 2005, 2010 and 2014-15.
5.1.1. Sample size calculation
The sample size for the 2005 RDHS was 3,859 children under five years of age who met the defined criteria. For the RDHS 2010, the sample size was 4,356 children under five years of age who were eligible to be measured for weight and height and had complete and valid anthropometric data collected. The sample size for the RDHS 2014-15 was 3,813 children under age 5 who were eligible to be measured for weight and height and who had complete and valid anthropometric data collected. All the samples of the three RDHS studies are covered 12028 eligible children under five years of age.
Frequency statistics were used to calculate the number of children and women under consideration that was found in the DHS datasets where the Individual Recode (IR) file contains Individual Women's Data and the Children's Recode (KR) contains the Children's Data(DHS, 2006, 2012, 2016). The Individual Women's dataset has one record for every eligible woman as defined by the household schedule. It contains all the data collected in the women's questionnaire plus some variables from the household. In this file, we can find records of up to 20 births in the birth history, and up to 6 children under age 5, for whom pregnancy and postnatal care as well as immunization and health data were collected. The unit of analysis (case) in this file is the woman.
The Children's Recode (KR) dataset has one record for every child of interviewed women, born in the five years preceding the survey. It contains the information related to the child's pregnancy and postnatal care and immunization and health. The data for the mother of each of these children is included. This file is used to look at child health indicators such as immunization coverage, vitamin A supplementation, and recent occurrences of diarrhea, fever, and cough for young children and treatment of childhood diseases. The unit of analysis (case) in this file is the children of women born in the last 5 years (0-59 months).
5.1.2. Sampling techniques
The target population for this study is all children under five years of age living in residential households as defined by the DHS Program (ICF International, 2012). Every individual of the target population should have a chance to be selected to prevent bias. A sampling frame is designed by dressing a list of enumeration areas (EA) with measures of size (population and/or households) covering the entire population from which the study sample is drawn. The sampling frame in DHS surveys provides a complete list of clusters.
After designing a sampling frame, the next step is to design a sample stratification. This is a process of grouping the enumeration areas into homogeneous subgroups (e.g., urban/rural) before sampling. The late step allows flexible design and a representative sample to be drawn for each stratum or subgroup.
5.1.3. Data collection procedures
Data collection procedures for this study follow the ones for the DHS surveys. Each DHS Program survey collects data in four phases: (1) Survey Preparation and Questionnaire Design: This is the first step involving sample design and survey questionnaires development to meet specific host-country needs. (2) Training and Fieldwork: This is the second stage involving training field staff and conducting fieldwork. It is in this stage to identify eligible households and interview individual respondents. Several teams composed of interviewers, field editors and team leaders carried out the fieldwork. (3) Data Processing: This is the third stage involving data processing (editing, coding, and entering and verifying the data) as well as checking them for consistency. Data entry and editing take place at the same time with data collection. Preliminary results are rolled out one month after the end of data collection and the data processing allows for quality control of the data collected. (4) Final Report, Data Preparation and Dissemination: This is the final stage involving the analysis of the data, preparation of the final report, and dissemination of the survey results in country where the survey is conducted, and usually begins following the completion of fieldwork (DHS, 2018b).
5.2. Materials
Rwanda Demographic and Health Surveys collect data using different tools and techniques, namely questionnaires (Household questionnaires, Woman’s questionnaires, Man’s questionnaires), anthropometry (Height and weight for women, men, and children), and Biomarker testing (Anemia, HIV, and Malaria testing).
In the RDHS-2005, three questionnaires were used namely the Household Questionnaire, the Women’s Questionnaire, and the Men’s Questionnaire. Their content was based on model questionnaires developed by the MEASURE DHS project (DHS, 2018a). These questionnaires were translated from English into Kinyarwanda (NISR, 2015).
In addition to questionnaires, the three considered RDHS included anthropometric components in which children under age 5 in a subsample were measured for height and weight. A lightweight electronic SECA scale designed and manufactured under the guidance of the United Nations Children’s Fund (UNICEF) was used for weight measurements. That scale allowed for the weighing of very young children through an automatic mother-child adjustment that eliminated the mother’s weight while she was standing on the scale with her baby. A Shorr measuring board produced under the guidance of UNICEF was used for height measurements. Two types of height measurements were used: recumbent length where children younger than age 24 months were measured lying down on the board was used, and older children were measured using the standing height method. These measurements were used to determine the three internationally accepted indices (Height-for-age [stunting], Weight-for-height [wasting], Weight-for-age [underweight] and to reflect the nutritional status of children.
1 note
·
View note