
Don't wanna be here? Send us removal request.
Statistics
We looked inside some of the posts by assigmentweek2 and here's what we found interesting.
Average Info
Notes Per Post
0
Likes Per Post
0
Reblog Per Post
0
Reply Per Post
0
Time Between Posts
6 days
Number of Posts By Type
Text
3
Last Seen Tumblr Blogs


Fun Fact
Tumblr.com is the 103rd most visited website in the world.
Text
AssignmentWeek4
My coding below:
-- coding: Following assignment on Coursera --
""" Spyder Editor
This is a temporary script file. """
-- coding: utf-8 --
""" Created on Mon May 13 08:30:00 GMT +7, 2024
@author: D.T.Long """
reset all
clear all variables in the memory
import pandas import numpy
Import library to plot
import seaborn import matplotlib.pyplot as plt
any additional libraries would be imported here
Hypothesis
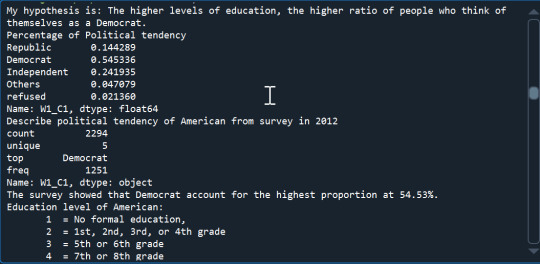
print('My hypothesis is: The higher levels of education, the higher ratio of people who think of themselves as a Democrat.')
Read csv file
data=pandas.read_csv('OOL survey.csv', low_memory=False)
#
Assigment Week4
Prepare data for univariate graph
data1 = data.copy() data1['W1_C1']=data1['W1_C1'].replace(1,'Republic') data1['W1_C1']=data1['W1_C1'].replace(2,'Democrat') data1['W1_C1']=data1['W1_C1'].replace(3,'Independent') data1['W1_C1']=data1['W1_C1'].replace(4,'Others') data1['W1_C1']=data1['W1_C1'].replace(-1,'refused')
Plot the frequency of Republic, Democrat,…
seaborn.countplot(x='W1_C1', data=data1) plt.xlabel('Political tendency') plt.ylabel('Count') plt.title('Political tendency of American from survey in 2012')
Percentage of Political tendency
print("Percentage of Political tendency") p8= data1['W1_C1'].value_counts(sort=False, normalize=True) print(p8)
Describe category variable
print ('Describe political tendency of American from survey in 2012') desc1 = data1['W1_C1'].describe() print (desc1)
print("The survey showed that Democrat account for the highest proportion at 54.53%.")
Plot the Education level of American
print("""Education level of American: 1 = No formal education, 2 = 1st, 2nd, 3rd, or 4th grade 3 = 5th or 6th grade 4 = 7th or 8th grade 5 = 9th grade 6 = 10th grade 7 = 11th grade 8 = 12th grade NO DIPLOMA 9 = HIGH SCHOOL GRADUATE - high school DIPLOMA or the equivalent (GED) 10 = Some college, no degree 11 = Associate degree 12 = Bachelors degree 13 = Master degree 14 = Professional or Doctorate degree """) seaborn.countplot(x='PPEDUC', data=data1) plt.xlabel('Education level') plt.ylabel('Count') plt.title('Education level of American from survey in 2012')
Percentage of Education level of America
print("Percentage of Education level of America") pt4 = data.groupby('PPEDUC').size()/len(data) print(pt4)
Change format type from numeric to category
data1['PPEDUC'] = data1['PPEDUC'].astype('category')
Describe Education level of America
print ('Describe political tendency of American from survey in 2012') desc2 = data1['PPEDUC'].describe() print (desc2)
print("The survey showed that the American with HIGH SCHOOL GRADUATE account for the highest proportion at 30.5%.")
Collapse Education level in 4 subgroup
data2 = data.copy() data2 ['PPEDUC'] = pandas.cut(data2.PPEDUC, [0, 8, 10, 13, 14])
Convert into category variable
data2 ['PPEDUC'] = data2 ['PPEDUC'].astype('category')
Rename categories
data2 ['PPEDUC'] = data2 ['PPEDUC'].cat.rename_categories(['Under HS GRADUATE','HS GRADUATE','Degrees','Doctorate'])
Plot Education level in 4 subgroup
seaborn.countplot(x='PPEDUC', data=data2) plt.xlabel('Education level') plt.ylabel('Count') plt.title('Education level of American from survey in 2012 (collapse in 4 subgroups)')
print("Percentage for Education level (in 4 subgroups)") p8= data2['PPEDUC'].value_counts(sort=False, normalize=True, dropna=False) print(p8) print("The survey showed that the American with HIGH SCHOOL GRADUATE account for the highest proportion at 51.87%.")
Conver to numberic
data2['W1_C1']=pandas.to_numeric(data2['W1_C1'])
Create Democrat variable: 1 = Democrate, 0 = others
def DEMOCRAT (row): if row['W1_C1'] ==2: return 1 elif row['W1_C1'] !=2: return 0 data2['DEMOCRAT'] = data2.apply(lambda row: DEMOCRAT (row),axis=1)
c9= data2.groupby('DEMOCRAT').size() print (c9)
Plot Proportion Democrat following Education level
seaborn.catplot(x='PPEDUC', y='DEMOCRAT', data=data2, kind="bar", ci=None) plt.xlabel('Education level') plt.ylabel('Proportion Democrat') plt.title('Proportion Democrat following Education level') print("""The chart showed that the hypothesis: 'The higher levels of education, the higher ratio of people who think of themselves as a Democrat' is WRONG """)
The outcome of coding:


0 notes
Text
Assignment Week 3:
-- coding: Following assignment on Coursera --
""" Spyder Editor
This is a temporary script file. """
-- coding: utf-8 --
""" Created on Mon May 13 08:30:00 GMT +7, 2024
@author: D.T.Long """
reset all
clear all variables in the memory
import pandas import numpy
any additional libraries would be imported here
Hypothesis
print('My hypothesis is: The higher levels of education, the higher ratio of people who think of themselves as a Democrat.')
Read csv file
data=pandas.read_csv('OOL survey.csv', low_memory=False)
Check the population size and variables
print('Population size:',len(data)) print('Number of variables:',len(data.columns)) print ("Frequency distribution of Democrat, Republican,…. 1=Republic, 2=Democrat, 3=Independent, 4=Others, -1=refused") c1 = data['W1_C1'].value_counts(sort=False) print(c1)
print("Percentage of Republican, Democrat….") p1= data['W1_C1'].value_counts(sort=False, normalize=True) print(p1)
print ("""Counts number of Education (Highest Degree Received): 1 = No formal education, 2 = 1st, 2nd, 3rd, or 4th grade 3 = 5th or 6th grade 4 = 7th or 8th grade 5 = 9th grade 6 = 10th grade 7 = 11th grade 8 = 12th grade NO DIPLOMA 9 = HIGH SCHOOL GRADUATE - high school DIPLOMA or the equivalent (GED) 10 = Some college, no degree 11 = Associate degree 12 = Bachelors degree 13 = Master degree 14 = Professional or Doctorate degree """)
'''# Another way to visualize the Frequency of variables c4 = data['PPEDUC'].value_counts(sort=False) print(c4) '''
ct4 = data.groupby('PPEDUC').size() print(ct4)
'''Another way to visualize the Percentage of variables not following categories print("percentage of Highest Degree Received") p4= data['PPEDUC'].value_counts(sort=False, normalize=True) print(p4)
W3-I: Create subset of Democrat and Education
print("Create subgroup of Democrat and Education") sub3 = data[(data['W1_C1']==2)] sub4 = sub3[['W1_C1','W1_C1B','W1_C1C','PPEDUC']] sub5 = sub4.copy()
Convert Democrat level to numeric
sub5['W1_C1B'] = pandas.to_numeric(sub5['W1_C1B'])
Replace blank and -1 (refuse) to python missing (NaN)
sub5['W1_C1B']=sub5['W1_C1B'].replace(-1, numpy.nan) sub5['W1_C1C']=sub5['W1_C1C'].replace(r'^\s*$', numpy.nan, regex=True)
Check 10 first row'
'sub5.head(10)
Check the population and variables size of sub5 data
print('Population size of subset:',len(sub5)) print('Number of variables of subset:',len(sub5.columns))
Frequency distribution for Democrat level
print ("Frequency distribution for Democrat level: 1.0 = Strong, 2.0 = Not very strong, NaN = Missing data") c5 = sub5['W1_C1B'].value_counts(sort=False, dropna = False) print(c5)
Percentage for Democrat level
print("Percentage for Democrat level") p5= sub5['W1_C1B'].value_counts(sort=False, normalize=True, dropna=False) print(p5)
Frequency distribution for closer to Democratic Party
print ("""Frequency distribution of Democrat closer to Democratic Party: 1.0 = Closer to the Republician Party 2.0 = Closer to the Democratic Party 3.0 = Neither closer to the Democratic Party nor Republician Party NaN = Missing data """) c6 = sub5['W1_C1C'].value_counts(sort=False, dropna=False) print(c6)
Percentage for closer to Democratic Party
print("Percentage of closer to Democratic Party") p6= sub5['W1_C1C'].value_counts(sort=False, normalize=True, dropna=False) print(p6)
W3-II: Analyse Democrat with Education
print ("""Counts number of Education (Highest Degree Received): 1 = No formal education, 2 = 1st, 2nd, 3rd, or 4th grade 3 = 5th or 6th grade 4 = 7th or 8th grade 5 = 9th grade 6 = 10th grade 7 = 11th grade 8 = 12th grade NO DIPLOMA 9 = HIGH SCHOOL GRADUATE - high school DIPLOMA or the equivalent (GED) 10 = Some college, no degree 11 = Associate degree 12 = Bachelors degree 13 = Master degree 14 = Professional or Doctorate degree """)
Frequency distribution for Democrat with education
ct7 = sub5.groupby('PPEDUC').size() print(ct7)
Percentage for Democrat with education
pt7 = sub5.groupby('PPEDUC').size()/len(data) print(pt7)
print("""My comment: I created subset of Democrat and Education. For Democrats, they almost said that they are strong Democratic with 65.39%; but there is no evidences to confirm the Democrat are closer to Democratic Party (NaN: 100%). The Democrats with HIGH SCHOOL GRADUATE (9) and Some college (10) account for the highest proportion at 29.42%. """)
End of Assignment Week3
The output of my program:


0 notes
Text
Assignment_Week2:
My code in Spider (Python 3.9) below:
-- coding: Following assignment on Coursera --
""" Spyder Editor
This is a temporary script file. """
-- coding: utf-8 --
""" Created on Mon May 13 08:30:00 GMT +7, 2024
@author: D.T.Long """
reset all
clear all variables in the memory
import pandas import numpy
any additional libraries would be imported here
Hypothesis
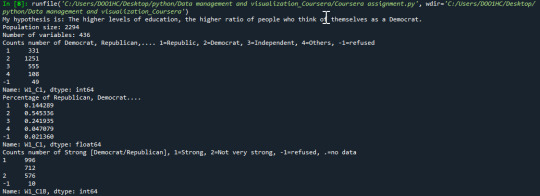
print('My hypothesis is: The higher levels of education, the higher ratio of people who think of themselves as a Democrat.')
Read csv file
data=pandas.read_csv('OOL survey.csv', low_memory=False)
Check the population size and variables
print('Population size:',len(data)) print('Number of variables:',len(data.columns)) print ("Counts number of Democrat, Republican,…. 1=Republic, 2=Democrat, 3=Independent, 4=Others, -1=refused") c1 = data['W1_C1'].value_counts(sort=False) print(c1)
print("Percentage of Republican, Democrat….") p1= data['W1_C1'].value_counts(sort=False, normalize=True) print(p1)
print ("Counts number of Strong [Democrat/Republican], 1=Strong, 2=Not very strong, -1=refused, .=no data") c2 = data['W1_C1B'].value_counts(sort=False) print(c2)
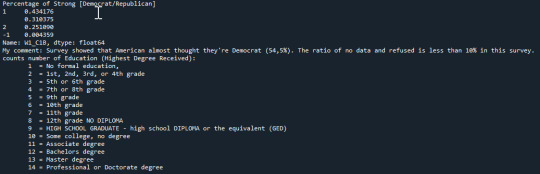
print("Percentage of Strong [Democrat/Republican]") p2= data['W1_C1B'].value_counts(sort=False, normalize=True) print(p2)
Comment about the percentage of Democrat/Republican and Strong [Democrat/Repulician]
print("My comment: Survey showed that American almost thought they're Democrat (54,5%). The ratio of no data and refused is less than 10% in this survey.")
'''No need at this moment print ("counts number of closer to Democratic/Republican party, 1=Closer to Republic, 2=Closer to Democratic party, 3=Neither, -1=refused, .=no data") c3 = data['W1_C1C'].value_counts(sort=False) print(c3)
print("percentage of closer to Democratic/Republican party, 1=Closer to Republic, 2=Closer to Democratic party, 3=Neither, -1=refused, .=no data") p3= data['W1_C1C'].value_counts(sort=False, normalize=True) print(p3) '''
print ("""counts number of Education (Highest Degree Received): 1 = No formal education, 2 = 1st, 2nd, 3rd, or 4th grade 3 = 5th or 6th grade 4 = 7th or 8th grade 5 = 9th grade 6 = 10th grade 7 = 11th grade 8 = 12th grade NO DIPLOMA 9 = HIGH SCHOOL GRADUATE - high school DIPLOMA or the equivalent (GED) 10 = Some college, no degree 11 = Associate degree 12 = Bachelors degree 13 = Master degree 14 = Professional or Doctorate degree """)
'''# Another way to visualize the Frequency of variables c4 = data['PPEDUC'].value_counts(sort=False) print(c4) '''
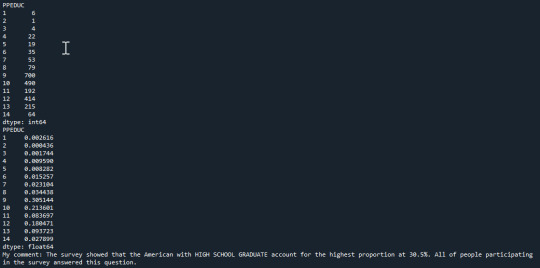
ct4 = data.groupby('PPEDUC').size() print(ct4)
'''Another way to visualize the Percentage of variables not following categories print("percentage of Highest Degree Received") p4= data['PPEDUC'].value_counts(sort=False, normalize=True) print(p4) ''' pt4 = data.groupby('PPEDUC').size()/len(data) print(pt4)
Comment about the result
print("My comment: The survey showed that the American with HIGH SCHOOL GRADUATE account for the highest proportion at 30.5%.", "All of people participating in the survey answered this question." )
End of assignment in Week2
Output of my program:
0 notes