
Don't wanna be here? Send us removal request.
Statistics
We looked inside some of the posts by berninezer and here's what we found interesting.
Average Info
Notes Per Post
1
Likes Per Post
1
Reblog Per Post
0
Reply Per Post
0
Time Between Posts
2 days
Number of Posts By Type
Text
4
Last Seen Tumblr Blogs


Fun Fact
The most popular pages on Tumblr are about Minecraft, GIFs, and David J. Peterson.
Text
Output
This graph is unimodal, with its highest pick at 0-20% of breast cancer rate. It seems to be skewed to the right as there are higher frequencies in lower categories than the higher categories.

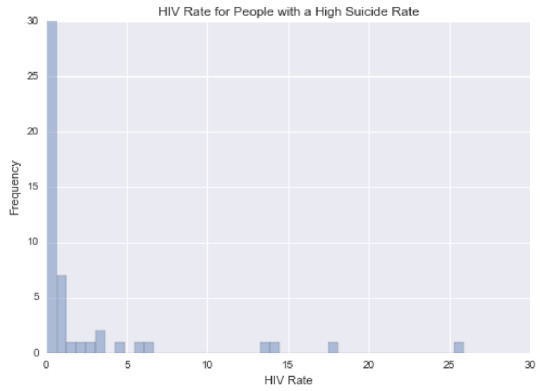
This graph is unimodal, with its highest pick at 0-1% of HIV rate. It seems to be skewed to the right as there are higher frequencies in lower categories than the higher categories.
This graph is unimodal, with its highest pick at the median of 55-60% employment rate. It seems to be a symmetric distribution as there are lower frequencies in lower and higher categories.

This graph plots the breast cancer rate vs. HIV rate for people with a high suicide rate. It shows that people with breast cancer are not infected with HIV.

Python Program
import pandas as pd import numpy as np import seaborn as sb import matplotlib.pyplot as plt
load gapminder dataset
data = pd.read_csv('gapminder.csv',low_memory=False)
lower-case all DataFrame column names
data.columns = map(str.lower, data.columns)
bug fix for display formats to avoid run time errors
pd.set_option('display.float_format', lambda x:'%f'%x)
setting variables to be numeric
data['suicideper100th'] = data['suicideper100th'].convert_objects(convert_numeric=True) data['breastcancerper100th'] = data['breastcancerper100th'].convert_objects(convert_numeric=True) data['hivrate'] = data['hivrate'].convert_objects(convert_numeric=True) data['employrate'] = data['employrate'].convert_objects(convert_numeric=True)
display summary statistics about the data
print("Statistics for a Suicide Rate")
print(data['suicideper100th'].describe())
subset data for a high suicide rate based on summary statistics
sub = data[(data['suicideper100th']>12)]
make a copy of my new subsetted data
sub_copy = sub.copy()
Univariate graph for breast cancer rate for people with a high suicide rate
plt.figure(1) sb.distplot(sub_copy["breastcancerper100th"].dropna(),kde=False) plt.xlabel('Breast Cancer Rate') plt.ylabel('Frequency') plt.title('Breast Cancer Rate for People with a High Suicide Rate')
Univariate graph for hiv rate for people with a high suicide rate
plt.figure(2) sb.distplot(sub_copy["hivrate"].dropna(),kde=False) plt.xlabel('HIV Rate') plt.ylabel('Frequency') plt.title('HIV Rate for People with a High Suicide Rate')
Univariate graph for employment rate for people with a high suicide rate
plt.figure(3) sb.distplot(sub_copy["employrate"].dropna(),kde=False) plt.xlabel('Employment Rate') plt.ylabel('Frequency') plt.title('Employment Rate for People with a High Suicide Rate')
Bivariate graph for association of breast cancer rate with HIV rate for people with a high suicide rate
plt.figure(4) sb.regplot(x="hivrate",y="breastcancerper100th",fit_reg=False,data=sub_copy) plt.xlabel('HIV Rate') plt.ylabel('Breast Cancer Rate') plt.title('Breast Cancer Rate vs. HIV Rate for People with a High Suicide Rate')
0 notes
Text
Assignment 3
Output with Frequency Tables at High Suicide Rate for Breast Cancer Rate, HIV Rate and Employment Rate Variables
Statistics for a Suicide Rate count 191.000000 mean 9.640839 std 6.300178 min 0.201449 25% 4.988449 50% 8.262893 75% 12.328551 max 35.752872
Number of Breast Cancer Cases with a High Suicide Rate
of Cases Freq. Percent Cum. Freq. Cum. Percent
(1, 23] 18 33.96 18 33.96 (23, 46] 15 28.30 33 62.26 (46, 69] 10 18.87 43 81.13 (69, 92] 8 15.09 51 96.23 nan 2 3.77 53 100.00
HIV Rate with a High Suicide Rate Rate Freq. Percent Cum. Freq. Cum. Percent 0% tile 18 33.96 18 33.96 25% tile 8 15.09 26 49.06 50% tile 11 20.75 37 69.81 75% tile 12 22.64 49 92.45 nan 4 7.55 53 100.00
Employment Rate with a High Suicide Rate Rate Freq. Percent Cum. Freq. Cum. Percent 1 10 18.87 10 18.87 2 24 45.28 34 64.15 3 5 9.43 39 73.58 4 13 24.53 52 98.11 5 1 1.89 53 100.00
Summary of Frequency Distributions
I grouped the breast cancer rate, HIV rate and employment rate variables to create three new variables: bcgroup4, hcgroup4 and ecgroup4 using three different methods in Python. The grouped data also includes the count for missing data.
1) For the breast cancer rate, I grouped the data into 4 groups by number of breast cancer cases (1-23, 24-46, 47-69, 70-92) using pandas.cut function. People with lower breast cancer rate experience a high suicide rate. 2) For the HIV rate, I grouped the data into 4 groups by quartile pandas.qcut function. People with lower HIV rate experience a high suicide rate. 3) For the employment rate, I grouped the data into 5 categorical groups using def and apply functions: (1:32-50, 2:51-58, 3:59-64, 4:65-83, 5:NAN). The employment rate is between 51%-58% for people with a high suicide rate.
Python Program
import pandas as pd
load gapminder dataset
data = pd.read_csv('gapminder.csv',low_memory=False)
lower-case all DataFrame column names
data.columns = map(str.lower, data.columns)
bug fix for display formats to avoid run time errors
pd.set_option('display.float_format', lambda x:'%f'%x)
setting variables to be numeric
data['suicideper100th'] = data['suicideper100th'].convert_objects(convert_numeric=True) data['breastcancerper100th'] = data['breastcancerper100th'].convert_objects(convert_numeric=True) data['hivrate'] = data['hivrate'].convert_objects(convert_numeric=True) data['employrate'] = data['employrate'].convert_objects(convert_numeric=True)
display summary statistics about the data
print("Statistics for a Suicide Rate") print(data['suicideper100th'].describe())
subset data for a high suicide rate based on summary statistics
sub = data[(data['suicideper100th']>12)]
make a copy of my new subsetted data
sub_copy = sub.copy()
BREAST CANCER RATE
frequency and percentage distritions for a number of breast cancer cases with a high suicide rate
include the count of missing data and group the variables in 4 groups by number of
breast cancer cases (1-23, 24-46, 47-69, 70-92)
bc_max=sub_copy['breastcancerper100th'].max() # maximum of breast cancer cases
group the data in 4 groups by number of breast cancer cases and record it into new variable bcgroup4
sub_copy['bcgroup4']=pd.cut(sub_copy.breastcancerper100th,[0bc_max,0.25bc_max,0.5bc_max,0.75bc_max,1*bc_max])
frequency for 4 groups of breast cancer cases with a high suicide rate
bc=sub_copy['bcgroup4'].value_counts(sort=False,dropna=False)
percentage for 4 groups of breast cancer cases with a high suicide rate
pbc=sub_copy['bcgroup4'].value_counts(sort=False,dropna=False,normalize=True)*100
cumulative frequency and cumulative percentage for 4 groups of breast cancer cases with a high suicide rate
bc1=[] # Cumulative Frequency pbc1=[] # Cumulative Percentage cf=0 cp=0 for freq in bc: cf=cf+freq bc1.append(cf) pf=cf*100/len(sub_copy) pbc1.append(pf)
print('Number of Breast Cancer Cases with a High Suicide Rate') fmt1 = '%10s %9s %9s %12s %13s' fmt2 = '%9s %9.d %10.2f %9.d %13.2f' print(fmt1 % ('# of Cases','Freq.','Percent','Cum. Freq.','Cum. Percent')) for i, (key, var1, var2, var3, var4) in enumerate(zip(bc.keys(),bc,pbc,bc1,pbc1)): print(fmt2 % (key, var1, var2, var3, var4))
HIV RATE
frequency and percentage distritions for HIV rate with a high suicide rate
include the count of missing data and group the variables in 4 groups by quartile function
group the data in 4 groups and record it into new variable hcgroup4
sub_copy['hcgroup4']=pd.qcut(sub_copy.hivrate,4,labels=["0% tile","25% tile","50% tile","75% tile"])
frequency for 4 groups of HIV rate with a high suicide rate
hc = sub_copy['hcgroup4'].value_counts(sort=False,dropna=False)
percentage for 4 groups of HIV rate with a high suicide rate
phc = sub_copy['hcgroup4'].value_counts(sort=False,dropna=False,normalize=True)*100
cumulative frequency and cumulative percentage for 4 groups of HIV rate with a high suicide rate
hc1=[] # Cumulative Frequency phc1=[] # Cumulative Percentage cf=0 cp=0 for freq in hc: cf=cf+freq hc1.append(cf) pf=cf*100/len(sub_copy) phc1.append(pf)
print('HIV Rate with a High Suicide Rate') print(fmt1 % ('Rate','Freq.','Percent','Cum. Freq.','Cum. Percent')) for i, (key, var1, var2, var3, var4) in enumerate(zip(hc.keys(),hc,phc,hc1,phc1)): print(fmt2 % (key, var1, var2, var3, var4))
EMPLOYMENT RATE
frequency and percentage distritions for employment rate with a high suicide rate
include the count of missing data and group the variables in 5 groups by
group the data in 5 groups and record it into new variable ecgroup4
def ecgroup4 (row): if row['employrate'] >= 32 and row['employrate'] < 51: return 1 elif row['employrate'] >= 51 and row['employrate'] < 59: return 2 elif row['employrate'] >= 59 and row['employrate'] < 65: return 3 elif row['employrate'] >= 65 and row['employrate'] < 84: return 4 else: return 5 # record for NAN values
sub_copy['ecgroup4'] = sub_copy.apply(lambda row: ecgroup4 (row), axis=1)
frequency for 5 groups of employment rate with a high suicide rate
ec = sub_copy['ecgroup4'].value_counts(sort=False,dropna=False)
percentage for 5 groups of employment rate with a high suicide rate
pec = sub_copy['ecgroup4'].value_counts(sort=False,dropna=False,normalize=True)*100
cumulative frequency and cumulative percentage for 5 groups of employment rate with a high suicide rate
ec1=[] # Cumulative Frequency pec1=[] # Cumulative Percentage cf=0 cp=0 for freq in ec: cf=cf+freq ec1.append(cf) pf=cf*100/len(sub_copy) pec1.append(pf)
print('Employment Rate with a High Suicide Rate') print(fmt1 % ('Rate','Freq.','Percent','Cum. Freq.','Cum. Percent')) for i, (key, var1, var2, var3, var4) in enumerate(zip(ec.keys(),ec,pec,ec1,pec1)): print(fmt2 % (key, var1, var2, var3, var4))
0 notes
Text
Assignment 2
Output with Frequency Tables at High Suicide Rate for Breast Cancer Rate, HIV Rate and Employment Rate Variables
Statistics for a Suicide Rate count 191.000000 mean 9.640839 std 6.300178 min 0.201449 25% 4.988449 50% 8.262893 75% 12.328551 max 35.752872
Number of Breast Cancer Cases with a High Suicide Rate
of Cases Freq. Percent Cum. Freq. Cum. Percent
6.51 6 11.32 6 11.32 15.14 14 26.42 20 37.74 23.68 5 9.43 25 47.17 32.22 7 13.21 32 60.38 40.76 2 3.77 34 64.15 49.30 4 7.55 38 71.70 57.84 5 9.43 43 81.13 66.38 1 1.89 44 83.02 74.92 3 5.66 47 88.68 83.46 4 7.55 51 96.23 NA 2 3.77 53 100.00 HIV Rate with a High Suicide Rate Rate Freq. Percent Cum. Freq. Cum. Percent 0.03 39 73.58 6 11.32 2.64 4 7.55 20 37.74 5.23 2 3.77 25 47.17 7.81 0 0.00 32 60.38 10.40 0 0.00 34 64.15 12.98 2 3.77 38 71.70 15.56 1 1.89 43 81.13 18.15 0 0.00 44 83.02 20.73 0 0.00 47 88.68 23.32 1 1.89 51 96.23 NA 2 3.77 53 100.00
Employment Rate with a High Suicide Rate Rate Freq. Percent Cum. Freq. Cum. Percent 37.35 2 3.77 6 11.32 41.98 2 3.77 20 37.74 46.56 7 13.21 25 47.17 51.14 8 15.09 32 60.38 55.72 16 30.19 34 64.15 60.30 4 7.55 38 71.70 64.88 5 9.43 43 81.13 69.46 2 3.77 44 83.02 74.04 3 5.66 47 88.68 78.62 3 5.66 51 96.23 NA 2 3.77 53 100.00
Summary of Frequency Distributions
Question 1: What is a number of breast cancer cases associated with a high suicide rate? The high suicide rate is associated with the low number of breast cancer cases.
Question 2: How HIV rate is associated with a high suicide rate? The high suicide rate is associated with the low HIV rate.
Question 3: How employment rate is associated with a high suicide rate? The high suicide rate occurs at 55% of employment rate.
Python
import pandas as pd import numpy as np
load gapminder dataset
data = pd.read_csv('gapminder.csv',low_memory=False)
lower-case all DataFrame column names
data.columns = map(str.lower, data.columns)
bug fix for display formats to avoid run time errors
pd.set_option('display.float_format', lambda x:'%f'%x)
setting variables to be numeric
data['suicideper100th'] = data['suicideper100th'].convert_objects(convert_numeric=True) data['breastcancerper100th'] = data['breastcancerper100th'].convert_objects(convert_numeric=True) data['hivrate'] = data['hivrate'].convert_objects(convert_numeric=True) data['employrate'] = data['employrate'].convert_objects(convert_numeric=True)
display summary statistics about the data
print("Statistics for a Suicide Rate") print(data['suicideper100th'].describe())
subset data for a high suicide rate based on summary statistics
sub = data[(data['suicideper100th']>12)]
make a copy of my new subsetted data
sub_copy = sub.copy()
BREAST CANCER RATE
frequency and percentage distritions for a number of breast cancer cases with a high suicide rate
print('frequency for a number of breast cancer cases with a high suicide rate')
bc = sub_copy['breastcancerper100th'].value_counts(sort=False,bins=10)
print(bc)
print('percentage for a number of breast cancer cases with a high suicide rate')
pbc = sub_copy['breastcancerper100th'].value_counts(sort=False,bins=10,normalize=True)*100
print(pbc)
cumulative frequency and cumulative percentage for a number of breast cancer cases with a high suicide rate
bc1=[] # Cumulative Frequency pbc1=[] # Cumulative Percentage cf=0 cp=0 for freq in bc: cf=cf+freq bc1.append(cf) pf=cf*100/len(sub_copy) pbc1.append(pf)
print('cumulative frequency for a number of breast cancer cases with a high suicide rate')
print(bc1)
print('cumulative percentage for a number of breast cancer cases with a high suicide rate')
print(pbc1)
print('Number of Breast Cancer Cases with a High Suicide Rate') fmt1 = '%s %7s %9s %12s %12s' fmt2 = '%5.2f %10.d %10.2f %10.d %12.2f' print(fmt1 % ('# of Cases','Freq.','Percent','Cum. Freq.','Cum. Percent')) for i, (key, var1, var2, var3, var4) in enumerate(zip(bc.keys(),bc,pbc,bc1,pbc1)): print(fmt2 % (key, var1, var2, var3, var4)) fmt3 = '%5s %10s %10s %10s %12s' print(fmt3 % ('NA', '2', '3.77', '53', '100.00'))
HIV RATE
frequency and percentage distritions for HIV rate with a high suicide rate
print('frequency for HIV rate with a high suicide rate')
hc = sub_copy['hivrate'].value_counts(sort=False,bins=7)
print(hc)
print('percentage for HIV rate with a high suicide rate')
phc = sub_copy['hivrate'].value_counts(sort=False,bins=7,normalize=True)*100
print(phc)
cumulative frequency and cumulative percentage for HIV rate with a high suicide rate
hc1=[] # Cumulative Frequency phc1=[] # Cumulative Percentage cf=0 cp=0 for freq in bc: cf=cf+freq hc1.append(cf) pf=cf*100/len(sub_copy) phc1.append(pf)
print('cumulative frequency for HIV rate with a high suicide rate')
print(hc1)
print('cumulative percentage for HIV rate with a high suicide rate')
print(phc1)
print('HIV Rate with a High Suicide Rate') fmt1 = '%5s %12s %9s %12s %12s' fmt2 = '%5.2f %10.d %10.2f %10.d %12.2f' print(fmt1 % ('Rate','Freq.','Percent','Cum. Freq.','Cum. Percent')) for i, (key, var1, var2, var3, var4) in enumerate(zip(hc.keys(),hc,phc,hc1,phc1)): print(fmt2 % (key, var1, var2, var3, var4)) fmt3 = '%5s %10s %10s %10s %12s' print(fmt3 % ('NA', '2', '3.77', '53', '100.00'))
EMPLOYMENT RATE
frequency and percentage distritions for employment rate with a high suicide rate
print('frequency for employment rate with a high suicide rate')
ec = sub_copy['employrate'].value_counts(sort=False,bins=10)
print(ec)
print('percentage for employment rate with a high suicide rate')
pec = sub_copy['employrate'].value_counts(sort=False,bins=10,normalize=True)*100
print(pec)
cumulative frequency and cumulative percentage for employment rate with a high suicide rate
ec1=[] # Cumulative Frequency pec1=[] # Cumulative Percentage cf=0 cp=0 for freq in bc: cf=cf+freq ec1.append(cf) pf=cf*100/len(sub_copy) pec1.append(pf)
print('cumulative frequency for employment rate with a high suicide rate')
print(ec1)
print('cumulative percentage for employment rate with a high suicide rate')
print(pec1)
print('Employment Rate with a High Suicide Rate') fmt1 = '%5s %12s %9s %12s %12s' fmt2 = '%5.2f %10.d %10.2f %10.d %12.2f' print(fmt1 % ('Rate','Freq.','Percent','Cum. Freq.','Cum. Percent')) for i, (key, var1, var2, var3, var4) in enumerate(zip(ec.keys(),ec,pec,ec1,pec1)): print(fmt2 % (key, var1, var2, var3, var4)) fmt3 = '%5s %10s %10s %10s %12s' print(fmt3 % ('NA', '2', '3.77', '53', '100.00'))
END
0 notes
Text
Assignment 1
Data set: GapMinder Data.
Research question: Is a fertility rate associated with a number of breast cancer cases?
Items included in the CodeBook:
For fertility rate:
Children per woman (total fertility)
Children per woman (total fertility), with projections
For breast cancer:
Breast cancer, deaths per 100,000 women
Breast cancer, new cases per 100,000 women
Breast cancer, number of female deaths
Breast cancer, number of new female cases
Literature Review:
From original source: http://ww5.komen.org/KomenPerspectives/Does-pregnancy-affect-breast-cancer-risk-and-survival-.html
The more children a woman has given birth to, the lower her risk of breast cancer tends to be. Women who have never given birth have a slightly higher risk of breast cancer compared to women who have had more than one child.
The hypothesis to explore using GapMinder data set: the higher fertility rate, the lower risk of breast cancer.
1 note
·
View note